


Founded in 2012 by industry veterans Nelson and Christopher Rising, Rising Realty Partners is a family-owned, Los-Angeles based, vertically integrated real estate investment and operating platform specializing in creating world-class commercial properties.
Their investment and operating philosophy is to add value and enhance financial returns through sustainable investment practices and leverage technology as a force multiplier to increase efficiency, reduce operating costs, and improve tenant satisfaction.
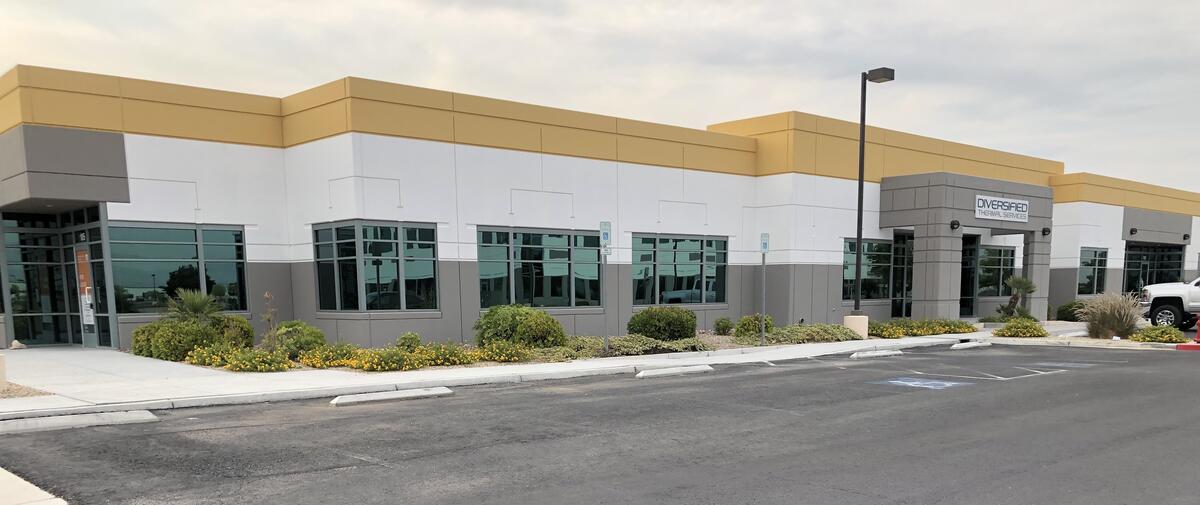
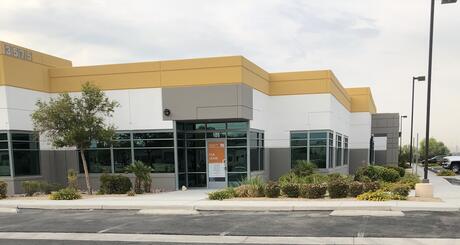
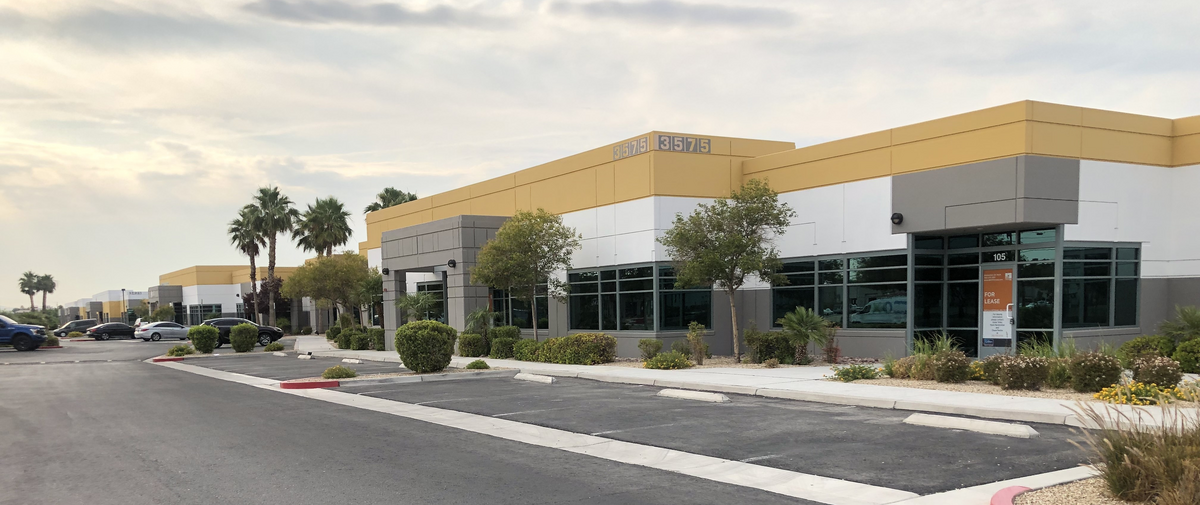
Cheyenne Airport Center is positioned in the market to provide functional units that range in size from 1,736 to 18,820 square feet and accommodate a wide range of users. The highly stable and diversified tenancy enjoyed 99% average rent collections in 2020 and should provide predictable and sustainable cash flow going forward. Cheyenne Airport Center positions itself to be a great value add opportunity to reposition vacant space with “market-ready” light industrial units which are highly sought after and in high demand. Las Vegas is one of the best performing and most desirable industrial markets in the country and is positioned for significant growth over the next 5 years.
| Tenant Name | Suite | SF | Lease Start | Lease End | Monthly Rent per SF |
| Andres Serenity Family Mortuary and Crematory, LLC | 3435-105 | 7,482 | 3/1/2021 | 4/30/2026 | $0.70 NNN |
| Ashley Briggs | 3395-111 | 6,020 | 6/1/2021 | 6/30/2026 | $0.72 NNN |
| Boomer Natural Wellness - Expansion | 3395-103, 3395-104, 3395-105, 3575-108 | 14,551 | 11/1/2019 | 10/31/2023 | $0.72 NNN |
| C. Martin Company, Inc. | 3395-101, 3395-102 | 7,776 | 1/1/2011 | 7/31/2021 | $1.27 NNN |
| City of North Las Vegas | 3525-102 | 10,250 | 7/1/2008 | 6/30/2023 | $1.29 NNN |
| Diversified Thermal Services, Inc. | 3575-107 | 3,868 | 12/1/2020 | 1/31/2024 | $0.70 NNN |
| Element Resources, LLC | 3395-110 | 1,736 | 5/1/2020 | 4/30/2023 | $0.63 NNN |
| Enviro-Con Integrated Solutions, LTD | 3575-101 | 2,521 | 5/15/2020 | 12/31/2023 | $0.70 NNN |
| Heroic Supply | 107-108 | 6,866 | 4/1/2019 | 3/31/2022 | $0.69 NNN |
| Las Vegas Custom Signs, LLC | 3575-103 | 3,465 | 9/1/2020 | 12/31/2025 | $0.67 NNN |
| Lighthouse Charities, Inc. | 3435-103-104 | 7,437 | 12/1/2016 | 11/30/2024 | $0.65 NNN |
| Mobility Works | 3575-105-106 | 8,290 | 9/1/2021 | 11/30/2031 | $0.72 NNN |
| Nevada Orthotics & Prosthetics, Inc. | 3435-102 | 4,034 | 4/1/2017 | 6/30/2022 | $0.90 NNN |
| Pinnacle Community Services | 3355-103, 3435-101 | 18,820 | 1/1/2011 | 11/30/2024 | $1.04 NNN |
| Rapid Expeditionary Concepts, LLC | 3575-109-111 | 10,681 | 2/1/2019 | 10/31/2022 | $0.67 NNN |
| RGL | 3525-111 | 5,917 | 5/1/2021 | 6/30/2026 | $0.72 NNN |
| Shield Fire & Security, LLC | 3395-109 | 3,464 | 1/1/2013 | 2/28/2026 | $0.71 NNN |
| The Department of Veteran Affairs | 3525-106 | 11,576 | 5/10/2012 | 5/31/2022 | $2.04 Gross |
| Wildhorse Investments, LLC | 3395-106 | 4,176 | 9/1/2020 | 10/31/2023 | $0.69 NNN |
| Zenza Life Sciences, LLC | 3525-109 | 5,053 | 5/1/2019 | 4/30/2022 | $0.69 NNN |
| Total/Averages | 143,983 | $0.83 |
Lease Comparables
| 2410-2450 Fire Mesa Street | 7371 Prairie Falcon Rd. | 3965 W. Cheyenne Ave | 3925 W. Cheyenne Ave | 730 W. Cheyenne Ave | 730 W. Cheyenne Ave | 2915 Losee Road | 2915 Losee Road | Subject | |||
| Year Built | 1963 | 2003 | 2003 | 2000 | 2004-2006 | 2004-2006 | 2001 | 2001 | 2006 | ||
| Lease Date | November 2019 | June 2020 | October 2020 | September 2020 | Lease Out | December 2020 | July 2020 | November 2020 | July 2021 | ||
| In-Place Rent PSF | $1.45 | $1.25 | $1.15 | $0.95 | $0.78 | $0.75 | $0.76 | $0.77 | $0.72 | ||
| Term (Months) | 60 | 36 | 86 | 36 | 62 | 36 | 37 | 62 | 62 | ||
| Escalations | 3% | 3% | 5% | 3% | 4% | 4% | 4% | 4% | 4% | ||
| Free Rent (Months) | 2 | 2 | 2 | 1 | 1 | 1 | 1 | 1 | 2 | ||
| Lease Type (New/Renew) | New | New | New | New | New | New | New | New | New | ||
| Distance from subject | 2.0 mi | 4.8 mi | 5.2 mi | 0.3 mi | 2.4 mi | 2.4 mi | 3.9 mi | 3.9 mi | |||
Sales Comparables
| 6565 Polaris Ave | Hughes Airport Ctr | 3955 W Mesa Vista | Spencer Airport Ctr | Buffalo Business Park | Averages | Subject | |||
| Date Sold | July 2019 | March 2020 | December 2020 | April 2020 | Oct 2019 | 2021 | |||
| Sales Price | $51,100,000 | $72,000,000 | $29,989,250 | $15,200,000 | $13,850,000 | $50,254,215 | $20,850,000 | ||
| Sales Price (PSF) | $146 | $169 | $184 | $147 | $193 | $163 | $145 | ||
| Year Built | 1964-2000 | 1987-1991 | 1995 | 1999-2000 | 2019 | 2007 | 2006 | ||
| Cap Rate | 4.71% | 4.81% | 5.00% | 5.15% | 3.56% | 4.65% | 6.37% | ||
| Rentable SF | 350,843 SF | 425,752 SF | 163,165 SF | 103,613 SF | 71,872 SF | 223,049 SF | 143,928 SF | ||
| Percentage Leased: | 100% | 100% | 93% | 100% | 52% | 89% | 94% | ||
| Distance from subject | 12.6 mi | 16.1 mi | 11.3 mi | 16.0 mi | 10.1 mi | 13.2 mi | |||
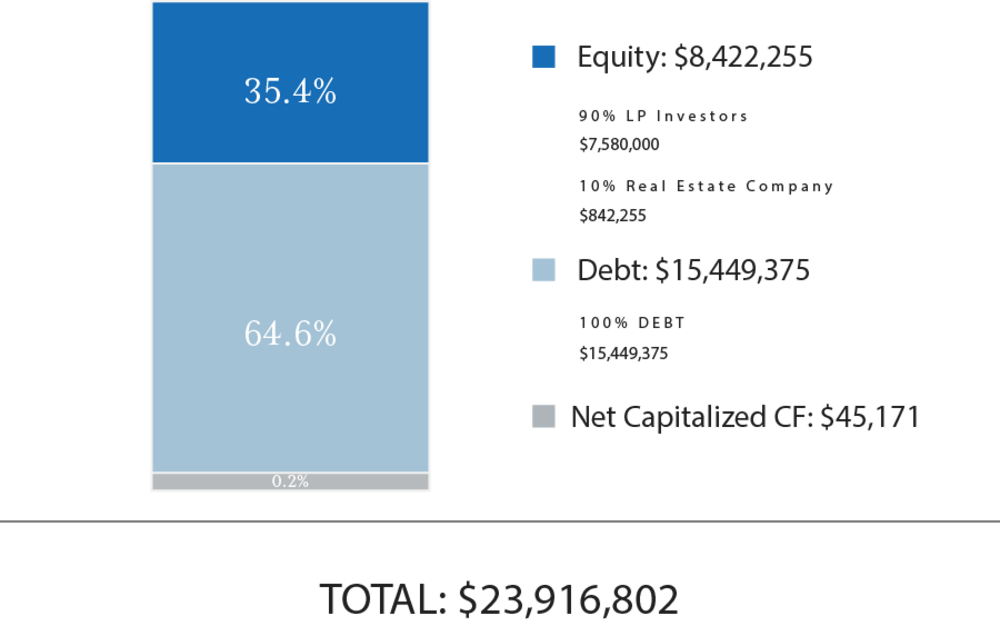
Total Capitalization
| Sources of Funds | $ Amount | $/SF |
| Debt | $13,552,500 | $94 |
| Additional Debt Future Funded (if any) | $1,896,875 | $13 |
| GP Investor Equity | $842,255 | $6 |
| LP Investor Equity | $7,580,000 | $53 |
| Net Capitalized Cash Flow | $45,171 | $0 |
| Total Sources of Funds | $23,916,802 | $166 |
| Uses of Funds | $ Amount | $/Unit |
| Purchase Price | $20,850,000 | $145 |
| Leasing Costs | $716,875 | $5 |
| Capital Expenditures | $1,225,171 | $9 |
| Working Capital | $200,000 | $1 |
| Financing Fees | $177,668 | $1 |
| Closing Costs(1) | $747,088 | $5 |
| Total Uses of Funds | $23,916,802 | $166 |
Please note that Rising Realty Partner's equity contribution may consist of friends and family equity and equity from funds controlled by Rising Realty Partners. Additionally, the numbers represented above can change prior to closing depending on final loan proceeds, property condition assessments, appraisals, final closing costs, and other lender-mandated expenses.
(1) RM Technologies operates the RealtyMogul platform. RM Technologies charges a fixed, non-percentage-based fee for real estate companies to use the marketplace. An estimate of this fee is included in the Closing Costs and is intended to be capitalized into the transaction at the discretion of the Manager.
The expected terms of the debt financing are as follows:
- Lender: Citizen's Bank
- Term: 3+1+1
- Loan-to-Cost: 65.0%
- Estimated Proceeds: $15,449,375
- Interest Type: Full I/O
- Spread Above One-Month LIBOR: L + 2.25% : L + 2.15% to swap to fixed (2.76% expected rate)
- Interest-Only Period: 3+1+1
- Amortization: 360 day schedule after Year 3
- Prepayment Terms: N/A
- Loan Extensions: Yes with conditional approvals
There can be no assurance that a lender will provide debt on the rates and terms noted above, or at all. All rates and terms of the debt financing are subject to lender approval, including but not limited to possible increases in capital reserve requirements for funds to be held in a lender-controlled capital reserve account.
A substantial portion of the total acquisition for the Property will be paid with borrowed funds. The use of borrowed money to acquire real estate is referred to as leveraging. Leveraging increases the funds available for investment or development purposes, on the one hand, but also increases the risk of loss on the other. If the Company were unable to pay the payments on the borrowed funds (called a "default"), the lender might foreclose, and the Company could lose its investment in its property.
Rising Realty Partners intends to make distributions from RM RRP Cheyenne, LLC as follows:
- To the Investors, pari passu, all operating cash flows to a 9.0% IRR;
- 85% / 15% (85% to Investors / 15% to Promote) of excess cash flow to a 14.0% IRR;
- 80% / 20% (80% to Investors / 20% to Promote) of excess cash flow to a 18.0% IRR;
- 75% / 25% (75% to Investors / 25% to Promote) of excess cash flow thereafter.
Rising Realty Partners intends to make distributions to investors after the payment of both company's liabilities (loan payments, operating expenses, and other fees as more specifically set forth in the LLC agreements, in addition to any member loans or returns due on member loan).
Distributions are expected to start in November 2021 and are projected to continue on a quarterly basis thereafter. Distributions are at the discretion of Rising Realty Partners, who may decide to delay distributions for any reason, including maintenance or capital reserves. Rising Realty Partners will receive a promote as indicated above, and a portion of this promote may be received by RM Admin, LLC for administrative services.
| Cash Flow Summary | ||||
| Year 1 | Year 2 | Year 3 | ||
| Effective Gross Revenue | $1,940,117 | $2,011,436 | $2,007,321 | |
| Total Operating Expenses | $614,882 | $633,984 | $649,781 | |
| Net Operating Income | $1,325,235 | $1,377,452 | $1,357,540 | |
| Project-Level Cash Flows | ||||
| Year 0 | Year 1 | Year 2 | Year 3 | |
| Net Cash Flow | -$8,422,255 | $817,919 | $848,662 | $12,438,162 |
| Investor-Level Cash Flows* | ||||
| Year 0 | Year 1 | Year 2 | Year 3 | |
| Net Cash Flow | -$7,580,030 | $660,324 | $687,993 | $10,535,141 |
| Investor-Level Cash Flows - Hypothetical $50,000 Investment* | ||||
| Year 0 | Year 1 | Year 2 | Year 3 | |
| Net Cash Flow | -$50,000 | $4,356 | $4,538 | $69,491 |
*Returns are net of all fees including RM Admin's 1.0% administrative services fee.
NO ASSURANCE OF RETURN: The Company's pro-forma projections are based on assumptions regarding future events, such as the timing and extent of the recovery of the residential market and the stabilization of the debt markets. While the Manager believes that these assumptions are reasonable and achievable, the likelihood of its occurrence is subject to many factors that are not within the control of the Company or its Manager and that could impair the ability of the Company to meet its projections.
Certain fees and compensation will be paid over the life of the transaction; please refer to Rising Realty Partners' materials for details. The following fees and compensation will be paid(1)(2)(3):
| One-Time Fees: | ||||
| Type of Fee | Amount of Fee | Received By | Paid From | |
| Acquisition Fee | 1.5% of Purchase Price | Rising Realty Partners | Total Capitalization | |
| Disposition Fee | 0.25% of Sale Price | Rising Realty Partners | Total Capitalization | |
| Recurring Fees: | |||||
| Type of Fee | Amount of Fee | Received By | Paid From | ||
| Asset Management Fee | 1.0% of EGI | Rising Realty Partners | Cash Flow | ||
| Property Management Fee | 5.0% of EGI | Rising Realty Partners | Cash Flow | ||
| Administrative Services Fee | 1.0% of Equity* | RM Admin(3) | Cash Flow | ||
*Only applies to equity raised through the RealtyMogul Platform
(1) Fees may be deferred to reduce impact to investor distributions.
(2) RM Technologies operates the RealtyMogul platform. RM Technologies charges a fixed, non-percentage-based fee for real estate companies to use the marketplace. An estimate of this fee is included in the Closing Costs and is intended to be capitalized into the transaction at the discretion of the Manager.
(3) RM Admin will be providing the following services: (a) responding to inbound investor inquiries regarding how to subscribe to the Project, (b) distribution of all annual tax forms (after receipt of same from Project Sponsor), (c) processing distributions that are payable from RM RRP Cheyenne, LLC to Investors, however, RM Admin will not be deemed to have custody of client funds, (d) distribution of all quarterly reports (after receipt of same from Project Sponsor) and (e) summarizing sponsor information on property performance, responding to investor inquiries regarding sponsor performance information as well as the real estate market generally.
The information on this Page is qualified in its entirety by reference to the more complete information about the offering contained in the Sponsor’s Investment Documents. The information on this Page is not complete and subject to change at the Sponsor’s discretion at any time up to the closing date. The Sponsor’s Investment Documents and supplements thereto contain important information about the Sponsor’s offering including relevant investment objectives, the business plan, risks, charges, expenses, and other information, which you should consider carefully before investing. The information on this Page should not be used as a basis for an investor’s decision to invest.
Risk of InvestmentThis investment is speculative, highly illiquid, and involves substantial risk. There can be no assurances that all or any of Sponsor’s assumptions, expectations, estimates, goals, hypothetical illustrations, or other aspects of Sponsor’s business plans (“Assumptions”) will be true or that actual performance will bear any relation to Sponsor’s Assumptions, and no guarantee or representation is made that Sponsor’s Assumptions will be achieved. If Sponsor does not achieve its Assumptions, your investment could be materially and adversely affected. A loss of part or all of the principal value of your investment may occur. You should not invest unless you can readily bear the consequences of such loss. Sponsor’s Assumptions should not be relied upon as the primary basis for your decision to invest.
No Reliance on Forward-Looking Statements; Sponsor AssumptionsSponsor is solely responsible for statements made concerning forward-looking statements and Assumptions, which apply only as of the date made, are preliminary and subject to change, and are expressly qualified in their entirety by the disclosures and cautionary statements included in Sponsor’s Investment Documents, which you should carefully review. Sponsor is obligated to update or revise such forward-looking statements or Assumptions to reflect events or circumstances that arise after the date made or to reflect the occurrence of unanticipated events. Sponsor’s forward-looking statements and Assumptions are hypothetical, not based on actual investment achievements or events, and are presented solely for purposes of providing insight into the Sponsor’s investment objectives, detailing Sponsor’s anticipated risk and reward characteristics, and establishing a benchmark for future evaluation of actual results; therefore, they are not a predictor, projection, or guarantee of future results. You should not rely on Sponsor’s forward-looking statements as a basis to invest.
Importantly, we do not adopt, endorse, or provide any assurance of returns or as to the accuracy or reasonableness of Sponsor’s Assumptions or forward-looking statements.
No Reliance on Past PerformanceAny description of past performance is not a reliable indicator of future performance and should not be relied upon as the primary basis to invest.
Sponsor’s Use of DebtA substantial portion of the total cost of the real estate asset acquired by the Sponsor with investor funds (“Property”) will be paid with borrowed funds, i.e., debt. Sponsor’s estimated rates and terms of the debt financing are subject to lender approval, and there is no assurance that the Sponsor will secure debt at the rates and terms presented on this Page or in the Sponsor’s Investment Documents, or at all. The use of borrowed money to acquire real estate is referred to as leveraging, which can amplify losses and could result in lender foreclosure. In addition, if the debt includes a variable (or “floating”) interest rate, the total amount of interest paid over the term of the debt will fluctuate and can increase. As a result, Sponsor’s use of debt can result in a loss of some or all of your investment.
Sponsor’s Offering is Not RegisteredSponsor’s securities offering will not be registered under the Securities Act of 1933, as amended (the “Securities Act”), in reliance upon the exemptions from registration pursuant to Rule 506(c) of Regulation D as promulgated under the Securities Act (“Private Placement”). In addition, the offering will not be registered under any state securities laws in reliance on exemptions from state registration. Such securities (your ownership interests) are subject to restrictions on transferability and resale and may not be transferred or resold except as permitted under applicable state and federal securities laws pursuant to registration or an available exemption. All Private Placements on the Platform are intended solely for “Accredited Investors,” as that term is defined in Rule 501(a) under the Securities Act.
No Investment AdviceNothing on this Page should be regarded as investment advice (either with respect to a particular security or regarding an overall investment strategy), a recommendation, an offer to sell, or a solicitation of or an offer to buy any security. Advice from a securities professional is strongly advised to understand and assess the risks associated with real estate or private placement investments.
1031 Exchange RiskInternal Revenue Code Section 1031 (“Section 1031”) contains complex tax concepts and certain tax consequences may vary depending on the individual circumstances of each investor. You should consult with and rely on your own tax advisor about the tax aspects with respect to your particular circumstances.