


SF Partners ("SF") is a Real Estate Investment firm established in 2009 with the primary focus of purchasing and managing commercial real estate in the state of Florida. The principals of SF, Charles Stuzin and Daniel Stuzin, have been involved in both the banking and real estate industries in South Florida for more than 40 years. In the past few years, SF has placed on an emphasis on expanding outside of Florida to find commercial projects that meet their investment criteria. They have recently invested in Colorado, Georgia, Kentucky, and South Carolina.
Since inception, SF has purchased and operated over twenty multi-tenant commercial properties primarily in the South Florida area. SF's strategy has been to identify commercial buildings where it can add value through increasing occupancy, rental rates, and reducing expenses. Many of the properties purchased by SF have also required substantial investment in capital improvements in order to achieve the aforementioned objectives.
The investment strategy is based upon acquiring and managing “sub‐performing” commercial real estate assets that offer attractive risk-based returns in the following property types: office, retail and light industrial. Typical deal size ranges from $1,000,000 ‐ $12,000,000. By focusing on smaller commercial properties, SF believes it can find value as there are less sophisticated purchasers pursuing these type of deals. Transaction types are standard arms-length buyer/seller purchases but have also included the acquisition of: non-performing notes, portfolio purchases and REO assets. The management team has developed a strategy which allows for quick stabilization of the asset (typically within 12‐18 months). The “in-house” property management team also allows SF to keep expenses to a minimum while providing superior value to its tenants.
Since 2011, SF has owned and managed 1.6 million square feet of office properties with cumulative purchase prices of $135 million. SF has sold 11 properties with cumulative sale prices of $67 million.
RealtyMogul investors previously invested alongside SF Partners in the acquisition of the Hollywood Medical Office Building in October 2015 and the acquisition of Cinnamon Tree Plaza in May 2016. Hollywood Medical Office Building was subsequently sold in July 2018 which yielded a 32.5% IRR to RealtyMogul investors. Cinnamon Tree Plaza was subsequently sold in February 2018 which yielded an 18.0% IRR to RealtyMogul investors.
Past performance is not indicative of future results and there can be no assurance that RealtyMogul will achieve comparable results or be able to avoid losses.
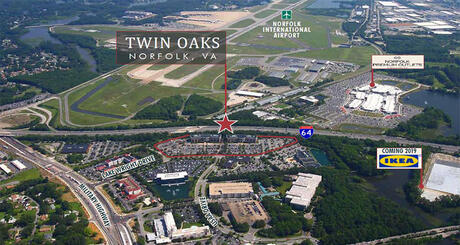
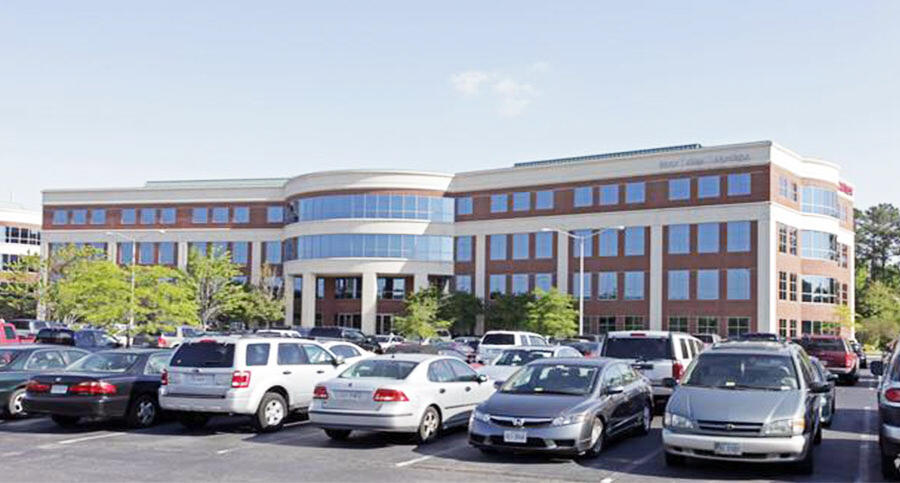
The Property is two four-story, 95% leased, Class A office buildings totaling 170,616 rentable sq. ft. with 773 parking spaces (4.52 spaces / 1,000 SF) and situated on 11.02 acres. The Properties are located within the Lake Wright Office Park, adjacent to Interstate 64, Military Highway, and Northampton Boulevard, and 0.1 miles from the Norfolk International Airport and six miles from downtown Norfolk. The Lake Wright Executive Center is a corporate campus with approximately 750,000 square feet of office space and four hotels with 572 rooms of lodging and on-site restaurants.
Twin Oaks I has a rentable SF of 84,634 SF and is currently 90% occupied. The building's largest tenant, Titan America, occupies roughly 33,023 SF (39% of Building I). Other major tenants at Twin Oaks I are Tetratech (6,359 SF), Biotelemetry, Inc. (7,729 SF), and UST Global (6,379 SF).
Twin Oaks II has a rentable SF of 85,982 SF and is currently 100% occupied. Twin Oaks II's largest tenant is Booz Allen at 34,577 SF (40% of Building II). Other major tenants at Twin Oaks II include Reddix (13,221 SF), the US Gov / GSA (TSA) (10,900 SF), and Falconwood (7,932 SF).
Construction for Twin Oaks I was completed in 1999 and Twin Oaks II in 2001. The buildings consist of a concrete foundation with slab on-grade. The exterior is primarily a brick veneer with pre-cast concrete accents and insulated glass windows.
Each building has a non-ballasted mechanically fastened membrane roof system. Each building has two hydraulic elevators.
Major Tenants:
Booz Allen Hamilton - Founded in 1914 and headquartered in McClean, VA, Booz Allen is a global consulting firm that advises public and private sector clients, primarily the U.S. government, on areas ranging from organization to strategy to logistics to information technology. Booz Allen is publicly traded on the NYSE under the ticker symbol: BAH. Between tenant improvement dollars and tenant invested dollars, the Real Estate Company reports that the tenant has invested over $4 million into the buildout of the space for their 2018 renewal.

Titan America - Titan America ("Titan") is a subsidiary of Titan Cement Group, which is a publicly traded company on the Athens Stock Exchange. The company has approximately 3,000 employees and is a leading supplier of heavy building materials in the United States. Titan is headquartered at the subject Property.

ARDX - Founded in 2006, ARDX is a healthcare management and consulting firm which focuses primarily on serving various integrated management and technology solutions agencies within the federal government. ARDX has been appraised at the highest maturity level of the Capability Maturity Model for Services (CMMI0SVC Level 5) by the CMMI® Institute. ARDX is amongst an elite group of companies who have achieved this recognition and one of few U.S. small businesses nationwide.

U.S. Government / GSA (TSA) - The Transportation Security Administration (TSA) is an agency of the United States Department of Homeland Security that has authority over the security of people traveling in the United States. The Aviation and Transportation Security Act was passed by the 107th Congress and signed on November 19, 2001 in response to the September 11 terrorist attacks.

UST Global - Founded in 1998 and headquartered in Aliso Viejo, California, UTS Global is a leading digital technology services provider for Global 1000 companies. The private company has over 15,000 associates operating in 25 countries in 4 continents.

Tetra Tech - Founded in Pasadena, California in 1966, Tetra Tech (NASDAQ: TTEK) is a leading worldwide provider of consulting and engineering services that has more than 250 offices throughout the United States. The company supports government and commercial clients by providing innovative solutions focused on water, environment, infrastructure, resource management, energy, and international development.
| Tenant | Square Footage | % of Total | Rent per SqFt | Lease Expiration | Lease Type |
|---|---|---|---|---|---|
| Booz Allen Hamilton | 34,577 | 20.2% | $22.00 | 4/30/2026 | Full Service Gross |
| Titan America | 33,023 | 19.3% | $21.58 | 5/31/2030 | Full Service Gross |
| ARDX | 13,221 | 7.7% | $27.04 | 7/31/2022 | Full Service Gross |
| US Gov / GSA (TSA) | 10,967 | 6.4% | $28.36 | 12/31/2022 | Full Service Gross |
| Falconwood | 7,932 | 4.6% | $23.34 | 1/31/2022 | Full Service Gross |
| UST Global | 6,379 | 3.7% | $27.86 | 1/31/2020 | Full Service Gross |
| Tetra Tech | 6,359 | 3.7% | $23.43 | 4/30/2024 | Full Service Gross |
| Coulee Techlin | 4,916 | 2.9% | $25.00 | 9/30/2022 | Full Service Gross |
| Bio Telemetry | 8,279 | 4.8% | $25.25 | 4/30/2024 | Full Service Gross |
| UST Global | 4,635 | 2.7% | $25.75 | 5/31/24 | Full Service Gross |
| Total | 126,762 | 74.1% | $23.54 | -- | -- |
| 440 Monticello | 283 Constitution | 4500 Main | 580 E Main | 5701 Cleveland | Total / Averages | Subject | |
|---|---|---|---|---|---|---|---|
| Submarket | Downtown | VA Beach CBD/Pembroke | VA Beach CBD/Pembroke | Downtown Norfolk | Newtown/Witchduck | -- | Central Norfolk |
| Costar Rating | 5-star | 4-star | 4-star | 4-star | 4-star | -- | 4-star |
| Date Signed | June-16 | May-17 | June-18 | April-16 | Feb-18 | -- | -- |
| Square Footage | 299,887 | 129,465 | 116,500 | 58,674 | 136,000 | 148,105 | 170,970 |
| Year Built (Renovated) | 2010 | 1983 (2005) | 2008 | 2000 | 1993 | 1998 | 1999 (2001) |
| Tenant | UBS | Magellan HRSC | Hazen and Sawyer | Tidewater CC | Hapag-Lloyd America | -- | -- |
| Average Rental Rate (FSG) | $30.00 | $25.50 | $24.50 | $19.25* | $21.00 | $24.05 | $25.11 |
| Parking Ratio per 1,000 SqFt | 6.17 | 0.00 | 1.83 | 3.07 | 5.00 | 3.21 | 4.52 |
| Distance from Subject (mi.) | 4.9 | 4.8 | 4.7 | 5.1 | 2.8 | 4.5 | -- |
*Building marketing space for $21.00 FSG as of 1/25/2019
| 1 BayPort | 5800 Northampton | 11827 Canon* | ADP Building | 300 E Main** | Total / Averages | Subject | |
|---|---|---|---|---|---|---|---|
| Date Sold | Oct-15 | Dec-15 | July-16 | April-17 | August-18 | -- | |
| Submarket | Oyster Point | Central Norfolk | Oyster Point | Downtown Norfolk | Downtown Norfolk | -- | Central Norfolk |
| Costar Rating | 3-star | 4-star | 3-star | 4-star | 4-star | -- | 4-star |
| Square Footage | 96,906 | 314,778 | 58,092 | 288,662 | 199,621 | 191,612 | 170,970 |
| Year Built (Renovated) | 2002 | 1994 (2014) | 2009 | 1974 (2017) | 1990 | 2000 | 1999 (2001) |
| Purchase Price | $18,000,000 | $56,825,100 | $9,760,641 | $57,000,000 | $18,550,000 | $32,027,148 | $24,475,000 |
| Price per SqFt | $185.75 | $180.52 | $168.02 | $197.46 | $92.93 | $164.94 | $144.45 |
| Cap Rate | -- | -- | -- | 7.00% | 7.94% | 7.5% | 6.85%*** |
| Parking Ratio per 1,000 SqFt | 2.04 | 4.00 | 5.00 | 2.67 | 0.99 | 2.94 | 4.52 |
| Distance from Subject (mi.) | 21.9 | 0.2 | 20.2 | 4.9 | 5.2 | 10 | -- |
*Sold as part of an 11-property portfolio
**Property had an occupancy rate of 81% upon sale
***Based on T-12 net operating income which included average occupancy of ~90%, $178,000 of free rent, and operating expenses which were 11% higher than UW projections. Note that the cap rate using In-Place Income and T-12 operating expenses is 9.2%.
| $ Amount | Per SqFt | % | |
|---|---|---|---|
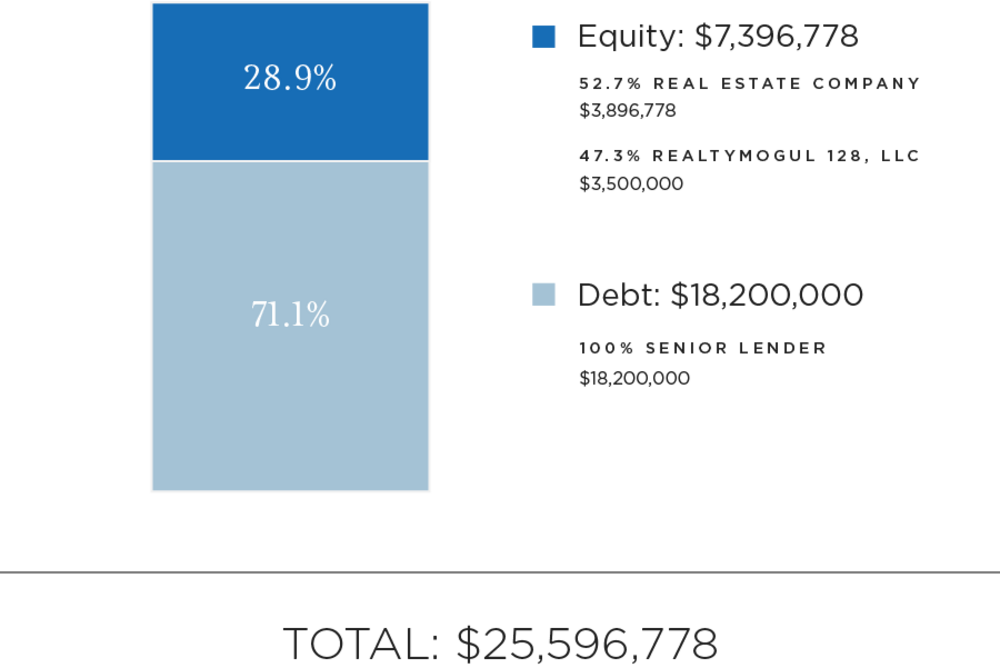
| Senior Loan | $18,200,000 | $106.67 | 71% |
| RM Equity (47%) | $3,500,000 | $20.51 | 14% |
| Real Estate Company Equity (53%) | $3,896,778 | $22.84 | 15% |
| Total | $25,596,778 | $150.03 | 100% |
| $ Amount | Per SqFt | % | |
|---|---|---|---|
| Purchase Price | $24,475,000 | $143.45 | 96% |
| Broker-Dealer Fee (4.3%) | $150,000 | $1.03 | 1% |
| CapEx Budget | $240,000 | $2.07 | 1% |
| Closing Costs & Fees | $378,050 | $1.41 | 1% |
| Working Capital | $185,000 | $1.08 | 1% |
| Pre-Paid Tax & Insurance | $168,728 | $0.99 | 1% |
| Total | $25,596,778 | $150.03 | 100% |
The Real Estate Company closed on a senior loan upon acquisition of the Property. The terms of the debt financing are as follows:
- Lender: Starwood Mortgage Capital
- Estimated Initial Proceeds: $18,200,000
- Maximum Additional Funding: None
- Estimated Interest Rate: 4.81% fixed rate
- Interest Only Period: 30 months
- Amortization Period: 30 years
- Loan Term: 65 months
- Extension Options: One 12-month extension at 400 basis points over the initial term fixed rate. Lender will sweep all cash if exercised.
- Prepayment Penalty: Locked out until September 30, 2023. Subject to the greater of yield maintenance or a 1% prepayment penalty thereafter. No prepay after August 6, 2024.
- Recourse: No
- Reserves: $1 per square foot per year for anticipated future leasing costs.
The Target intends to make distributions for all available cash and capital proceeds to investors (The Company, Other LP investors and Real Estate Company, collectively, the "Members") as follows:
- Pro-rata share of cash flow to an 8% IRR hurdle
- Excess balances will be split pro rata 70% to Members (pro rata in accordance with and in proportion to their respective Company Percentages) and 30% to Real Estate Company.
Note that these distributions will occur after the payment of The Company's liabilities (loan payments, operating expenses and other fees as set forth in the operating agreement, in addition to any member loans or returns due on member loans).
The Company will distribute 100% of its share of excess cash flow (after expenses and fees) to the members of The Company (the RealtyMogul investors).
Distributions are expected to start in September 2019 and are expected to continue on a bi-annual basis thereafter. These distributions are at the discretion of the Real Estate Company, who may decide to delay distributions for any reason, including maintenance or capital reserves.
| Year 1 | Year 2 | Year 3 | Year 4 | Year 5 | Reversion | |
|---|---|---|---|---|---|---|
| Effective Gross Revenue | $3,721,616 | $3,774,932 | $3,878,393 | $3,831,631 | $4,062,116 | $4,122,609 |
| Total Operating Expenses | $1,380,723 | $1,414,048 | $1,449,674 | $1,481,603 | $1,522,685 | $1,629,076 |
| Net Operating Income | $2,340,893 | $2,360,884 | $2,428,719 | $$2,350,028 | $2,539,431 | $2,493,533 |
| Year 0 | 2019 | 2020 | 2021 | 2022 | 2023 | Reversion | |
|---|---|---|---|---|---|---|---|
| Distributions to Company | ($3,535,000) | $464,358 | $551,102 | $551,654 | $456,840 | $342,809 | $4,274,723 |
| Net Earnings to Investor - Hypothetical $50,000 Investment | ($50,000) | $6,582 | $7,795 | $7,803 | $6,462 | $4,849 | $60,463 |
Certain fees and compensation will be paid over the life of the transaction. The following fees and compensation will be paid:
| Type of Fee | Amount of Fee | Received By | Paid From | Notes | |
|---|---|---|---|---|---|
| Deferred Acquisition Fee | $100,000 | Real Estate Company | Capitalized Equity Contribution | $25,000 to be taken out of cash flow for first four years of hold period | |
| Broker-Dealer Fee | $150,000 (4.3% of equity raised) | North Capital 1 | Capitalized Equity Contribution | ||
| Disposition Fee | $183,348 (0.625% of gross reversion value) | RM Manager, LLC |
|
RM Manager, LLC will receive the greater of 0.625% of the gross reversion value or $168,750. |
| Type of Fee | Amount of Fee | Received By | Paid From | Notes |
|---|---|---|---|---|
| Property Management Fee | 3.0% of Effective Gross Income | Real Estate Company, Property Manager | Distributable Cash | Real Estate Company is charging 1.0% of Effective Gross Income for accounting fees; Colliers, the property manager, is charging 2.0% of EGI |
| Management and Administrative Fee | 1.0% of amount invested by Realty Mogul 128, LLC | RM Manager, LLC | Distributable Cash |
RM Manager, LLC is the Manager of The Company and a wholly-owned subsidiary of Realty Mogul, Co. |
(1) Certain employees of Realty Mogul, Co. are registered representatives of, and are paid commissions by, North Capital Private Securities Corp., a Delaware corporation ("North Capital"). In addition, North Capital pays a technology provider services fee to Realty Mogul, Co. for licensing and access to certain technology, reporting, communications, branding, entity formation and administrative services performed from time to time by Realty Mogul, Co., and North Capital and Realty Mogul, Co. are parties to a profit sharing arrangement.
(2) Fees may be deferred to reduce impact to investor distributions.
The above presentation is based upon information supplied by the Real Estate Company or others. Realty Mogul, Co., RM Manager, LLC, and The Company, along with their respective affiliates, officers, directors or representatives (the "RM Parties") hereby advise you that none of them has independently confirmed or verified any of the information contained herein. The RM Parties further make no representations as to the accuracy or completeness of any such information and undertake no obligation now or in the future to update or correct this presentation or any information contained herein.
RM Securities, LLC, its registered representatives, affiliates, associated persons, and personnel of its affiliates who may also be associated with it, including our associated persons and personnel of our affiliates who are also be associated with RM Securities, LLC (it (“RM Securities,” “we,” “our,” or “us”) will receive fees, expense reimbursements, and other compensation (“Fees”) from the issuer of this investment offering, its sponsor, or an affiliate thereof (“Sponsor”), or otherwise in connection with Sponsor’s offering. The Fees paid to us are in addition to other fees you will pay to Sponsor or in connection with Sponsor’s investment offering. You will pay Fees to Sponsor, either directly or indirectly as an investor in the Sponsor’s offering. Sponsor will use the Fees you pay, as well as funds you invest in the relevant offering, to compensate us. The Fees paid to us will directly or indirectly be borne by you as the investor (typically, but not always, in the form of an expense of the Sponsor’s offering in which you invest) because such Fees will reduce the proceeds available for distribution to you and reduce the amount you earn over time.
For more information on the Fees paid to us, or any other Fees you will pay in connection with Sponsor’s offering, please carefully review the Sponsor’s Investment Documents. Please also carefully review RM Securities’ Form CRS, Regulation Best Interest Disclosures, and Limited Brokerage Services Agreement.
No Approval, Opinion or Representation, or Warranty by RM Securities, LLCSponsor has provided, approved, and is solely responsible in all aspects for the information on this webpage (“Page”), including Sponsor’s offering documentation, which may include without limitation the Private Placement Memorandum, Operating or Limited Partnership Agreement, Subscription Agreement, the Project Summary and all exhibits and other documents attached thereto or referenced therein (collectively, the “Investment Documents”). The Investment Documents linked on this page have been prepared and posted by Sponsor, and not by RM Securities. We did not assist in preparing, do not adopt or endorse, and we are not otherwise responsible for, the Sponsor’s Investment Documents. We make no representations or warranties as to the accuracy of information on this Page or in the Sponsor’s Investment Documents and we accept no liability therefor. No part of the information on this Page or in the Sponsor’s Investment Documents is intended to be binding on us.
Sponsor’s Information Qualified by Investment DocumentsThe information on this Page is qualified in its entirety by reference to the more complete information about the offering contained in the Sponsor’s Investment Documents. The information on this Page is not complete and subject to change at the Sponsor’s discretion at any time up to the closing date. The Sponsor’s Investment Documents and supplements thereto contain important information about the Sponsor’s offering including relevant investment objectives, the business plan, risks, charges, expenses, and other information, which you should consider carefully before investing. The information on this Page should not be used as a basis for an investor’s decision to invest.
Risk of InvestmentThis investment is speculative, highly illiquid, and involves substantial risk. There can be no assurances that all or any of Sponsor’s assumptions, expectations, estimates, goals, hypothetical illustrations, or other aspects of Sponsor’s business plans (“Assumptions”) will be true or that actual performance will bear any relation to Sponsor’s Assumptions, and no guarantee or representation is made that Sponsor’s Assumptions will be achieved. If Sponsor does not achieve its Assumptions, your investment could be materially and adversely affected. A loss of part or all of the principal value of your investment may occur. You should not invest unless you can readily bear the consequences of such loss. Sponsor’s Assumptions should not be relied upon as the primary basis for your decision to invest.
No Reliance on Forward-Looking Statements; Sponsor AssumptionsSponsor is solely responsible for statements made concerning forward-looking statements and Assumptions, which apply only as of the date made, are preliminary and subject to change, and are expressly qualified in their entirety by the disclosures and cautionary statements included in Sponsor’s Investment Documents, which you should carefully review. Neither RM Securities nor Sponsor are obligated to update or revise such forward-looking statements or Assumptions to reflect events or circumstances that arise after the date made or to reflect the occurrence of unanticipated events. Sponsor’s forward-looking statements and Assumptions are hypothetical, not based on actual investment achievements or events, and are presented solely for purposes of providing insight into the Sponsor’s investment objectives, detailing Sponsor’s anticipated risk and reward characteristics, and establishing a benchmark for future evaluation of actual results; therefore, they are not a predictor, projection, or guarantee of future results. You should not rely on Sponsor’s forward-looking statements as a basis to invest.
Importantly, we do not adopt, endorse, or provide any assurance of returns or as to the accuracy or reasonableness of Sponsor’s Assumptions or forward-looking statements.
No Reliance on Past PerformanceAny description of past performance is not a reliable indicator of future performance and should not be relied upon as the primary basis to invest.
Sponsor’s Use of DebtA substantial portion of the total cost of the real estate asset acquired by the Sponsor with investor funds (“Property”) will be paid with borrowed funds, i.e., debt. Sponsor’s estimated rates and terms of the debt financing are subject to lender approval, and there is no assurance that the Sponsor will secure debt at the rates and terms presented on this Page or in the Sponsor’s Investment Documents, or at all. The use of borrowed money to acquire real estate is referred to as leveraging, which can amplify losses and could result in lender foreclosure. In addition, if the debt includes a variable (or “floating”) interest rate, the total amount of interest paid over the term of the debt will fluctuate and can increase. As a result, Sponsor’s use of debt can result in a loss of some or all of your investment.
Sponsor’s Offering is Not RegisteredSponsor’s securities offering will not be registered under the Securities Act of 1933, as amended (the “Securities Act”), in reliance upon the exemptions from registration pursuant to Rule 506(c) of Regulation D as promulgated under the Securities Act (“Private Placement”). In addition, the offering will not be registered under any state securities laws in reliance on exemptions from state registration. Such securities (your ownership interests) are subject to restrictions on transferability and resale and may not be transferred or resold except as permitted under applicable state and federal securities laws pursuant to registration or an available exemption. All Private Placements on the Platform are intended solely for “Accredited Investors,” as that term is defined in Rule 501(a) under the Securities Act.
No Investment AdviceNothing on this Page should be regarded as investment advice (either with respect to a particular security or regarding an overall investment strategy), a recommendation, an offer to sell, or a solicitation of or an offer to buy any security. Advice from a securities professional is strongly advised to understand and assess the risks associated with real estate or private placement investments. For additional information on RM Securities’ involvement in this offering, please carefully review the Sponsor’s Investment Documents, and RM Securities’ Form CRS, Regulation Best Interest Disclosures, and Limited Brokerage Services Agreement.
1031 Exchange RiskInternal Revenue Code Section 1031 (“Section 1031”) contains complex tax concepts and certain tax consequences may vary depending on the individual circumstances of each investor. RM Securities and its affiliates make no representation or warranty of any kind with respect to the tax consequences of your investment or that the IRS will not challenge any such treatment. You should consult with and rely on your own tax advisor about the tax aspects with respect to your particular circumstances.