FORMALIZED DUE DILIGENCE PROCESS 
Sponsors

The team at our affiliated broker-dealer, RM Securities, conducts diligence on of the issuer, including detailed background checks, criminal checks, bad actor checks, and reference checks on sponsors. In addition to screening for any criminal background, we may also turn down sponsors due to poor reference checks, even if the background and criminal checks are satisfactory.

Escrow accounts

We require unaffiliated sponsors to use an unaffiliated third-party escrow agent.* When an investor makes an investment with such sponsors using the RealtyMogul platform, the investor’s money is transferred directly into a third-party escrow account. All closing conditions in connection with a sponsor’s contingency offering need to be met before the third-party escrow agent will approve releasing investor funds to the issuer or general partner. For example, if an issuer or general partner plans to use funds for a real estate acquisition that does not ultimately transact, the third-party escrow agent will not transfer investor funds to the issuer or general partner, and funds will be returned to investors.

* Unless otherwise disclosed, escrow accounts are not required for some investments that accommodate 1031 investments where the property is already acquired.

Boots on the ground

Our processes typically includes visiting certain properties (or a subset of properties if it's a fund) to confirm the real estate is what and where the real estate is supposed to be. For certain properties that accommodate 1031 exchange investments, the team will review third-party prepared due diligence reports in lieu of a site visit.

Detailed Checklists

We have formalized processes and checklists for every private placement deal listed on the platform.

Confidentiality Agreement
To access the Sponsor’s private offering documents for this investment, you must first acknowledge and agree to the below.
By clicking the ‘I Agree’ button below:
Completed Equity
Estimated Hold Period 5 years
Estimated First Distribution 6/2019
FUNDED 100%
...
View Our Due Diligence Process
Offered By
Clairmont Group, LLC
Investment Strategy Value-Add
Investment Type Equity
Overview
Value-add acquisition of a multifamily asset with institutional-quality sponsorship and management.
Partner

Experienced real estate company that reports having invested over $937 million in real estate with an emphasis in Northeast value-add multifamily.

Value-Add

There is an opportunity to renovate the properties and increase rental income. $6,906 is budgeted per unit for interior renovations to increase rents $222 per unit upon completion.

Market

Median household income in a 1-mile radius is $135,393 and $130,079 in a 3-mile radius per CoStar.

Property at a glance
Year Built 1973
# of Units 164
# of Buildings Four
Current Occupancy 92.9% (per June 2018 rent roll)
Parking Ratio 2.4 per unit
Acquisition Price $24,000,000
Investment Highlights
Well Located: The Property is situated in a major, affluent market with favorable fundamentals; in close proximity to retail amenities, public transportation, strong schools, and high median home prices.
Potential for Outsized Returns: Although located in an area with minimal historical development, recent changes in state law create the potential to entitle a portion of the low-density site for more units. Additionally, the base case underwriting assumes a mid-level unit upgrade plan of $6,906 per unit. If the Real Estate Company determines higher than expected rental premiums are achievable, it may use available loan capacity to fund a higher-level upgrade plan.
Management
Cumulative Distributions

Clairmont Group, LLC

Clairmont Group, LLC is a New York based, diversified real estate company that is engaged in the acquisition, development and management of real estate, as well as advisory services. The firm employs a fundamental, value-driven investment strategy and invests alongside institutional and private clients in a broad range of real estate and real estate-related investments. Clairmont has deep experience in sourcing, executing and managing real estate transactions. The company specializes in mixed-use, multifamily and hospitality asset classes with consideration given to retail, office and industrial assets. Clairmont Group, LLC is a repeat Real Estate Company and is reportedly performing well (per RM asset management) on their March 2016 acquisition of a 23-unit multifamily asset in New Jersey.

http://clairmontgrp.com/overview
  • David Lubin
    Managing Partner
  • Ryan Colbert
    Managing Partner
David Lubin
Managing Partner

David Lubin is a co-founder and managing partner at the Clairmont Group. He has closed over 50 transactions valued in excess of $2.0 billion in his career and has acquired over $600 million in commercial real estate over the past 5 years . Prior to joining Clairmont, Mr. Lubin has worked at large institutional investment companies such as MetLife, Allianz, AREA Property Partners (formally Apollo Management) and C-III Capital Partners. His experience includes investments in core, value-add, opportunistic,distressed real estate, note purchases, development, fund investments, and coinvestments across all major asset classes including: multifamily, hospitality, office, industrial, retail, senior living and real estate operating companies.

Ryan Colbert
Managing Partner

Ryan Colbert is a co-founder and managing partner at the Clairmont Group. Mr. Colbert has over a decade of institutional real estate equity investment experience in both domestic & international markets and has acquired over $1 billion worth of commercial real estate. His experience includes investments in distressed real estate & note purchases, recapitalizations, JV partner buy-outs and direct secondary investing across all major asset classes.

Track Record

Clairmont Group, LLC Track Record
Address Location Asset Type Date Acquired Market Value
Orange Garden Apartments Orange, NJ Multifamily Aug-13 $3,150,000
Harvard Apartments East Orange, NJ Multifamily Jul-14 $3,250,000
Park Avenue Apartments Plainfield, NJ Multifamily Mar-16 $4,025,000
East Orange Portfolio East Orange, NJ Multifamily Sep-16 $21,000,000
The Shops at Pennsville Pennsville, NJ Retail Nov-17 $9,500,000
Clairmont Group AUM       $40,925,000
             
Fairfield Inn     East Rutherford, NJ Hotel Jul-10 $18,700,000
Everson Pointe     Atlanta, GA Retail Dec-10 $9,000,000
North Point     Boston, MA Multifamily Nov-10 $185,800,000
Woodland Park     Hernadon, VA Multifamily Nov-10 $84,000,000
TownePlace Suites   Metairie, LA Hotel Jan-11 $15,300,000
Rego Park     Queens, NY Multifamily Mar-11 $19,000,000
Crowne Plaza Boston North Shore Danvers, MA Hotel Mar-11 $27,000,000
Holiday Inn Express   East Brunswick, NJ Hotel Jun-11 $9,000,000
Crowe's Crossing   Atlanta, GA Retail Oct-11 $12,000,000
Marriott Courtyard   Parsippany, NJ Hotel Nov-11 $10,000,000
DePaul Plaza Shopping Center St. Louis, MO Retail Nov-11 $20,000,000
Shasta Crossroads   Redding, CA Retail Dec-11 $9,000,000
Hampton Inn     Woodbridge, VA Hotel Mar-12 $10,500,000
Meridian Village     Bellingham, WA Retail Apr-12 $15,000,000
Fairfield Inn     Chantilly, VA Hotel Aug-12 $8,000,000
Washington Business Park Lanham, MD Office Sep-12 $45,000,000
The Center Building   Queens, NY Office Dec-12 $84,500,000
Cotton Exchange Hotel New Orleans, LA Hotel Mar-13 $30,000,000
7000 Central Park   Atlanta, GA Office Sep-13 $75,000,000
The Edge     Brooklyn, NY Retail Dec-13 $45,500,000
Paces Village Apartments Greensboro, NC Multifamily Dec-13 $15,000,000
Marina Shores Apartments Virginia Beach, VA Multifamily Mar-14 $54,000,000
Broad Street Apartments Richmond, VA Multifamily Sep-14 $11,000,000
Courtyard by Marriott Shelton, CT Hotel Oct-14 $18,000,000
Free Market Portfolio Brooklyn, NY Multifamily Dec-13 $5,000,000
Eastern Parkway Portfolio Brooklyn, NY Multifamily Oct-14 $15,000,000
Brooklyn 9 Portfolio Brooklyn, NY Multifamily Aug-15 $30,000,000
330 East 22nd Street Brooklyn, NY Multifamily Jul-16 $5,000,000
509 Saratoga Avenue Brooklyn, NY Multifamily Jun-17 $7,500,000
497 Dean Street Brooklyn, NY Multifamily Aug-17 $4,000,000
Prior Investment Activity       $896,800,000
             
Grand Total       $937,725,000


Track Record includes transactions the management team completed as investors and Principals of other firms.

The management overview and track record detailed above was provided by the Real Estate Company and has not been verified by Realty Mogul or NCPS.

In this transaction, Realty Mogul investors are to invest in RealtyMogul 123, LLC ("The Company"), which is to subsequently invest in Avon 46, LLC ("The Target"), a limited liability company that will hold title to the Property. Clairmont Group, LLC (the "Real Estate Company") is under contract to purchase the Property for $24.00 million ($146,341 per unit) and the total project cost is expected to be $26.48 million ($161,442 per unit).

The Real Estate Company's business plan is to implement a value-add strategy by completing interior and exterior renovations at the Property. Planned unit interior upgrades will include new appliances, countertops, cabinetry, fixtures, flooring, lighting, and in-unit washers and dryers. Exterior / amenity improvements will consist of painting, lighting, new landscaping, a grill area and fire pit, and patio fences. This strategy assumes a renovation budget of $1.13 million or $6,906/unit and renovation pace of 130 units (79% of total) over 36 months or less (~3.8 units/month), which the Real Estate Company states is a comfortable pace given their track record. Pinnacle will be retained as the property manager and the pro forma financials assume that renovated units will be able to achieve rental premiums of $222 per unit per month upon completion.

Avon Place Apartments - Capital Expenditures Budget
CapEx Item $ Amount
Ranges/Ovens $52,000
Refrigerators/Freezers $65,000
Microwaves $13,000
Dishwashers $32,500
Cabinets $78,000
Cabinet Hardware $9,100
Countertops $39,000
Kitchen Faucets  $9,750
Vinyl Tile $8,385
Lighting Package $69,240
Showerheads $14,400
Faucets $14,400
Door Knobs $2,600
Breaker Panels $32,800
Vinyl Tile $58,695
Washer & Dryers (In-Unit) $390,000
Furniture Set $30,000
Wall Art $6,000
Paint $45,000
Carpeting/Rugs $30,000
Door Numbers $1,630
Grill Area and Fire Pit $25,000
Patio Fences $43,520
General Decorations $10,500
Labor $52,000
Total $1,132,520
Property Information

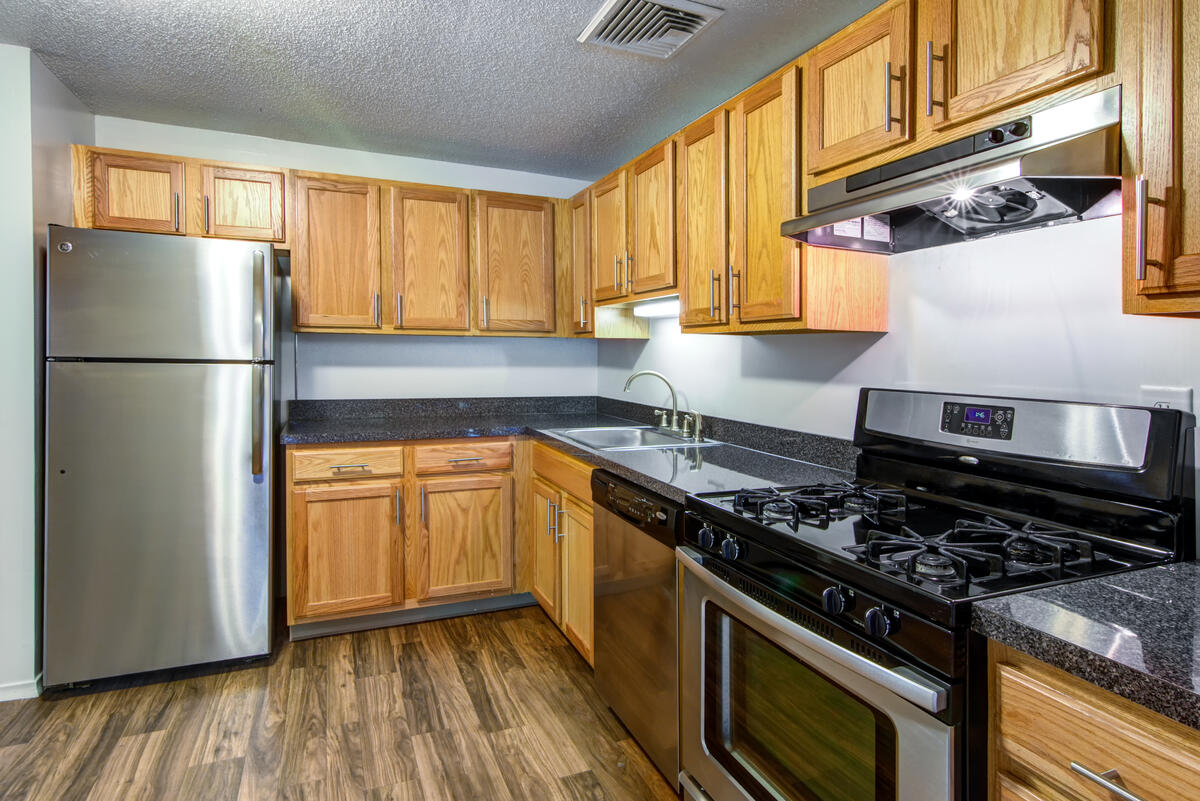
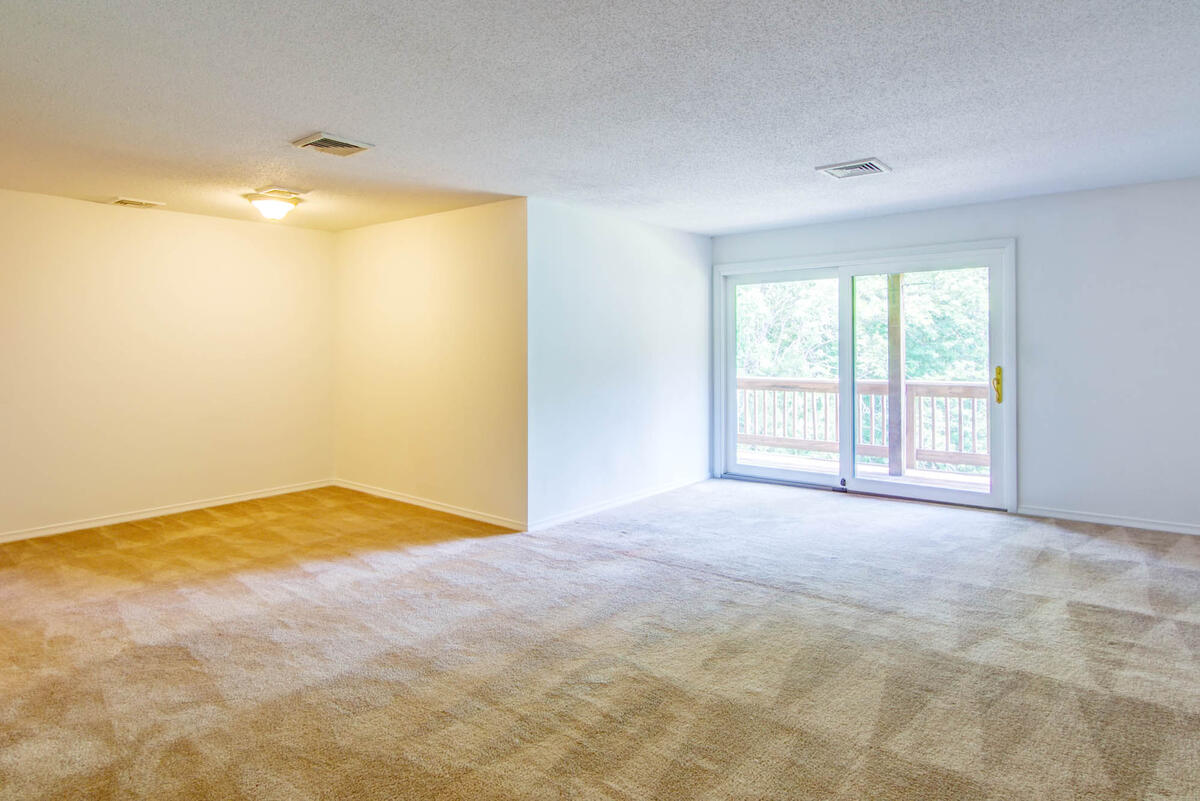
Built in 1973 as a garden-style apartment community, the Property is a Class B, three-story, four-building, 164-unit condominium conversion (out of 188 total units or 87%) comprised of one (39 units), two (108 units), and three-bedroom (17 units) floor plans situated within the North/West Hartford Submarket of the Hartford, CT MSA. The Property is located 9.7 miles west of downtown Hartford, CT. Amenities include a fitness center, pool, picnic area, dog park, tot lot, tennis court, elevators, community laundry, WiFi, low-density wooded landscape, and a clubhouse. The Property is situated on a large wooded parcel of 46 acres resulting in a very low density of four units per acre. The Property is currently 92.9% occupied with in place rents of $1,478 per unit or $1.27 per square foot. The Property is currently managed by Pinnacle Property Management, a third party manager.

In-Place Unit Mix
Unit Type # of Units Unit SF Total SF Rent/Unit Rent/SF
1 Bed / 1 Bath 1 710 710 $1,250 $1.76
1 Bed / 1.5 Bath 38 922 35,036 $1,224 $1.33
2 Bed / 2 Bath 1 877 877 $1,250 $1.43
2 Bed / 2 Bath  78 1,166 90,948 $1,462 $1.25
2 Bed / 2 Bath 29 1,273 36,917 $1,592 $1.25
3 Bed / 2 Bath  14 1,419 19,866 $1,864 $1.31
3 Bed / 2 Bath 3 2,215 6,645 $2,330 $1.05
Total/Average 164 1,165 190,999 $1,478 $1.27
Comparables

LEASE COMPARABLES - POST RENOVATION
  Westgate Addison Mill Hawthorne at Gillette  Mallory Ridge Averages Subject
Submarket Farmington Hartford Bloomfield Bloomfield   Avon/Burlington
Units 174 56 246 78 139 164
Year Built 1962 1890/2009 2004 2014 1993 1973
Average Square Feet 929 850 1,029 1,107 979 1,165
Average Rent $1,655 $1,814 $1,768 $1,779 $1,754 $1,699
Average Rent per Square Foot 1.78 2.13 1.72 1.61 1.81 1.46
Distance from Subject (mi.) 7.1 17.0 7.5 10.2 10.5 N/A
SALE COMPARABLES
  Westgate Summit and Birch Hill 70 Howe St Addison Mill Averages Subject
Date 1/30/2016 8/30/2016 3/31/2017 4/12/2017    
Submarket Farmington Farmington  New Haven Glastonbury   Avon/Burlington
Units 174 186 77 55 123 164
Year Built 1962 1967 1929 1860 1930 1973
Average Square Feet 929 873 626 825 813 1,165
Average Rent $1,655 $1,299 $1,366 $1,646 $1,492 $1,478
Purchase Price $30,500,000 $25,000,000 $12,601,000 $11,750,000 $19,962,750 $24,000,000
$ per Unit $175,287 $134,409 $163,649 $213,636 $171,745 $146,341
$ per Square Foot $189 $154 $261 $212 $204 $126
Cap Rate 5.80% 5.96% 4.23% 5.35% 5.34% 5.48%
Distance from Subject (mi.) 7.1 7.8 43.0 16.5 18.6 N/A

Sale and Lease Comparable information provided by CoStar, Axiometrics, Real Capital Analytics, and the Real Estate Company.

Average Rent for Westgate and Addison Mill only reflects one and two bedroom units.
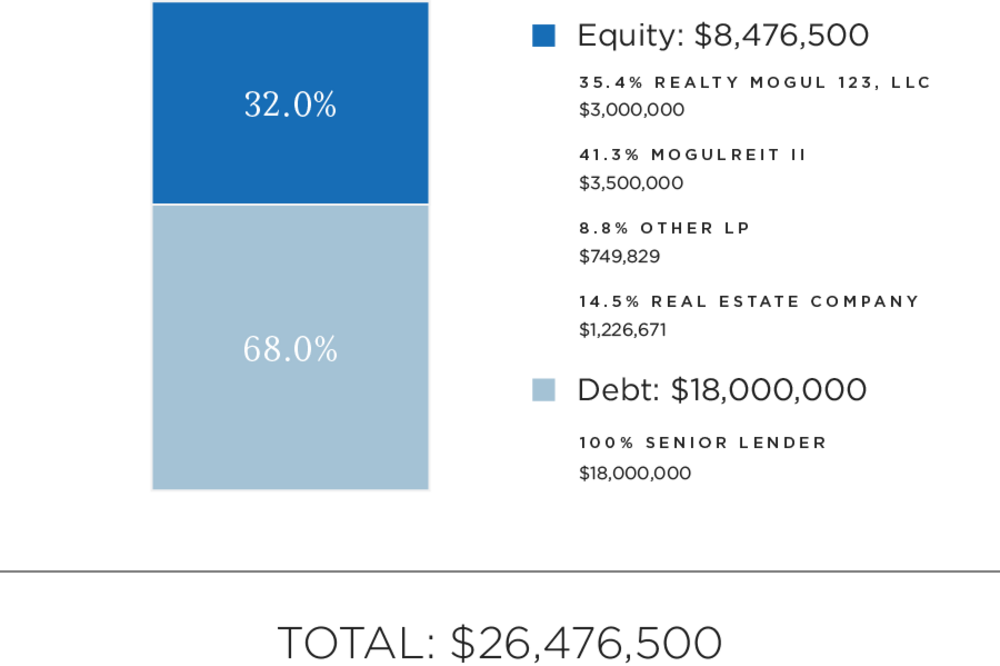
Location Information

The Property is located just off Waterville Road/CT Route 10, near the intersection of Avon Mountain Road/CT Route 44. Both Route 10 and Route 44 provide connections to Interstates 84 and 91, and CT Routes 9 and 5-15. Avon Mountain Road is the main connection for the affluent Farmington Valley to the employment and recreational attractions in West Hartford and downtown Hartford. Ten minutes away is a Whole Foods Market and The Shoppes at Farmington Valley – an open-air lifestyle-shopping destination with more than 45 specialty stores and unique eateries. Also, just 10 minutes from the Property and located at the intersection of Route 44 and North Main Street is Bishop’s Corner, home to numerous restaurants, major national retailers, and grocers. 

Market Overview

Per CoStar, vacancies have risen since The Residences at 299 started delivering units in 3Q14, and are now around 180 basis points above the metrowide level and the submarket’s historical average. Nonetheless, the submarket’s vacancy rate has by no means unraveled. Community resistance to residential development here has long-stymied the addition of new product, which has helped protect fundamentals. Rent growth has decelerated since the submarket posted gains among the highest in the metro in 2Q15, but strong demographics continue to support a hefty premium for 4 & 5 Star product.

The submarket benefits from healthy demographics. Income growth has been strong despite a high starting point, and population growth has been heavily concentrated among Millennials. The job market here is also healthy. Farmington, already home to a spate of global headquarters, added Jackson Laboratory to its employment roster in 2014 and should benefit from the Whitcraft Group’s new contract to supply parts and assemblies to Pratt & Whitney. Both new development and investment activity are largely concentrated in West Hartford, which benefits from an excellent public school system, abundant retail amenities, and could see demand bolstered by the forthcoming addition of the Hartford Line rail service.

Per Axiometrics, effective rent increased 0.1% from $1,505 in 4Q17 to $1,507 in 1Q18. The submarket's annual rent growth rate of 3.6% was above the market average of 1.3%. Out of the six submarkets in the market, the North/West Hartford submarket ranked 4th for quarterly effective rent growth and 2nd for annual effective rent growth for 1Q18. Annual effective rent growth is forecast to be 1.8% in 2018, and average 2.7% through 2018 to 2020. The annual effective rent growth has averaged 2.4% per year since 4Q99. The submarket's occupancy rate increased from 94.2% in 4Q17 to 94.6% in 1Q18, and was up from 93.2% a year ago. The submarket's occupancy rate was below the market average of 95.2% in 1Q18. For the forecast period, the submarket's occupancy rate is expected to increase to 95.3% in 2018 and average 95.8% from 2018 to 2020. The submarket's occupancy rate has averaged 96.4% since 4Q99.

Demographic Information

Demographics
Distance from Property 1 Mile 3 Miles 5 Miles
Population (2018) 2,831 17,144 72,715
Expected Growth (2018-2023) -1.20% -1.04% -0.53%
Median Household Income (2018) $135,393 $130,079 $116,337
Median Home Value (2018) $421,367 $390,878 $365,572

*Demographic information was obtained from CoStar.  

Cap Stack
Sources & Uses
Total Capitalization
Sources of Funds Cost
Debt $18,000,000
Equity $8,476,500
Total Sources of Funds $26,476,500
Uses of Funds Cost
Purchase Price $24,000,000
Acquisition Fee $530,625
North Capital Broker Dealer Fee $146,250
CapEx $1,132,520
Loan Fees $257,105
Working Capital $130,000
Tax & Insurance Reserve $119,000
Closing Costs $161,000
Total Uses of Funds $26,476,500
Debt Assumptions

The expected terms of the debt financing are as follows:

  • Lender: Santander Bank
  • Estimated Proceeds: $18,000,000 
  • Estimated Rate: 5-year Swap + 135 basis points (~4.26% fixed)
  • Amortization: 30 years, with two (2) years of interest-only
  • Term: Five (5) years
  • Potential Earnout: After 24 months, the Real Estate Company may have the ability to obtain up to $3.0 million in additional proceeds provided that they meet debt yield, debt service coverage, and loan to value constraints. A loan earnout of $2.5 million has been assumed in Realty Mogul's underwriting and included in the target IRR and cash-on-cash calculations.

There can be no assurance that a lender will provide debt on the rates and terms noted above, or at all. All rates and terms of the debt financing are subject to lender approval, including but not limited to possible increases in capital reserve requirements for funds to be held in a lender-controlled capital reserve account.


Distributions

The Target will make distributions to investors (The Company and Real Estate Company, collectively, the "Members") as follows:  

Operating Income, Refinance, and Sales Proceeds

  1. To the Members, pari passu until each has received an 8.0% IRR,
  2. 75.0% / 25.0% (75.0% to Members / 25.0% to the Real Estate Company) to a 15.0% IRR,
  3. 60.0% / 40.0% (60.0% to Members / 40.0% to the Real Estate Company) of excess cash flows and appreciation thereafter.

Note that these distributions will occur after the payment of the Company's liabilities (loan payments, operating expenses and other fees as set forth in the LLC agreement, in addition to any member loans or returns due on member loans).

The Company will distribute 100% of its share of excess cash flow (after expenses) to the members of The Company (including the Realty Mogul investors). The manager of The Company will receive a portion of the Real Estate Company's promote interest. Distributions are expected to start in June 2019 and are projected to continue on a quarterly basis thereafter. These distributions are at the discretion of the Real Estate Company, who may decide to delay distributions for any reason, including maintenance or capital reserves. 

Cash Flow Summary
  Year One Year Two Year Three Year Four Year Five
Effective Gross Revenue $3,041,609 $3,292,642 $3,480,365 $3,591,139 $3,680,443
Total Operating Expenses $1,341,766 $1,520,515 $1,605,910 $1,688,747 $1,730,927
Net Operating Income $1,699,843 $1,772,127 $1,874,455 $1,902,392 $1,949,516
RealtyMogul 123, LLC Cash Flows
  Year 0 2018 2019 2020 2021 2022 2023
Distributions to
RealtyMogul 123, LLC Investors
($3,030,000) $87,427 $243,122 $274,033 $1,079,576 $127,627 $3,998,323
Net Earnings to Investor
- Hypothetical $50,000 Investment
($50,000) $1,443 $4,012 $4,522 $17,815 $2,106 $65,979
Fees

Certain fees and compensation will be paid over the life of the transaction. The following fees and compensation will be paid:

One-Time Fees
Type of Fee Amount of Fee Received By Paid From Notes
Acquisition Fee $530,625 Real Estate Company (68%) & RM Adviser, LLC (32%) Capitalized Equity Contribution 2.2% of Purchase Price. RM Adviser, LLC is the Manager of MogulREIT II and a wholly-owned subsidiary of Realty Mogul, Co.
Disposition Fee 1.0% of Gross Sale Proceeds RM Adviser, LLC Distributable Cash RM Adviser, LLC is the Manager of MogulREIT II and a wholly-owned subsidiary of Realty Mogul, Co.
Broker-Dealer Fee $146,250 North Capital (1) Capitalized Equity Contribution  
Recurring Fees
Type of Fee Amount of Fee Received By Paid From Notes
Property Management Fee 3.0% of Effective Gross Income Pinnacle Property Management Distributable Cash  
Asset Management Fee 2.0% of Effective Gross Income Real Estate Company Operating Cash Flow  
Management and Administrative Fee 1.25% of amount invested in RealtyMogul 123, LLC and MogulREIT II RM Manager, LLC and RM Adviser, LLC Distributable Cash RM Manager, LLC is the Manager of RealtyMogul 123, LLC and a wholly-owned subsidiary of Realty Mogul, Co. (2)


(1) Certain employees of Realty Mogul, Co. are registered representatives of, and are paid commissions by, North Capital Private Securities Corp., a Delaware corporation ("North Capital"). In addition, North Capital pays a technology provider services fee to Realty Mogul, Co. for licensing and access to certain technology, reporting, communications, branding, entity formation and administrative services performed from time to time by Realty Mogul, Co., and North Capital and Realty Mogul, Co. are parties to a profit sharing arrangement.

(2) Fees may be deferred to reduce impact to investor distributions.

The above presentation is based upon information supplied by the Real Estate Company or others.  Realty Mogul, Co., RM Manager, LLC, and The Company, along with their respective affiliates, officers, directors or representatives (the "RM Parties") hereby advise you that none of them has independently confirmed or verified any of the information contained herein.  The RM Parties further make no representations as to the accuracy or completeness of any such information and undertake no obligation now or in the future to update or correct this presentation or any information contained herein.

The following offering documents have been prepared and are being delivered by the Sponsor of this investment opportunity, and not by RM Securities, LLC. RM Securities, LLC and its associated persons did not assist in preparing, do not explicitly or implicitly adopt or endorse, and are not otherwise responsible for, the Sponsors offering documents posted below or any content therein.
RM Securities, LLC and its Affiliates Compensation

RM Securities, LLC, its registered representatives, affiliates, associated persons, and personnel of its affiliates who may also be associated with it, including our associated persons and personnel of our affiliates who are also be associated with RM Securities, LLC (it (“RM Securities,” “we,” “our,” or “us”) will receive fees, expense reimbursements, and other compensation (“Fees”) from the issuer of this investment offering, its sponsor, or an affiliate thereof (“Sponsor”), or otherwise in connection with Sponsor’s offering. The Fees paid to us are in addition to other fees you will pay to Sponsor or in connection with Sponsor’s investment offering. You will pay Fees to Sponsor, either directly or indirectly as an investor in the Sponsor’s offering. Sponsor will use the Fees you pay, as well as funds you invest in the relevant offering, to compensate us. The Fees paid to us will directly or indirectly be borne by you as the investor (typically, but not always, in the form of an expense of the Sponsor’s offering in which you invest) because such Fees will reduce the proceeds available for distribution to you and reduce the amount you earn over time.

For more information on the Fees paid to us, or any other Fees you will pay in connection with Sponsor’s offering, please carefully review the Sponsor’s Investment Documents. Please also carefully review RM Securities’ Form CRS, Regulation Best Interest Disclosures, and Limited Brokerage Services Agreement.

No Approval, Opinion or Representation, or Warranty by RM Securities, LLC

Sponsor has provided, approved, and is solely responsible in all aspects for the information on this webpage (“Page”), including Sponsor’s offering documentation, which may include without limitation the Private Placement Memorandum, Operating or Limited Partnership Agreement, Subscription Agreement, the Project Summary and all exhibits and other documents attached thereto or referenced therein (collectively, the “Investment Documents”). The Investment Documents linked on this page have been prepared and posted by Sponsor, and not by RM Securities. We did not assist in preparing, do not adopt or endorse, and we are not otherwise responsible for, the Sponsor’s Investment Documents. We make no representations or warranties as to the accuracy of information on this Page or in the Sponsor’s Investment Documents and we accept no liability therefor. No part of the information on this Page or in the Sponsor’s Investment Documents is intended to be binding on us.

Sponsor’s Information Qualified by Investment Documents

The information on this Page is qualified in its entirety by reference to the more complete information about the offering contained in the Sponsor’s Investment Documents. The information on this Page is not complete and subject to change at the Sponsor’s discretion at any time up to the closing date. The Sponsor’s Investment Documents and supplements thereto contain important information about the Sponsor’s offering including relevant investment objectives, the business plan, risks, charges, expenses, and other information, which you should consider carefully before investing. The information on this Page should not be used as a basis for an investor’s decision to invest.

Risk of Investment

This investment is speculative, highly illiquid, and involves substantial risk. There can be no assurances that all or any of Sponsor’s assumptions, expectations, estimates, goals, hypothetical illustrations, or other aspects of Sponsor’s business plans (“Assumptions”) will be true or that actual performance will bear any relation to Sponsor’s Assumptions, and no guarantee or representation is made that Sponsor’s Assumptions will be achieved. If Sponsor does not achieve its Assumptions, your investment could be materially and adversely affected. A loss of part or all of the principal value of your investment may occur. You should not invest unless you can readily bear the consequences of such loss. Sponsor’s Assumptions should not be relied upon as the primary basis for your decision to invest.

No Reliance on Forward-Looking Statements; Sponsor Assumptions

Sponsor is solely responsible for statements made concerning forward-looking statements and Assumptions, which apply only as of the date made, are preliminary and subject to change, and are expressly qualified in their entirety by the disclosures and cautionary statements included in Sponsor’s Investment Documents, which you should carefully review. Neither RM Securities nor Sponsor are obligated to update or revise such forward-looking statements or Assumptions to reflect events or circumstances that arise after the date made or to reflect the occurrence of unanticipated events. Sponsor’s forward-looking statements and Assumptions are hypothetical, not based on actual investment achievements or events, and are presented solely for purposes of providing insight into the Sponsor’s investment objectives, detailing Sponsor’s anticipated risk and reward characteristics, and establishing a benchmark for future evaluation of actual results; therefore, they are not a predictor, projection, or guarantee of future results. You should not rely on Sponsor’s forward-looking statements as a basis to invest.

Importantly, we do not adopt, endorse, or provide any assurance of returns or as to the accuracy or reasonableness of Sponsor’s Assumptions or forward-looking statements.

No Reliance on Past Performance

Any description of past performance is not a reliable indicator of future performance and should not be relied upon as the primary basis to invest.

Sponsor’s Use of Debt

A substantial portion of the total cost of the real estate asset acquired by the Sponsor with investor funds (“Property”) will be paid with borrowed funds, i.e., debt. Sponsor’s estimated rates and terms of the debt financing are subject to lender approval, and there is no assurance that the Sponsor will secure debt at the rates and terms presented on this Page or in the Sponsor’s Investment Documents, or at all. The use of borrowed money to acquire real estate is referred to as leveraging, which can amplify losses and could result in lender foreclosure. In addition, if the debt includes a variable (or “floating”) interest rate, the total amount of interest paid over the term of the debt will fluctuate and can increase. As a result, Sponsor’s use of debt can result in a loss of some or all of your investment.

Sponsor’s Offering is Not Registered

Sponsor’s securities offering will not be registered under the Securities Act of 1933, as amended (the “Securities Act”), in reliance upon the exemptions from registration pursuant to Rule 506(c) of Regulation D as promulgated under the Securities Act (“Private Placement”). In addition, the offering will not be registered under any state securities laws in reliance on exemptions from state registration. Such securities (your ownership interests) are subject to restrictions on transferability and resale and may not be transferred or resold except as permitted under applicable state and federal securities laws pursuant to registration or an available exemption. All Private Placements on the Platform are intended solely for “Accredited Investors,” as that term is defined in Rule 501(a) under the Securities Act.

No Investment Advice

Nothing on this Page should be regarded as investment advice (either with respect to a particular security or regarding an overall investment strategy), a recommendation, an offer to sell, or a solicitation of or an offer to buy any security. Advice from a securities professional is strongly advised to understand and assess the risks associated with real estate or private placement investments. For additional information on RM Securities’ involvement in this offering, please carefully review the Sponsor’s Investment Documents, and RM Securities’ Form CRS, Regulation Best Interest Disclosures, and Limited Brokerage Services Agreement.

1031 Exchange Risk

Internal Revenue Code Section 1031 (“Section 1031”) contains complex tax concepts and certain tax consequences may vary depending on the individual circumstances of each investor. RM Securities and its affiliates make no representation or warranty of any kind with respect to the tax consequences of your investment or that the IRS will not challenge any such treatment. You should consult with and rely on your own tax advisor about the tax aspects with respect to your particular circumstances.

INVEST TODAY

...

Questions?

(877) 781-7062

Contact Investor Relations
Staff Menu (IO ID#: 633344):
EDIT IO DOCUMENTS
Staff Menu (IO ID#: 633344):
EDIT IO DOCUMENTS
JOIN REALTYMOGUL
Create an account or sign in.
Are you an Accredited Investor?
Must be 8 characters or more with an uppercase and lowercase character, a number, and a symbol.
By clicking "JOIN REALTYMOGUL" you are agreeing to our Terms of Service and Privacy Policy, and that you've had an opportunity to review RM Securities, LLC's Form Customer Relationship Summary.
SIGN IN
Don’t have an account yet? Join RealtyMogul.
Forgot Password?
Questions? Our Investor Relations team is available to help 8 AM - 6 PM PST Monday to Friday. Contact us at (877) 977-2776.
Forgot Password
Enter your email address to receive a code to reset your password.
Enter the code sent to your email address below and your new password.

Resend Code

WELCOME
Welcome,

Welcome to RealtyMogul! We need to ask a few additional questions to get to know you.

Your Net Worth
Are you interested in 1031 exchanges?
Thank you!

We’ve received your information and updated your Investor Profile.

Welcome to RealtyMogul

As part of RealtyMogul's commitment to transparency, we want to inform you that you have been directed to our website from an unaffiliated third-party marketing company who is compensated up to $250 for each investor who registers on our site. RealtyMogul and its affiliates have no relationship with the marketing company other than this compensation arrangement. RealtyMogul and its affiliates are not responsible for the preparation or accuracy of, and do not explicitly or implicitly adopt or endorse, any content provided by the unaffiliated marketing company.