


The Sponsor is a joint venture between Cantor Fitzgerald, an institutional real estate company, and STAR, a vertically integrated real estate company with a portfolio of 40 multifamily apartment communities, 10,966 units, and a market value of approximatley $1.25 billiion.
Cantor Fitzgerald
Cantor Sponsor is an indirect subsidiary of Cantor Fitzgerald. Cantor Fitzgerald is a diversified organization specializing in financial services and real estate services and finance for institutional customers operating in the global financial and commercial real estate markets. As of December 31, 2017, Cantor Fitzgerald had over 11,000 employees operating in most major financial centers throughout the world. As of the date of this Memorandum, Cantor Fitzgerald maintained credit ratings of ‘BBB-’ from Standard & Poor’s and ‘BBB-’ from Fitch.
Cantor Fitzgerald operate through four business lines: Capital Markets and Investment Banking; Inter-Dealer Brokerage; Real Estate Brokerage and Finance; and Private Equity. The Real Estate Brokerage and Finance business principally consists of commercial real estate services, conducted by Newmark Grubb Knight Frank (“NGKF”) and commerical real estate finance activity, conducted by Berkely Point and Cantor Commercial Real Estate (“CCRE”).
Cantor Fitzgerald is a preeminent capital markets investment bank, recognized for its strengths in the equity and fixed income capital markets, its global distribution model, and for its expanding presence as the leading independent middle market investment bank serving the marketplace with investment banking services, prime brokerage, and commercial real estate financing. Affiliates of Cantor Fitzgerald have been involved with nine (9) real estate programs with similar investment objectives since November 2014. These prior real estate programs involved the purchase of 99 properties for an aggregate purchase price of approximately $511 million. As of February 1, 2018, these prior programs have raised more than $215 million from over 750 investors.*
STAR
STAR is a multifamily real estate company focused on the Southwest and Midwest United States. STAR is vertically integrated with in-house acquisitions, accounting, asset management, and property management teams. STAR’s business and operations model allows for direct control of the entire real estate investment process. Since the 1970’s, STAR’s principals have been involved in the acquisition, management, financing and disposition of over $10 billion worth of multifamily real estate both domestically and abroad.
Since 2005, STAR and its predecessor organization have acquired and managed a leading portfolio of multifamily real estate communities. As of June 30, 2017, STAR’s Portfolio represents 40 multifamily apartment communities in 9 different states, 10,555 apartment units, approximately 10.4 million square feet of residential real estate, and a market value of $1.25 billion.*
*Per the Sponsors
The Promenade
Promenade is a Class B multifamily apartment complex located in the Orlando-Kissimmee-Sanford, FL Metro Area where the median price for existing single family homes was $250,000 in 4Q17, according to the National Association of Realtors, 9.8% more than the previous year. The Property is comprised of a one-story leasing office/clubhouse, 25 two-story residential buildings, and ancillary buildings. The residential buildings contain 200 rentable units, each unit averaging approximately 843 square feet. Amenities include a swimming pool/spa, tennis courts, racquetball, basketball and sand volleyball courts, a fitness center, business center, and picnic area.
| Unit Type | # of Units | Avg SF/Unit | Avg Rent/Unit | Avg Rent/SF |
|---|---|---|---|---|
| 1 BR / 1 BA | 24 | 600 | $1,156 | $1.93 |
| 1 BR / 1 BA | 24 | 701 | $1,180 | $1.68 |
| 2 BR / 2 BA | 64 | 800 | $1,250 | $1.56 |
| 2 BR / 2 BA | 64 | 916 | $1,130 | $1.45 |
| 3 BR / 2 BA | 24 | 1,150 | $1,550 | $1.35 |
| Total | 200 | 843 | $1,292 | $1.53 |
Stockwell Landing
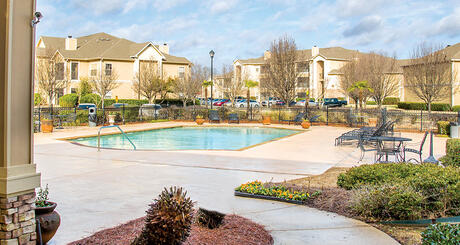
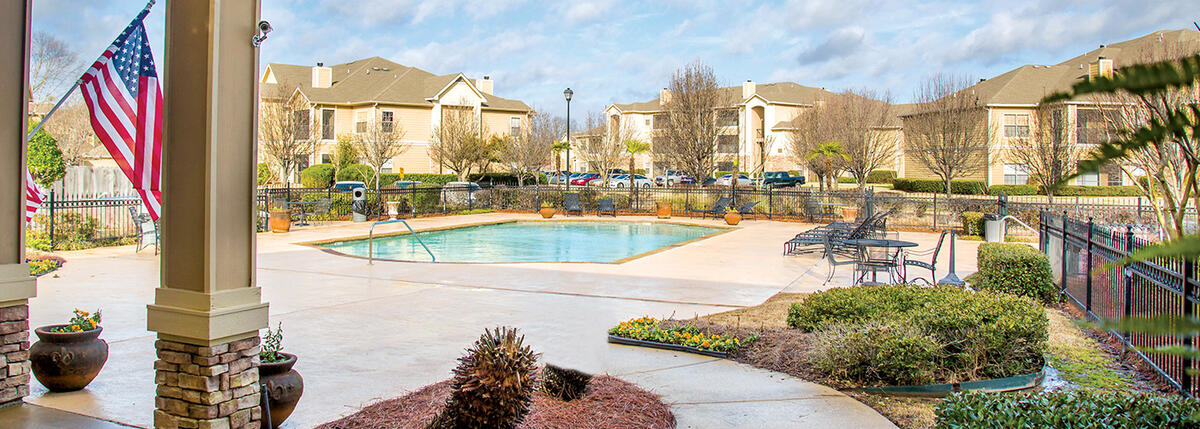
Stockwell Landing is a Class A multifamily residential complex located in Bossier City, LA. The Property is comprised of a one-story leasing office, ten two-story residential buildings, and four three-story residential buildings. The residential buildings contain 241 rentable units, each unit averaging approximately 1,080 square feet. Amenities include a swimming pool, playground, fitness facility, business center, and clubhouse.
| Unit Type | # of Units | Avg SF/Unit | Avg Rent/Unit | Avg Rent/SF |
|---|---|---|---|---|
| 1 BR / 1 BA | 48 | 845 | $869 | $1.03 |
| 2 BR / 2 BA | 145 | 1,083 | $911 | $0.84 |
| 3 BR / 2 BA | 47 | 1,299 | $1,094 | $0.84 |
| 3 BR / 2 BA | 1 | 1,401 | $2,038 | $1.45 |
| Total | 241 | 1,079 | $943 | $0.87 |
Property information above was obtained from the PPM
The Promenade
| Advenir at the Oaks | Landmark at West Place | Hawthorne Groves | Park at Milano | Averages | Subject | |
|---|---|---|---|---|---|---|
| # of Units | 408 | 342 | 328 | 194 | 318 | 200 |
| Year Built | 1989 | 2002 | 2001 | 1989 | 1995 | 1990 |
| Occupancy | 96% | 93% | 99% | 96% | 96% | 99% |
| Average Rental Rate (Per Unit) | $1,166 | $1,289 | $1,160 | $1,130 | 1186 | $1,144 |
| Distance from Subject | 4 miles | 6 miles | 5 miles | 6 miles | 5.25 miles | - |
Source: CBRE Appraisal dated December, 2017
| Central Park | Terraces at Lake Mary | Lake Tivoli | Highpoint Club | Averages | Subject | |
|---|---|---|---|---|---|---|
| Date | Nov-17 | Aug-17 | Aug-17 | May-17 | - | Mar-18 |
| # of Units | 362 | 284 | 384 | 348 | 345 | 200 |
| Year Built | 1991 | 1997 | 1990 | 1994 | 1993 | 1990 |
| Occupancy | 96% | 96% | 96% | 92% | 95% | 95% |
| Purchase Price | $52,750,000 | $44,100,000 | $49,500,000 | $48,500,000 | $48,712,500 | $28,700,000 |
| $/Unit | $145,718 | $155,282 | $128,906 | $139,368 | $142,319 | $143,500 |
| Cap Rate | 5.01% | 5.26% | 5.78% | 5.72% | 5.44% | 5.75% |
Source: CBRE Appraisal dated December, 2017
Stockwell Landing
| Coats Bluff at Wright Island | Cypress Pointe | Landing at Willow Bayou | Villaggio | Averages | Subject | |
|---|---|---|---|---|---|---|
| # of Units | 252 | 240 | 224 | 239 | 238 | 241 |
| Year Built | 2014 | 1997 | 2010 | 2016 | 2009 | 2005 |
| Occupancy | 94% | 95% | 93% | 96% | 94% | 93% |
| Average Rental Rate (Per Unit) | $1,217 | $911 | $1,036 | $1,026 | $1,047 | $943 |
| Distance from Subject | 6.0 miles | 5.0 miles | 5.0 miles | 2.0 miles | 4.5 miles | - |
Source: Axiometrics and the CBRE Appraisal dated February 15, 2018
| Village at Juban Lakes | West M | Chateau Mirage | The Gates at Citiplace | Averages | Subject | |
|---|---|---|---|---|---|---|
| Date | Aug-16 | Sep-16 | Mar-16 | Jul-17 | - | Mar-18 |
| # of Units | 144 | 366 | 280 | 369 | 290 | 241 |
| Year Built | 2010 | 2012 | 2011 | 1996 | 2007 | 2005 |
| Occupancy | 95% | 93% | 97% | 96% | 95% | 93% |
| Purchase Price | $16,680,000 | $59,109,000 | $40,960,000 | $59,645,000 | $35,098,500 | $29,190,000 |
| $/Unit | $115,833 | $161,500 | $146,286 | $161,640 | $146,315 | $121,120 |
| Cap Rate | 6.75% | 6.0% | 6.26% | 5.79% | 6.2% | 5.7% |
Source: CBRE Appraisal dated January, 2018
Properties Appraisal available upon request. Please email investor-help@realtymogul.com.

| Sources of Funds | Cost |
|---|---|
| Debt | $27,790,673 |
| Equity | $24,525,000 |
| Total Sources of Funds | $52,315,673 |
| Uses of Funds | Cost |
| Contribution of Real Estate (1) | $46,317,789 |
| Closing Costs (1) | $141,213 |
| Lender and Loan Expenses (1) | $462,303 |
| Reserves (1) | $1,749,139 |
| One Year Asset Management Fee | $60,000 |
| Structuring Fee | $1,157,945 |
| Selling Commissions (2) | $1,471,500 |
| Marketing and Due Diligence (3) | $245,250 |
| Placement Fee (4) | $367,875 |
| Organizational & Offering Costs | $267,658 |
| Due Diligence Expenses | $75,000 |
| Total Uses of Funds | $52,315,673 |
(1) Does not reflect the approximately 19.99% attributable to the retained interest.
(2) Selling Commissions in an amount up to 6.0% of the Total Sales will be paid to the Managing Broker-Dealer, which the Managing Broker-Dealer will re-allow to the Selling Group Members.
(3) The Managing Broker-Dealer will receive a non-accountable marketing and due diligence allowance of up to 1.0% of Total Sales, which may be re-allowed, in whole or in part, to the Selling Group Members.
(4) The Managing Broker-Dealer will receive a managing broker-dealer fee of up to 1.5% of the Total Sales.
The Promenade:
- Lender: Freddie Mac via Berkeley Point Capitol
- Loan Proceeds: $17,220,000
- Loan to Cost: 60%
- Interest Rate: 4.73% Fixed
- Interest Only: 5 Years
- Amortization: 30 Years
- Recourse: Non-recourse to investors, but recourse to the Trust and principals of the Sponsor for certain (i) "bad acts", (ii) environmental indemnification, and (iii) springing recourse events
- Term: 10 years
- Defeasance: The Loan may be defeased at any time after the Permitted Release Date and prior to January 6, 2028
Stockwell Landing:
- Lender: Freddie Mac via Berkeley Point Capitol
- Loan Proceeds: $17,514,000
- Loan to Cost: 60%
- Interest Rate: 4.73% Fixed
- Interest Only: 5 Years
- Amortization: 30 Years
- Recourse: Non-recourse to investors, but recourse to the Trust and principals of the Sponsor for certain (i) "bad acts", (ii) environmental indemnification, and (iii) springing recourse events
- Term: 10 years
- Defeasance: The Loan may be defeased at any time after the Permitted Release Date and prior to January 6, 2028
The Sponsor is to make distributions directly to investors who own a beneficial interest in the DST on a pro-rata basis.
Distributions are expected to start for each investor within 45 days of the completion of that investors purchase of beneficial interest in the DST. Distributions are targeted to continue on a monthly basis thereafter. These distributions are at the discretion of the Sponsor and made directly by the Sponsor, neither Realty Mogul Co. nor any of its affiliates have any control or discretion on the timing or amount of distributions.
Certain fees and compensation will be paid over the life of the transaction. The following fees and compensation will be paid:
| Type of Fee | Amount of Fee | Received By | Paid From | Notes |
|---|---|---|---|---|
| Selling Commission | 6.00% of offering proceeds | Broker Dealers | Capitalized Equity Contribution | Paid to North Capital (1) or other licensed broker-dealers that are Selling Group Members based on the amount of equity capital raised. An Affiliate of the Real Estate Company is also a broker-dealer who is eligible to get paid this fee. |
| Marketing and Due Diligence Fee | 1.00% of offering proceeds | Broker Dealers | Capitalized Equity Contribution | 1.00% based on the amount of equity invested by investors through RealtyMogul.com, third-party Broker Dealers (including North Capital(1)) are entitled to additional fees based on equity they originate. Surplus fees retained by the Real Estate Company. |
| Placement Fee | 1.50% of offering proceeds | Broker Dealers | Capitalized Equity Contribution | Managing Broker-Dealer will receive a fee up to 1.50% of the Total Sales, which it may at its sole discretion partially re-allow to Selling Group Members for non-accountable marketing expenses in addition to any other allowances. |
| Organization and Offering Expenses | $267,658 | Sponsor | Capitalized Equity Contribution | The Sponsor and its affiliates will be entitled to reimbursement for Organization and Offering Expenses estimated at $267,658. |
| Structuring Fee | $1,157,945 | Sponsor | Capitalized Equity Contribution | The Sponsor will receive a structuring fee for the services they rendered in connection with the structuring of the Offering. |
| Disposition Fee | 2.50% | Sponsor | Sale Proceeds | 2.50% of Sales Price |
| Type of Fee | Amount of Fee | Received By | Paid From | Notes |
|---|---|---|---|---|
| Asset Management Fee | $60,000 annually | Sponsor | Net Cash Flow | $36,000 paid annually to Star Asset Management and $24,000 paid annually to Cantor Asset Manager. |
| Property Management Fee | 3.0% of Effective Gross Income | Property Manager | Operating Cash Flow | Property Manager is an affiliate of the Sponsor. |
| Property Revenues in Excess of Rent | N/A | Master Lessee | Operating Cash Flow | The Master Tenant will retain revenues from the Property that exceed the total rent payable to the Trust under the Master Lease. |
Notes:
(1) Certain employees of Realty Mogul, Co. are registered representatives of, and are paid commissions by, North Capital Private Securities Corp., a Delaware corporation ("North Capital"). In addition, North Capital pays a technology provider services fee to Realty Mogul, Co. for licensing and access to certain technology, reporting, communications, branding, entity formation and administrative services performed from time to time by Realty Mogul, Co., and North Capital and Realty Mogul, Co. are parties to a profit sharing arrangement.
The above presentation is based upon information supplied by the Sponsor or others. Realty Mogul, Co. along with its respective affiliates, officers, directors or representatives (the "RM Parties") hereby advise you that none of them has independently confirmed or verified any of the information contained herein. The RM Parties further make no representations as to the accuracy or completeness of any such information and undertake no obligation now or in the future to update or correct this presentation or any information contained herein.
This content does not constitute an offer to sell or a solicitation of an offer to buy any securities. RealtyMogul.com and North Capital Private Securities are in the process of screening, performing due diligence, and verifying information for the offering. The content is presented to gauge interest only and is subject to change without notice.
The information on this Page is qualified in its entirety by reference to the more complete information about the offering contained in the Sponsor’s Investment Documents. The information on this Page is not complete and subject to change at the Sponsor’s discretion at any time up to the closing date. The Sponsor’s Investment Documents and supplements thereto contain important information about the Sponsor’s offering including relevant investment objectives, the business plan, risks, charges, expenses, and other information, which you should consider carefully before investing. The information on this Page should not be used as a basis for an investor’s decision to invest.
Risk of InvestmentThis investment is speculative, highly illiquid, and involves substantial risk. There can be no assurances that all or any of Sponsor’s assumptions, expectations, estimates, goals, hypothetical illustrations, or other aspects of Sponsor’s business plans (“Assumptions”) will be true or that actual performance will bear any relation to Sponsor’s Assumptions, and no guarantee or representation is made that Sponsor’s Assumptions will be achieved. If Sponsor does not achieve its Assumptions, your investment could be materially and adversely affected. A loss of part or all of the principal value of your investment may occur. You should not invest unless you can readily bear the consequences of such loss. Sponsor’s Assumptions should not be relied upon as the primary basis for your decision to invest.
No Reliance on Forward-Looking Statements; Sponsor AssumptionsSponsor is solely responsible for statements made concerning forward-looking statements and Assumptions, which apply only as of the date made, are preliminary and subject to change, and are expressly qualified in their entirety by the disclosures and cautionary statements included in Sponsor’s Investment Documents, which you should carefully review. Sponsor is obligated to update or revise such forward-looking statements or Assumptions to reflect events or circumstances that arise after the date made or to reflect the occurrence of unanticipated events. Sponsor’s forward-looking statements and Assumptions are hypothetical, not based on actual investment achievements or events, and are presented solely for purposes of providing insight into the Sponsor’s investment objectives, detailing Sponsor’s anticipated risk and reward characteristics, and establishing a benchmark for future evaluation of actual results; therefore, they are not a predictor, projection, or guarantee of future results. You should not rely on Sponsor’s forward-looking statements as a basis to invest.
Importantly, we do not adopt, endorse, or provide any assurance of returns or as to the accuracy or reasonableness of Sponsor’s Assumptions or forward-looking statements.
No Reliance on Past PerformanceAny description of past performance is not a reliable indicator of future performance and should not be relied upon as the primary basis to invest.
Sponsor’s Use of DebtA substantial portion of the total cost of the real estate asset acquired by the Sponsor with investor funds (“Property”) will be paid with borrowed funds, i.e., debt. Sponsor’s estimated rates and terms of the debt financing are subject to lender approval, and there is no assurance that the Sponsor will secure debt at the rates and terms presented on this Page or in the Sponsor’s Investment Documents, or at all. The use of borrowed money to acquire real estate is referred to as leveraging, which can amplify losses and could result in lender foreclosure. In addition, if the debt includes a variable (or “floating”) interest rate, the total amount of interest paid over the term of the debt will fluctuate and can increase. As a result, Sponsor’s use of debt can result in a loss of some or all of your investment.
Sponsor’s Offering is Not RegisteredSponsor’s securities offering will not be registered under the Securities Act of 1933, as amended (the “Securities Act”), in reliance upon the exemptions from registration pursuant to Rule 506(c) of Regulation D as promulgated under the Securities Act (“Private Placement”). In addition, the offering will not be registered under any state securities laws in reliance on exemptions from state registration. Such securities (your ownership interests) are subject to restrictions on transferability and resale and may not be transferred or resold except as permitted under applicable state and federal securities laws pursuant to registration or an available exemption. All Private Placements on the Platform are intended solely for “Accredited Investors,” as that term is defined in Rule 501(a) under the Securities Act.
No Investment AdviceNothing on this Page should be regarded as investment advice (either with respect to a particular security or regarding an overall investment strategy), a recommendation, an offer to sell, or a solicitation of or an offer to buy any security. Advice from a securities professional is strongly advised to understand and assess the risks associated with real estate or private placement investments.
1031 Exchange RiskInternal Revenue Code Section 1031 (“Section 1031”) contains complex tax concepts and certain tax consequences may vary depending on the individual circumstances of each investor. You should consult with and rely on your own tax advisor about the tax aspects with respect to your particular circumstances.