


The Sponsorship is a partnership between Georgetown Partners ("Georgetown") and Red Starr Investments ("Red Starr").
Georgetown Partners (www.gtownpartners.com) is a private real estate investment company focused on real estate in the Washington, DC Metro area. Founded in 2016, they target both stabilized and value-add opportunities. The principals of Georgetown Partners have over 20 years of commercial real estate experience, working with institutional clients to deliver results. They are a fully integrated company that handles all asset, leasing, and property management in-house or with strategic partners that are aligned with the investment.
Red Starr Investments, LLC (www.red-starr.com) is an opportunistic real estate investor with expertise as both a capital provider and an operator of varied property types. Red Starr has extensive investment experience throughout the capital stack – including high-yield senior loans, preferred equity, mezzanine loans and common equity. Red Starr’s primary investment mandate is to preserve investor capital while striving to achieve strong returns. The Red Starr team is comprised of professionals in New York and New Jersey with expertise in acquisitions, asset management, construction, sales, financing and property management expertise.
The Red Starr partners have actively developed, owned, managed, and sold more than 5 million square feet of commercial real estate and over 1,000 residential units. Red Starr’s existing real estate portfolio includes office, retail, industrial, and both for-sale and rental residential properties throughout the United States. Since December 2017 Red Starr has been actively acquiring Virginia real estate including an 800+ bed student housing property and a 400 unit townhouse rental community.
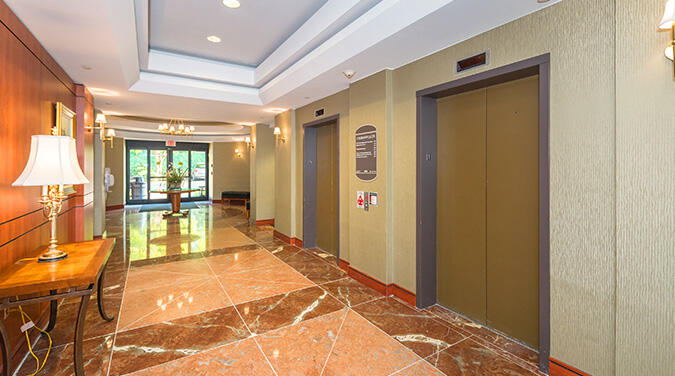
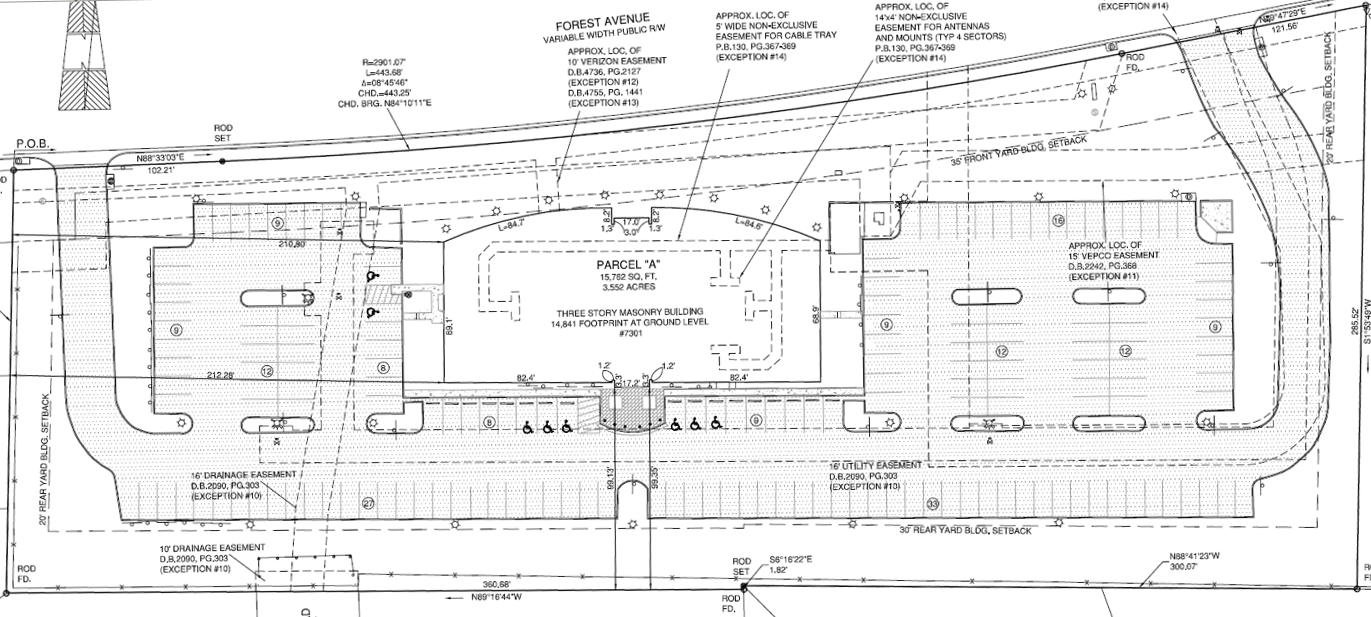
Built in 1987, the Property is a Class A, 40,303 square foot medical office building located in the West End Medical District of Richmond, VA. The Property contains eight suites spread across three stories. The lobby features marble floors with carpet in the corridors and two common area restrooms per floor. The Property has 174 parking spaces, or 4.3 spaces per 1,000 rentable square feet.
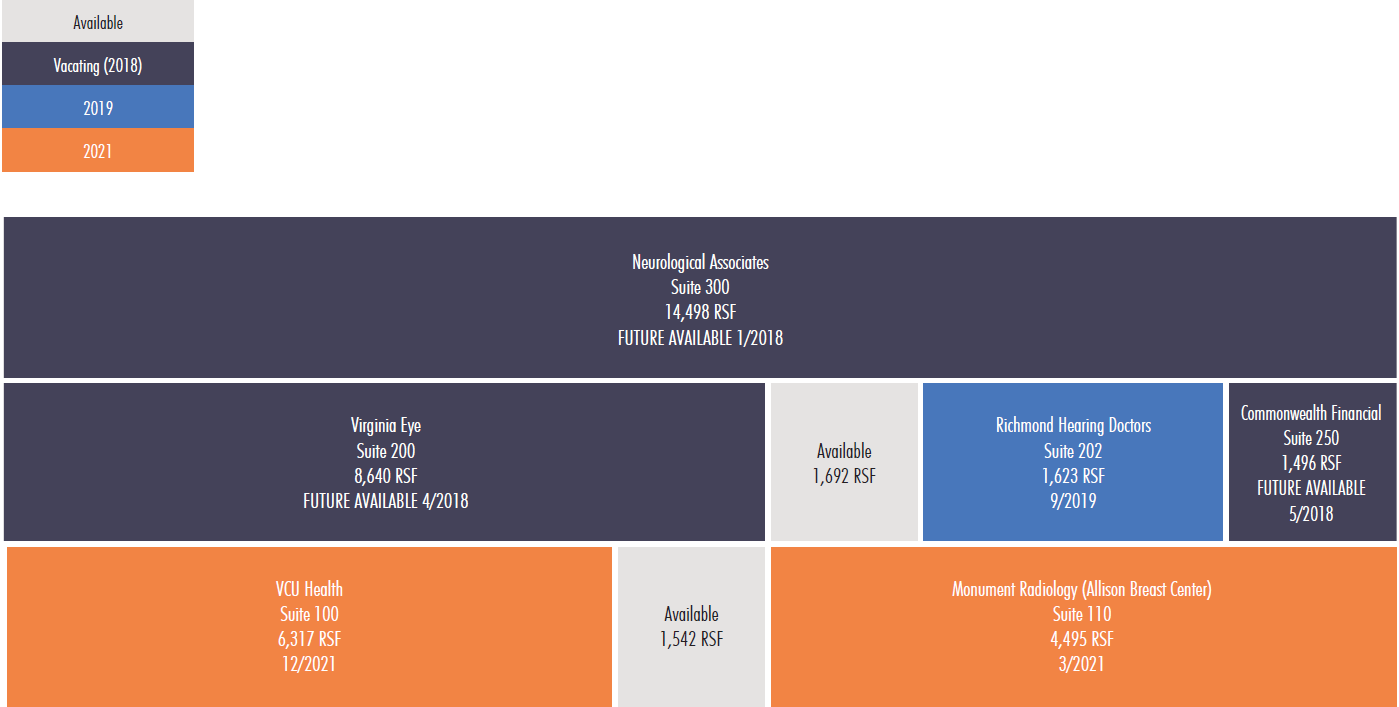
Rent Roll
| Suite | Tenant | Square Feet | Lease End Date | Rent Per Square Foot |
|---|---|---|---|---|
| 100 | MCV Physicians (VCU Health) | 6,380 | $21.31 | |
| 102 | Vacant | 1,542 | - | - |
| 110 | Monument Radiology | 4,495 | 3/31/2021 | $20.69 |
| 200 | Virginia Eye Institute* | 8,640 | 4/30/2018 | $22.48 |
| 201 | Vacant | 1,692 | - | - |
| 202 | Richmond Hearing | 1,623 | 9/30/2019 | $25.50 |
| 250 | Commonwealth Financial Services | 1,496 | 5/31/2018 | $22.81 |
| 300 | Neurological Associates* | 14,498 | 1/1/2018 | $21.86 |
| Total | 40,303 | $20.10 |
*Assumed to vacate
Lease Comparables
| Reynolds MOB II | Reynolds MOB II | Bon Secours Heart Institute | Billy Renolds Jr. Building | Billy Renolds Jr. Building | Reynolds Commons | Total / Averages | Subject | |
|---|---|---|---|---|---|---|---|---|
| Deal Type | New | New | Renewal | Renewal | New | Renewal | - | |
| Year Built | 2018 | 2018 | 2008 | 1987 | 1987 | 2015 | 2006 | 1987 |
| SF Leased | 23,443 | 13,372 | 55,237 | 31,994 | 8,036 | 18,434 | 25,086 | - |
| Tenant | Virginia Eye Institute | Dermatology Associates of Virginia | Bon Secours | Bon Secours | VCU Health | The Sheltering Arms Hospital | - | - |
| Lease Type | NNN | NNN | NNN | NNN | NNN | NNN | NNN | NNN |
| Term | 144 Months | 144 Months | 90 Months | 120 Months | 60 Months | 120 Months | 113 | 84 - 120 |
| Rent per SF | $24.00 | $24.00 | $22.54 | $15.75 | $15.00 | $20.00 | $20.22 | $17.00 - 18.00 |
| Rent Bumps | 2.50% | 2.50% | 2.75% | 2.50% | 2.50% | 2.75% | 2.58% | 2.50% |
| TIs Offered | $50.00 | $50.00 | $10.00 | $0.00 | $0.00 | $47.50 | $26.25 | $50.00 |
| Distance from Subject (mi.) | 0.8 | 0.8 | 0.5 | 0.9 | 0.9 | 1.0 | 0.8 | - |
Sales Comparables
| Advanced Othopaedics | Virginia Women's Center | St. Francis Cancer Center | Bon Secours Heart Institute | Total / Averages | Subject | |
|---|---|---|---|---|---|---|
| Date | April-15 | September-14 | May-13 | December-12 | - | |
| Building Class | B | A | B | A | A | |
| Occupancy | 100% | 100% | 97% | 100% | 99% | 31% |
| Building SF | 62,165 | 20,066 | 52,559 | 99,654 | 58,611 | 40,303 |
| Year Built | 2002 | 2014 | 2006 | 2008 | 2008 | 1987 |
| Purchase Price | $20,700,000 | $6,762,985 | $18,250,000 | $29,147,000 | $22,548,406 | $4,650,000 |
| Per SF | $333 | $337 | $347 | $292 | $319 | $115 |
| Cap Rate | 6.80% | - | 6.75% | 6.75% | 6.77% | 2.4%* |
| Distance from Subject (mi.) | 2.2 | 13.2 | 19.7 | 0.8 | 9.0 | - |
* Based on Year 1 projected income. T12 cap rate is 11.9%.
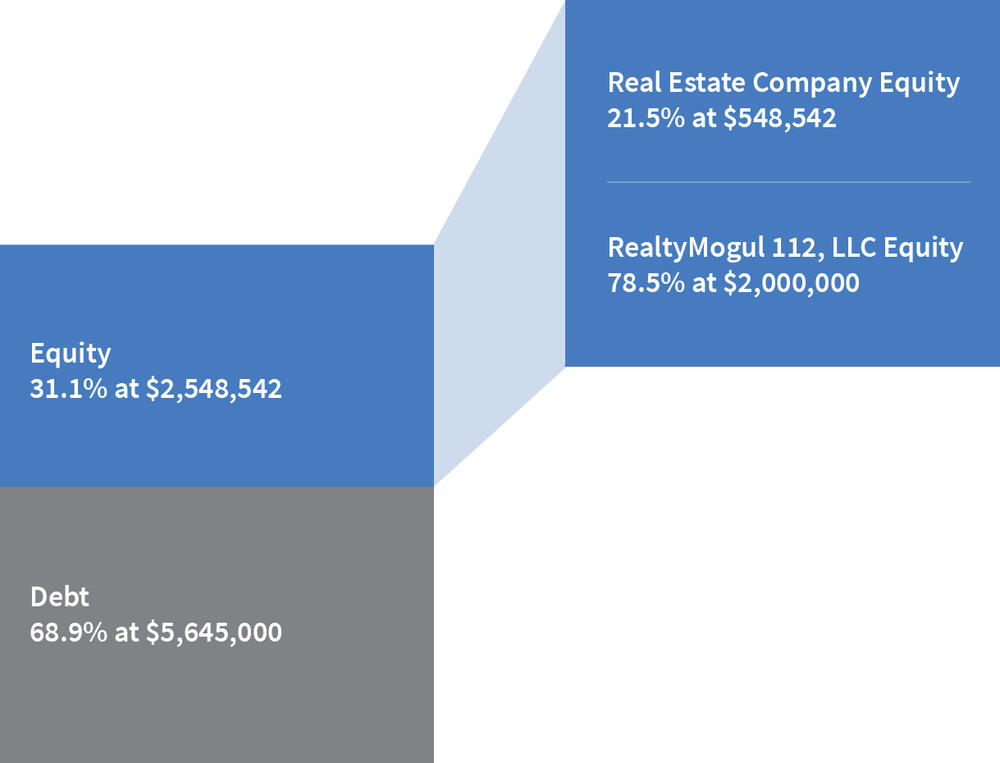
| Source of Funds | Cost |
| Debt | $5,645,000 |
| Equity | $2,548,542 |
| Total Sources of Fund | $8,193,542 |
| Uses of Funds | Cost |
| Purchase Price | $4,650,000 |
| Real Estate Company Acquisition Fee | $93,000 |
| Broker Dealer Fee | $80,000 |
| Capital Improvements, Tenant Improvements, Leasing Costs | $2,361,584 |
| Escrows/ Reserves | $469,692 |
| Closing Costs | $69,750 |
| Mortgage Tax | $11,625 |
| Transfer Tax | $16,275 |
| Loan Closing Costs and Interest Rate Cap | $125,000 |
| Debt Costs and Fees | $169,350 |
| Future Interest Reserve | $113,750 |
| Undrawn Loan Proceeds | $33,516 |
| Total Uses of Funds | $8,193,542 |
The expected terms of the debt financing are as follows:
- Lender: Ready Capital
- Estimated Initial Proceeds: $3,022,500
- Maximum Additional Funding: $2,622,500
- Estimated Interest Rate: 1 Month LIBOR + 4.50%
- Interest Only Period: 36 Months
- Amortization Period: N/A
- Loan Term: 36 Months
- Extension Options: Two (2) one-year extension options
- Prepayment Penalty: 24-months minimum interest and 1.0% exit fee
- Interest Rate Cap: 7.00%
- Recourse: No
There can be no assurance that a lender will provide debt on the rates and terms noted above, or at all. All rates and terms of the debt financing are subject to lender approval, including but not limited to possible increases in capital reserve requirements for funds to be held in a lender controlled capital reserve account.
The Target intends to make distributions of all available cash and capital proceeds to investors (The Company, Other LP investors and Real Estate Company, collectively, the "Members") as follows:
- Pro rata share of cash flow to an 8% preferred return hurdle;
- Return of capital;
- Excess balances will be split pro rata 89.2% to Members and 10.8% to Real Estate Company to a 12% IRR;
- Excess balances will be split pro rata 76.5% to Members and 23.5% to Real Estate Company to a 14% IRR;
- Excess balances will be split pro rata 57.3% to Members and 42.7% to Real Estate Company.
The Company's liabilities (loan payments, operating expenses and other fees as set forth in the operating agreement, in addition to any member loans or returns due on member loans).
The Company will distribute 100% of its share of excess cash flow (after expenses and fees) to the members of The Company (the RealtyMogul investors).
Distributions are expected to start in June 2021 and are expected to continue on a quarterly basis thereafter. These distributions are at the discretion of the Real Estate Company, who may decide to delay distributions for any reason, including maintenance or capital reserves.
Targeted Cash Flows
| Year 1 | Year 2 | Year 3 | |
|---|---|---|---|
| Effective Gross Revenue | $402,017 | $765,893 | $1,008,702 |
| Total Operating Expenses | $288,420 | $330,940 | $360,486 |
| Net Operating Income | $113,597 | $434,953 | $648,216 |
The Company Cash Flows
| Year 0 | 2018 | 2019 | 2020 | 2021 | |
|---|---|---|---|---|---|
| Distributions to The Company | ($2,040,000) | $0 | $0 | $362,068 | $2,842,163 |
| Net Earnings to Investor - Hypothetical $50,000 Investment | ($50,000) | $0 | $0 | $8,874 | $69,661 |
Certain fees and compensation will be paid over the life of the transaction. The following fees and compensation will be paid:
One-Time Fees
| Type of Fee | Amount of Fee | Received By | Paid From | Notes |
|---|---|---|---|---|
| Acquisition Fee | $93,000 | Real Estate Company | Capitalized Equity Contribution | 2.0% of the Property purchase price |
| Financing Fee | $56,450 | Real Estate Company | Capitalized Equity Contribution | 1.0% of the Loan Amount |
| Broker-Dealer Fee | $80,000 | North Capital (1) | Capitalized Equity Contribution | 4.0% of equity raised by RealtyMogul ($50,000 minimum) |
| Marketing Fee | $25,000 | RM Manager, LLC | Investor Overraise |
Recurring Fees
| Type of Fee | Amount of Fee | Received By | Paid From | Notes |
|---|---|---|---|---|
| Property Management Fee | 2.5% of Effective Gross Income | Third Party Manager | Distributable Cash | |
| Leasing Fee | 0.5% of new leases and renewals | Real Estate Company | Capex Budget, Sales Proceeds | 0.5% leasing commission paid as a percentage of new leases and renewals |
| Management and Administrative Fee | 1.0% of amount invested in Realty Mogul 107, LLC | RM Manager, LLC | Distributable Cash | RM Manager, LLC is the Manager of The Company and a wholly-owned subsidiary of Realty Mogul, Co.2 |
(1) Certain employees of Realty Mogul, Co. are registered representatives of, and are paid commissions by, North Capital Private Securities Corp., a Delaware corporation ("North Capital"). In addition, North Capital pays a technology provider services fee to Realty Mogul, Co. for licensing and access to certain technology, reporting, communications, branding, entity formation and administrative services performed from time to time by Realty Mogul, Co., and North Capital and Realty Mogul, Co. are parties to a profit sharing arrangement.
(2) Fees may be deferred to reduce impact to investor distributions.
The above presentation is based upon information supplied by the Real Estate Company or others. Realty Mogul, Co., RM Manager, LLC, and The Company, along with their respective affiliates, officers, directors or representatives (the "RM Parties") hereby advise you that none of them has independently confirmed or verified any of the information contained herein. The RM Parties further make no representations as to the accuracy or completeness of any such information and undertake no obligation now or in the future to update or correct this presentation or any information contained herein.
The information on this Page is qualified in its entirety by reference to the more complete information about the offering contained in the Sponsor’s Investment Documents. The information on this Page is not complete and subject to change at the Sponsor’s discretion at any time up to the closing date. The Sponsor’s Investment Documents and supplements thereto contain important information about the Sponsor’s offering including relevant investment objectives, the business plan, risks, charges, expenses, and other information, which you should consider carefully before investing. The information on this Page should not be used as a basis for an investor’s decision to invest.
Risk of InvestmentThis investment is speculative, highly illiquid, and involves substantial risk. There can be no assurances that all or any of Sponsor’s assumptions, expectations, estimates, goals, hypothetical illustrations, or other aspects of Sponsor’s business plans (“Assumptions”) will be true or that actual performance will bear any relation to Sponsor’s Assumptions, and no guarantee or representation is made that Sponsor’s Assumptions will be achieved. If Sponsor does not achieve its Assumptions, your investment could be materially and adversely affected. A loss of part or all of the principal value of your investment may occur. You should not invest unless you can readily bear the consequences of such loss. Sponsor’s Assumptions should not be relied upon as the primary basis for your decision to invest.
No Reliance on Forward-Looking Statements; Sponsor AssumptionsSponsor is solely responsible for statements made concerning forward-looking statements and Assumptions, which apply only as of the date made, are preliminary and subject to change, and are expressly qualified in their entirety by the disclosures and cautionary statements included in Sponsor’s Investment Documents, which you should carefully review. Sponsor is obligated to update or revise such forward-looking statements or Assumptions to reflect events or circumstances that arise after the date made or to reflect the occurrence of unanticipated events. Sponsor’s forward-looking statements and Assumptions are hypothetical, not based on actual investment achievements or events, and are presented solely for purposes of providing insight into the Sponsor’s investment objectives, detailing Sponsor’s anticipated risk and reward characteristics, and establishing a benchmark for future evaluation of actual results; therefore, they are not a predictor, projection, or guarantee of future results. You should not rely on Sponsor’s forward-looking statements as a basis to invest.
Importantly, we do not adopt, endorse, or provide any assurance of returns or as to the accuracy or reasonableness of Sponsor’s Assumptions or forward-looking statements.
No Reliance on Past PerformanceAny description of past performance is not a reliable indicator of future performance and should not be relied upon as the primary basis to invest.
Sponsor’s Use of DebtA substantial portion of the total cost of the real estate asset acquired by the Sponsor with investor funds (“Property”) will be paid with borrowed funds, i.e., debt. Sponsor’s estimated rates and terms of the debt financing are subject to lender approval, and there is no assurance that the Sponsor will secure debt at the rates and terms presented on this Page or in the Sponsor’s Investment Documents, or at all. The use of borrowed money to acquire real estate is referred to as leveraging, which can amplify losses and could result in lender foreclosure. In addition, if the debt includes a variable (or “floating”) interest rate, the total amount of interest paid over the term of the debt will fluctuate and can increase. As a result, Sponsor’s use of debt can result in a loss of some or all of your investment.
Sponsor’s Offering is Not RegisteredSponsor’s securities offering will not be registered under the Securities Act of 1933, as amended (the “Securities Act”), in reliance upon the exemptions from registration pursuant to Rule 506(c) of Regulation D as promulgated under the Securities Act (“Private Placement”). In addition, the offering will not be registered under any state securities laws in reliance on exemptions from state registration. Such securities (your ownership interests) are subject to restrictions on transferability and resale and may not be transferred or resold except as permitted under applicable state and federal securities laws pursuant to registration or an available exemption. All Private Placements on the Platform are intended solely for “Accredited Investors,” as that term is defined in Rule 501(a) under the Securities Act.
No Investment AdviceNothing on this Page should be regarded as investment advice (either with respect to a particular security or regarding an overall investment strategy), a recommendation, an offer to sell, or a solicitation of or an offer to buy any security. Advice from a securities professional is strongly advised to understand and assess the risks associated with real estate or private placement investments.
1031 Exchange RiskInternal Revenue Code Section 1031 (“Section 1031”) contains complex tax concepts and certain tax consequences may vary depending on the individual circumstances of each investor. You should consult with and rely on your own tax advisor about the tax aspects with respect to your particular circumstances.