


Comunidad Realty Partners (CRP) is a dynamic real estate investment firm specializing in multifamily apartment communities in densely-populated Hispanic neighborhoods. Core to its investment strategy is creating culturally-relevant, inclusive communities that are tailored to the various ethnicities living at its communities. CRP owns and manages over $286 million in multifamily assets overall, comprising approximately 4,800 units.
CRP specializes in acquiring and repositioning apartments in infill locations and implementing its proprietary cultural management platform which includes specific cultural upgrades and community-oriented resident services and programs. CRP uses its multifamily lifestyle brand “Buena Vida Community” at its properties to represent its mission of delivering an unparalleled experience of enhanced multifamily living by providing more than just a home but a lifestyle. The firm was founded on a simple principle: enrich lives through enhancing communities while creating value for all stakeholders involved. The firm takes a holistic approach to its investments through symbiotic stakeholder integration of residents, staff, vendors, the greater community, the environment, and investors in order to truly maximize economic and social returns. Its investment philosophy is predicated on fostering innovative lifestyle improvements that align with its residents wants and needs and differentiate the living experience in order to create long-term value for residents and communities in a socially responsible way. Additionally, the firm is focused on “green” environmental improvements that reduce its properties’ energy footprint while reducing utility costs for residents.
RealtyMogul has invested in six prior transactions with the Real Estate Company (Tuscany Apartments, Plano Portfolio, Gazebo Park, Villas de Serenada, Villas del Cabo & Villas de Santa Fe, and Villas de la Colonia). Villas de la Colonia (formerly Metrocrest Village) was acquired in Q2 2014, went full cycle in Q2 2017, and resulted in an IRR to RealtyMogul investors that exceeded pro forma. The renovation program at Villas de la Colonia pushed average leased rents up 20.1%, from $730 per unit to $877 per unit, and reduced the property's expense ratio from 56.8% to 37.3%. Net operating income increased by 32.4% at Villas de la Colonia over the hold period.
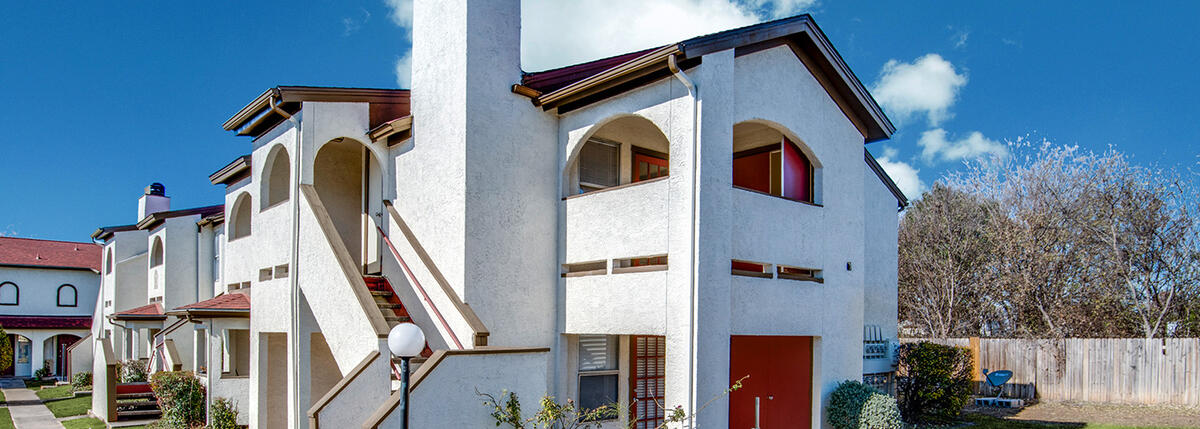
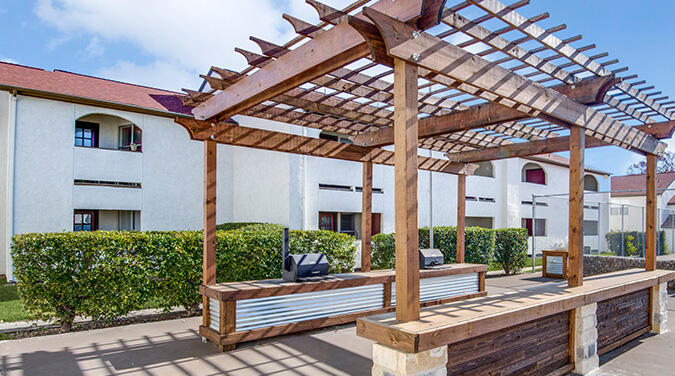
Built in 1984, the Property consists of studio, one and two-bedroom floor plans combining to 190 units, 21 buildings, 292 parking spaces, and 135,170 square feet. The weighted average unit size and rent per unit is 684 square feet and $833 ($1.22 per square foot), respectively (per the November 2017 rent roll). Amenities across the Properties include laundry centers, BBQ grills, a basketball court, a fitness center, a dog park, a picnic area, a carport, and a leasing center. The Property is currently 93.0% occupied and includes 292 on-site parking spaces (1.54 per unit).
| Unit Type | # of Units | % of Total | Unit (Square Feet) | Total Square Feet | Rent Per Unit | Rent Per Square Foot |
|---|---|---|---|---|---|---|
| Studio | 24 | 13% | 486 | 11,664 | $682 | $1.40 |
| 1 Bed, 1 Bath | 96 | 51% | 600 | 57,600 | $763 | $1.27 |
| 1 Bed, 1.5 Bath | 14 | 7% | 715 | 10,010 | $847 | $1.18 |
| 2 Bed, 1 Bath | 32 | 17% | 842 | 26,944 | $985 | $1.17 |
| 2 Bed, 2 Bath | 24 | 13% | 986 | 23,664 | $1,055 | $1.07 |
| Totals/Averages | 190 | 100% | 684 | 129,882 | $833 | $1.22 |
| Stonehill at Pipers Creek | Forest Oaks | Villas de Sendero | The Hollows | Averages | Subject (Purchase) | Subject (Refi)* | |
|---|---|---|---|---|---|---|---|
| Date | Sep-17 | Feb-17 | Dec-16 | Nov-16 | Feb-18 | Sep-16 | |
| Submarket | Far West | North Arlington | Far West | Far West | Far West | Far West | |
| # of Units | 292 | 166 | 208 | 432 | 275 | 190 | 190 |
| Year Built | 1985/2009 | 1970/1978 | 1984 | 1983/2016 | 1984 | 1984/2015 | 1984/2015 |
| Purchase Price | $23,200,000 | $11,500,000 | $14,500,000 | $27,300,000 | $19,125,000 | $14,300,000 | $14,900,000 |
| $/Unit | $79,452 | $69,277 | $69,712 | $63,194 | $70,409 | $75,263 | $78,421 |
| Cap Rate | N/A | N/A | N/A | 5.40% | 5.40% | 4.47% | 4.90% |
| Three Fountains | Verdant Westover Hills | Tara Vista | Stoneybrook | Averages | Subject (Post-Renovation) | |
|---|---|---|---|---|---|---|
| # of Units | 276 | 220 | 543 | 328 | 190 | |
| Year Built | 1998 | 1997 | 1997 | 1980 | 1993 | 1984 |
| Occupancy | 92% | 93% | 93% | 95% | 93% | 93% |
| Average SF | 855 | 820 | 795 | 900 | 856 | 684 |
| Average Rental Rate | $963 | $970 | $1,030 | $996 | $989 | $914 |
| Average $/SF | $1.13 | $1.18 | $1.30 | $1.11 | $1.16 | $1.34 |
| Distance (miles from subject) | 0.8 | 0.5 | 1.1 | 1.8 | 1.1 |
Lease and Sale Comparable information provided by Axiometrics and Real Capital Analytics.
| Sources of Funds | Cost |
|---|---|
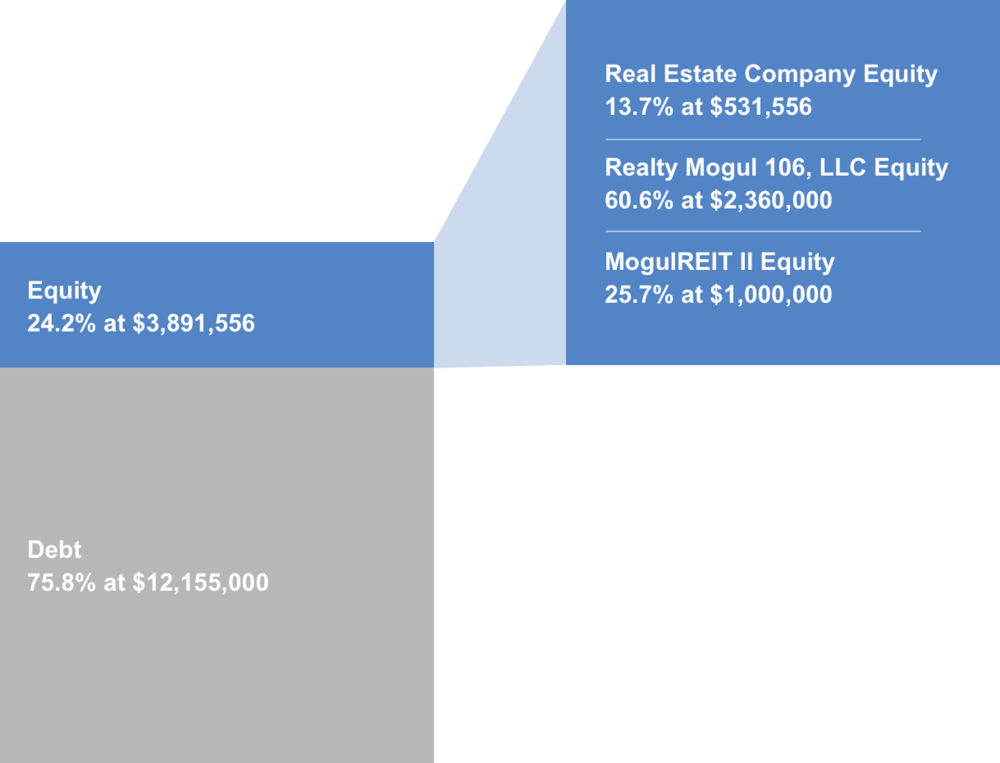
| Debt | $12,155,000 |
| Equity | $3,891,556 |
| Total Sources of Funds | $16,046,556 |
| Uses of Funds | Cost |
| Purchase Price | $14,300,000 |
| CapEx Reserve | $931,700 |
| Real Estate Company Acquisition Fee | $143,000 |
| MogulREIT II Acquisition Fee | $48,750 |
| North Capital Broker Dealer Fee | $115,050 |
| Lender Origination Fee | $97,240 |
| Closing Costs | $118,200 |
| Working Capital | $175,116 |
| Escrows | $67,500 |
| Cash Flow Reserve | $50,000 |
| Total Uses of Funds | $16,046,556 |
The expected terms of the debt financing are as follows:
- Lender: Prudential (Fannie Mae)
- Estimated Proceeds: $12,155,000
- Estimated Rate (Fixed): 4.425%
- Amortization: 30 years, with five years of interest-only
- Term: 12 years
- Prepayment Penalty: 11.5 years of yield maintenance
There can be no assurance that a lender will provide debt on the rates and terms noted above, or at all. All rates and terms of the debt financing are subject to lender approval, including but not limited to possible increases in capital reserve requirements for funds to be held in a lender controlled capital reserve account.
The Target will make distributions to investors (The Company, MogulREIT II, and Real Estate Company, collectively, the "Members") as follows:
Operating Income, Refinance, and Sales Proceeds
- To the Members, in proportion to, and to the extent of, their accrued but unpaid preferred returns (8.0%).
- To the Members, in proportion to, and to the extent of, their unreturned capital.
- 70.0% / 30.0% (70.0% to Members / 30.0% to the Real Estate Company) of excess cash flows and appreciation to a 16.0% IRR to Members.
- 60.0% / 40.0% (60.0% to Members / 40.0% to the Real Estate Company) of excess cash flow and appreciation thereafter.
Note that these distributions will occur after the payment of the Company's liabilities (loan payments, operating expenses and other fees as set forth in the LLC agreement, in addition to any member loans or returns due on member loans).
The Company will distribute 100% of its share of excess cash flow (after expenses) to the members of The Company (the RealtyMogul.com investors). The manager of The Company will receive a portion (up to 10% pro-rata) of the Real Estate Company's promote interest. Distributions are expected to start in September 2018 and are projected to continue on a quarterly basis thereafter. These distributions are at the discretion of the Real Estate Company, who may decide to delay distributions for any reason, including maintenance or capital reserves.
| 2018 | 2019 | 2020 | 2021 | 2022 | 2023 | 2024 | |
|---|---|---|---|---|---|---|---|
| Effective Gross Revenue | $1,968,437 | $2,101,914 | $2,188,081 | $2,246,806 | $2,298,182 | $2,355,393 | $2,415,325 |
| Total Operating Expenses | $988,095 | $1,016,380 | $1,043,927 | $1,071,351 | $1,099,276 | $1,128,116 | $1,157,800 |
| Net Operating Income | $980,342 | $1,085,534 | $1,144,154 | $1,175,455 | $1,198,907 | $1,227,277 | $1,257,525 |
| Year 0 | 2018 | 2019 | 2020 | 2021 | 2022 | 2023 | 2024 | |
|---|---|---|---|---|---|---|---|---|
| Distributions to Realty Mogul 106, LLC Investors |
($2,380,000) | $225,194 | $275,715 | $312,265 | $331,290 | $345,169 | $253,349 | $3,462,665 |
| Net Earnings to Investor - Hypothetical $50,000 Investment |
($50,000) | $4,731 | $5,792 | $6,560 | $6,960 | $7,251 | $5,322 | $72,745 |
Certain fees and compensation will be paid over the life of the transaction. The following fees and compensation will be paid:
| Type of Fee | Amount of Fee | Received By | Paid From | Notes |
|---|---|---|---|---|
| Acquisition Fee | $143,000 | Real Estate Company | Capitalized Equity Contribution | 1.0% of the Property purchase price. |
| Acquisition Fee | $48,750 | RM Advisor, LLC | Capitalized Equity Contribution | RM Advisor, LLC is the Manager of MogulREIT II and a wholly-owned subsidiary of Realty Mogul, Co. |
| Disposition Fee | 1.0% of gross sale proceeds | RM Advisor, LLC | Distributable Cash | RM Advisor, LLC is the Manager of MogulREIT II and a wholly-owned subsidiary of Realty Mogul, Co. |
| Broker-Dealer Fee | $115,020 | North Capital (1) | Capitalized Equity Contribution | 4.875% based on the amount of equity invested by Realty Mogul 106, LLC. |
| Construction Management Fee | 10.0% of costs | Real Estate Company | Capitalized Equity Contribution |
| Type of Fee | Amount of Fee | Received By | Paid From | Notes |
|---|---|---|---|---|
| Asset Management Fee | 1.5% of effective gross revenues | Real Estate Company | Operating Cash Flow | |
| Management and Administrative Fee | 1.25% of amount invested in Realty Mogul 106, LLC | RM Manager, LLC | Distributable Cash | RM Manager, LLC is the Manager of Realty Mogul 106, LLC and a wholly-owned subsidiary of Realty Mogul, Co. (2) |
(1) Certain employees of Realty Mogul, Co. are registered representatives of, and are paid commissions by, North Capital Private Securities Corp., a Delaware corporation ("North Capital"). In addition, North Capital pays a technology provider services fee to Realty Mogul, Co. for licensing and access to certain technology, reporting, communications, branding, entity formation and administrative services performed from time to time by Realty Mogul, Co., and North Capital and Realty Mogul, Co. are parties to a profit sharing arrangement.
(2) Fees may be deferred to reduce impact to investor distributions.
The above presentation is based upon information supplied by the Real Estate Company or others. Realty Mogul, Co., RM Manager, LLC, and The Company, along with their respective affiliates, officers, directors or representatives (the "RM Parties") hereby advise you that none of them has independently confirmed or verified any of the information contained herein. The RM Parties further make no representations as to the accuracy or completeness of any such information and undertake no obligation now or in the future to update or correct this presentation or any information contained herein.
The information on this Page is qualified in its entirety by reference to the more complete information about the offering contained in the Sponsor’s Investment Documents. The information on this Page is not complete and subject to change at the Sponsor’s discretion at any time up to the closing date. The Sponsor’s Investment Documents and supplements thereto contain important information about the Sponsor’s offering including relevant investment objectives, the business plan, risks, charges, expenses, and other information, which you should consider carefully before investing. The information on this Page should not be used as a basis for an investor’s decision to invest.
Risk of InvestmentThis investment is speculative, highly illiquid, and involves substantial risk. There can be no assurances that all or any of Sponsor’s assumptions, expectations, estimates, goals, hypothetical illustrations, or other aspects of Sponsor’s business plans (“Assumptions”) will be true or that actual performance will bear any relation to Sponsor’s Assumptions, and no guarantee or representation is made that Sponsor’s Assumptions will be achieved. If Sponsor does not achieve its Assumptions, your investment could be materially and adversely affected. A loss of part or all of the principal value of your investment may occur. You should not invest unless you can readily bear the consequences of such loss. Sponsor’s Assumptions should not be relied upon as the primary basis for your decision to invest.
No Reliance on Forward-Looking Statements; Sponsor AssumptionsSponsor is solely responsible for statements made concerning forward-looking statements and Assumptions, which apply only as of the date made, are preliminary and subject to change, and are expressly qualified in their entirety by the disclosures and cautionary statements included in Sponsor’s Investment Documents, which you should carefully review. Sponsor is obligated to update or revise such forward-looking statements or Assumptions to reflect events or circumstances that arise after the date made or to reflect the occurrence of unanticipated events. Sponsor’s forward-looking statements and Assumptions are hypothetical, not based on actual investment achievements or events, and are presented solely for purposes of providing insight into the Sponsor’s investment objectives, detailing Sponsor’s anticipated risk and reward characteristics, and establishing a benchmark for future evaluation of actual results; therefore, they are not a predictor, projection, or guarantee of future results. You should not rely on Sponsor’s forward-looking statements as a basis to invest.
Importantly, we do not adopt, endorse, or provide any assurance of returns or as to the accuracy or reasonableness of Sponsor’s Assumptions or forward-looking statements.
No Reliance on Past PerformanceAny description of past performance is not a reliable indicator of future performance and should not be relied upon as the primary basis to invest.
Sponsor’s Use of DebtA substantial portion of the total cost of the real estate asset acquired by the Sponsor with investor funds (“Property”) will be paid with borrowed funds, i.e., debt. Sponsor’s estimated rates and terms of the debt financing are subject to lender approval, and there is no assurance that the Sponsor will secure debt at the rates and terms presented on this Page or in the Sponsor’s Investment Documents, or at all. The use of borrowed money to acquire real estate is referred to as leveraging, which can amplify losses and could result in lender foreclosure. In addition, if the debt includes a variable (or “floating”) interest rate, the total amount of interest paid over the term of the debt will fluctuate and can increase. As a result, Sponsor’s use of debt can result in a loss of some or all of your investment.
Sponsor’s Offering is Not RegisteredSponsor’s securities offering will not be registered under the Securities Act of 1933, as amended (the “Securities Act”), in reliance upon the exemptions from registration pursuant to Rule 506(c) of Regulation D as promulgated under the Securities Act (“Private Placement”). In addition, the offering will not be registered under any state securities laws in reliance on exemptions from state registration. Such securities (your ownership interests) are subject to restrictions on transferability and resale and may not be transferred or resold except as permitted under applicable state and federal securities laws pursuant to registration or an available exemption. All Private Placements on the Platform are intended solely for “Accredited Investors,” as that term is defined in Rule 501(a) under the Securities Act.
No Investment AdviceNothing on this Page should be regarded as investment advice (either with respect to a particular security or regarding an overall investment strategy), a recommendation, an offer to sell, or a solicitation of or an offer to buy any security. Advice from a securities professional is strongly advised to understand and assess the risks associated with real estate or private placement investments.
1031 Exchange RiskInternal Revenue Code Section 1031 (“Section 1031”) contains complex tax concepts and certain tax consequences may vary depending on the individual circumstances of each investor. You should consult with and rely on your own tax advisor about the tax aspects with respect to your particular circumstances.