The team at our affiliated broker-dealer, RM Securities, conducts diligence on of the issuer, including detailed background checks, criminal checks, bad actor checks, and reference checks on sponsors. In addition to screening for any criminal background, we may also turn down sponsors due to poor reference checks, even if the background and criminal checks are satisfactory.
We require unaffiliated sponsors to use an unaffiliated third-party escrow agent.* When an investor makes an investment with such sponsors using the RealtyMogul platform, the investor’s money is transferred directly into a third-party escrow account. All closing conditions in connection with a sponsor’s contingency offering need to be met before the third-party escrow agent will approve releasing investor funds to the issuer or general partner. For example, if an issuer or general partner plans to use funds for a real estate acquisition that does not ultimately transact, the third-party escrow agent will not transfer investor funds to the issuer or general partner, and funds will be returned to investors.
* Unless otherwise disclosed, escrow accounts are not required for some investments that accommodate 1031 investments where the property is already acquired.
Our processes typically includes visiting certain properties (or a subset of properties if it's a fund) to confirm the real estate is what and where the real estate is supposed to be. For certain properties that accommodate 1031 exchange investments, the team will review third-party prepared due diligence reports in lieu of a site visit.
We have formalized processes and checklists for every private placement deal listed on the platform.
Bluerock Exchange LLC
Bluerock Exchange, LLC, a Delaware limited liability company, is an affiliate of Bluerock Real Estate, LLC (“Bluerock”), a private equity real estate investment firm having sponsored a portfolio currently exceeding 16 million square feet of primarily apartment and office real estate. Bluerock's senior management team has an average of over 25 years investing experience, has been involved with acquiring over 35 million square feet of real estate worth approximately $10 billion, and has helped launch leading real estate private and public company platforms. The Trust is to be managed by BR Glenwood DST Manager, LLC, a Delaware limited liability company (the “Manager”), an affiliate of Bluerock.
Bluerock Property Management, LLC (the "Property Manager") has subcontracted all day-to-day, on-site management, leasing and related functions for the Property to Greystar Real Estate Partners (the "Property Sub-Manager" or "Greystar"). Greystar has approximately 415,634 units under management and was ranked as the #1 property manager on the National Multifamily Housing Council (NHMC)'s list of top 50 mangers in the nation.*
*Per the Sponsor
Property Name | Location | Property Type | Acquisition Date | # Units | Approximate Acquisition Price |
---|---|---|---|---|---|
Alamance Reserve | Burlington, NC | Apartments | 4.2014 | 240 | $ 23,790,000 |
Ansley Village | Macon, GA | Apartments | 6.2014 | 294 | $ 31,760,000 |
Alexan City Centre | Houston, TX | Apartments | 7.2014 | 340 | $ 83,000,000 |
Alexan Southside | Houston, TX | Apartments | 1.2015 | 270 | $ 49,000,000 |
APOK Townhomes | Boca Raton, FL | Apartments | 11.2016 | 90 | $ 28,900,000 |
Arium Grandewood | Orlando, FL | Apartments | 11.2014 | 306 | $ 44,400,000 |
Arium Palmer-Ranch | Sarasota, FL | Apartments | 1.2016 | 320 | $ 40,300,000 |
Arium Palms Gateway | Orlando, FL | Apartments | 8.2015 | 252 | $ 37,000,000 |
Arium Gulfshore | Naples, FL | Apartments | 1.2016 | 368 | $ 46,000,000 |
Arium Pine Lakes | Port St. Lucie, FL | Apartments | 12.2016 | 320 | $ 38,300,000 |
Arium Westside | Atlanta, GA | Apartments | 7.2016 | 336 | $ 75,500,000 |
Ashton Reserve | Charlotte, NC | Apartments | 1.2016 | 473 | $ 66,550,000 |
Beach House | Jacksonville Beach, FL | Apartments | 4.2016 | 228 | $ 51,570,000 |
Big Creek | Alpharetta,GA | Apartments | 12.2016 | 372 | $ 84,460,000 |
Brooklyn Riverside | Jacksonville, FL | Apartments | 6.2016 | 310 | $ 64,130,000 |
Chace Lake | Birmingham, AL | Apartments | 9.2012 | 264 | $ 25,640,000 |
Clearwater Apartments | Clearwater, FL | Apartments | 9.2015 | 240 | $ 46,250,000 |
City Walk Apartments | Roswell, GA | Apartments | 12.2016 | 320 | $ 76,000,000 |
CoHo House | Atlanta, GA | Apartments | 6.2014 | 128 | $ 20,760,000 |
Crescent Perimeter | Atlanta, GA | Apartments | 12.2016 | 320 | $ 70,000,000 |
Domain Phase I | Garland, TX | Apartments | 12.2015 | 301 | $ 52,590,000 |
Enders Place | Orlando, FL | Apartments | 10.2012 | 198 | $ 25,100,000 |
Flager Village | Fort Lauderdale, FL | Apartments | 12.2015 | 384 | $ 131,790,000 |
Grand at the Dominion | San Antonio, TX | Apartments | 9.2017 | 320 | $ 51,725,000 |
Helios | Atlanta, GA | Apartments | 6.2015 | 285 | $ 50,900,000 |
James on South First | Austin, TX | Apartments | 11.2016 | 250 | $ 36,750,000 |
Land Four Corners | Davenport, FL | Apartments | 2.2016 | 270 | $ 38,850,000 |
Marquis at the Cascades I | Tyler, TX | Apartments | 6.2017 | 328 | $ 44,650,000 |
Marquis at the Cascades II | Tyler, TX | Apartments | 6.2017 | 254 | $ 28,500,000 |
Marquis at Crown Ridge | San Antonio, TX | Apartments | 6.2017 | 352 | $ 39,500,000 |
Marquis at Stone Oak | San Antonio, TX | Apartments | 6.2017 | 335 | $ 55,350,000 |
Marquis at TPC | San Antonio, TX | Apartments | 6.2017 | 139 | $ 20,850,000 |
Park at Chapel Hill | Chapel Hill, NC | Apartments | 2.2011 | 198 | $ 8,400,000 |
Park & Kingston | Charlotte, NC | Apartments | 3.2015 | 168 | $ 31,250,000 |
Plaza Gardens | Overland Park, KS | Apartments | 8.2008 | 200 | $ 25,500,000 |
Pres. Henderson Beach | Destin, FL | Apartments | 3.2016 | 340 | $ 53,700,000 |
Preston View | Morrisville, NC | Apartments | 2.2017 | 382 | $ 59,500,000 |
Sonoma Pointe | Kissimmee, FL | Apartments | 8.2017 | 216 | $ 44,530,000 |
Sorrel Phillips Creek | Frisco, TX | Apartments | 11.2015 | 252 | $ 52,050,000 |
Sovereign Apartments | Fort Worth, TX | Apartments | 11.2015 | 322 | $ 47,650,000 |
Stonebrook | Nashville, TN | Apartments | 12.2011 | 320 | $ 18,250,000 |
The Brodie | Austin, TX | Apartments | 12.2016 | 324 | $ 48,900,000 |
The Nevadan | Atlanta, GA | Apartments | 10.2016 | 480 | $ 68,250,000 |
Valley Townhomes | Puyallup, WA | Apartments | 7.2008 | 220 | $ 42,570,000 |
Vickers | Roswell, GA | Apartments | 12.2016 | 79 | $ 30,880,000 |
Villages of Cypress Creek | Houston, TX | Apartments | 9.2017 | 384 | $ 40,700,000 |
Villages at Lake Boone | Raleigh, NC | Apartments | 1.2016 | 240 | $ 40,000,000 |
Wesley Village | Charlotte, NC | Apartments | 3.2017 | 301 | $ 58,000,000 |
West Morehead | Charlotte, NC | Apartments | 1.2016 | 287 | $ 60,000,000 |
Whetstone | Durham, NC | Apartments | 5.2015 | 204 | $ 35,600,000 |
Cummings Research Park I | Huntsville, AL | Office | 11.2007 | - | $ 58,460,000 |
Cummings Research Park II | Huntsville, AL | Office | 11.2007 | - | $ 63,990,000 |
Cummings Research Park III | Huntsville, AL | Office | 11.2007 | - | $ 57,210,000 |
Summit at Southpoint | Jacksonville, FL | Office | 12.2006 | - | $ 37,400,000 |
Town & Country | St. Louis, MO | Office | 6.2008 | - | $ 51,790,000 |
Applebee's | Jonesboro, GA | Retail | 4.2013 | - | $ 2,850,000 |
Dollar General | Hartford, CT | Retail | 4.2013 | - | $ 1,800,000 |
Dollar General | Jacksonville, FL | Retail | 4.2013 | - | $ 1,550,000 |
TCF Bank | Chicago, IL | Retail | 4.2013 | - | $ 3,060,000 |
Walgreens | Haltom City, TX | Retail | 4.2013 | - | $ 4,390,000 |
Walgreens | Abilene, TX | Retail | 4.2013 | - | $ 5,040,000 |
TOTAL | 14,460 | $2,633,135,000 |
Property Name | Location | Property Type | Acquisition /Sale Date | Approximate Purchase Cost | Approximate Equity Invested | Total Gross Return | Gross IRR |
---|---|---|---|---|---|---|---|
Woodlands | Hauppauge, NY | Office | 04/2013 - 05/2006 | 16,900,000 | 5,000,000 | 6,480,000 | 9.9% |
The Ashford | Atlanta, GA | Apartments | 11/2009 - 09/2011 | 19,750,000 | 2,040,000 | 4,190,000 | 47.9% |
Lynd Portfolio Subtotal | Apartments | 21,900,000 | 6,340,000 | 12,090,000 | 17.5% | ||
- Mesa Ridge | San Antonio, TX | Apartments | 12/2008 - 03/2011 | 6,550,000 | 2,010,000 | 4,810,000 | |
- Meadows | Austin, TX | Apartments | 02/2008 - 10/2011 | 3,450,000 | 1,040,000 | 2,470,000 | |
- Stratford | San Antonio, TX | Apartments | 12/2008 - 10/2012 | 11,190,000 | 3,290,000 | 4,810,000 | |
Tech Ridge | Austin, TX | Apartments | 02/2010 - 08/2012 | 17,190,000 | 6,030,000 | 13,170,000 | 42.5% |
Note 16 | Nashville, TN | Apartments | 03/2012 - 06/2013 | 11,300,000 | 1,420,000 | 2,510,000 | 53.1% |
Hillsboro | Nashville, TN | Apartments | 09/2010 - 09/2013 | 31,600,000 | 3,900,000 | 8,560,000 | 33.1% |
Meadowmont | Chapel Hill, NC | Apartments | 04/2010 - 09/2013 | 37,000,000 | 4,700,000 | 11,330,000 | 32.0% |
The Stratford | Cary, NC | Apartments | 06/2012 - 12/2013 | 20,300,000 | 5,290,000 | 7,980,000 | 38.8% |
Arbor Terrace | Marietta, GA | Apartments | 05/2011 - 03/2014 | 15,500,000 | 7,890,000 | 10,010,000 | 10.2% |
Creekside Village | Chattanooga, TN | Apartments | 03/2010 - 03/2014 | 14,250,000 | 1,820,000 | 4,130,000 | 26.4% |
Landmark | St. Louis, MO | Office | 03/2007 - 07/2014 | 26,030,000 | 7,500,000 | -24.5% | |
Estates at Perimeter | Augusta, GA | Apartments | 09/2010 - 11/2014 | 24,950,000 | 1,930,000 | 2,410,000 | 6.5% |
Grove at Waterford | Hendersonville, TN | Apartments | 04/2012 - 11/2014 | 27,880,000 | 4,670,000 | 6,250,000 | 17.3% |
23Hundred Berry Hill | Nashville, TN | Apartments | 10/2012 - 01/2015 | 33,670,000 | 4,440,000 | 8,350,000 | 59.4% |
Villas at Oak Crest | Chattanooga, TN | Apartments | 04/2012 - 09/2015 | 15,520,000 | 2,900,000 | 3,730,000 | 15.5% |
North Park Towers | Southfield, MI | Apartments | 12/2005 - 10/2015 | 36,900,000 | 11,430,000 | 2,830,000 | -12.2% |
Artisan on 18th | Nashville, TN | Apartments | 06/2013 - 10/2015 | 22,300,000 | 1,000,000 | 2,120,000 | 35.2% |
Indian Springs | El Paso, TX | Apartments | 09/2011 - 10/2015 | 12,350,000 | 2,740,000 | 2,690,000 | -0.5% |
Springhouse | Newport News, VA | Apartments | 12/2009 - 08/2016 | 29,500,000 | 6,890,000 | 16,560,000 | 17.4% |
Mesa Ridge | San Antonio, TX | Apartments | 03/2011 - 11/2016 | 10,940,000 | 5,160,000 | 8,070,000 | 9.8% |
EOS | Orlando, FL | Apartments | 07/2014 - 12/2016 | 36,960,000 | 11,090,000 | 19,630,000 | 41.2% |
Village Green | Ann Arbor, MI | Apartments | 09/2012 - 02/2017 | 58,000,000 | 8,190,000 | 18,430,000 | 24.2% |
Lansbrook | Palm Harbor, FL | Apartments | 03/2014 - 04/2017 | 58,500,000 | 16,510,000 | 30,530,000 | 27.2% |
Fox Hill | Austin, TX | Apartments | 04/2015 - 04/2017 | 38,150,000 | 11,920,000 | 19,310,000 | 25.8% |
MDA City | Chicago, IL | Apartments | 12/2012 - 06/2017 | 54,870,000 | 9,760,000 | 22,680,000 | 24.3% |
Total | 693,180,000 | 150,510,000 | $243,840,000 |
*Figures do not reflect any fees that may have been associated with the transaction.
**These returns were provided by and calculated by the Sponsor
On December 13, 2017 the Sponsor acquired the Property from a third-party seller. Concurrently with the acquisition of the Property, the Trust obtained a loan from KeyBank under the Fannie Mae DUS program. The Property is master leased by the Trust to BR Glenwood Leaseco, LLC ("Master Lessee" or "Master Tenant") an affiliate of the Sponsor. The Master Tenant sub-leases the apartment units to the end-user tenants pursuant to residential leases. The Trust is a passive owner of the Property and will not be involved in any manner in the active management of the Property. BR Glenwood DST Manager, LLC (the "Manager") has been appointed to manage the Trust pursuant to the Trust Agreement.
The Trust expects to provide the Beneficial Owners a return on their investment in two primary ways: (i) in the form of monthly cash distributions to the Beneficial Owners; and (ii) upon any disposition of the Property. The Trust intends to dispose of all of the assets in the Trust in a single sale of the Property. This strategy is anticipated to provide investors with the opportunity to perform a 1031 exchange following the disposition.
The Property is a 216-unit Class A Multifamily apartment community located in one of Atlanta's desirable neighborhoods with an average household income of $89,953 (per the CBRE appraisal). The Property was delivered in April 2017 and is still in the initial lease-up phase. Occupancy was 91% as of November 2017. The unit mix consists of 30 studios, 121 one-bedroom units, and 65 two-bedroom units. Average in-place monthly rents are $1,613 per unit ranging from $1,423 to $2,417.
The Property currently offers numerous amenities including a saltwater swimming pool, fitness center, business center, bicycle repair/storage room, dog spa, bocce court, game room, and charging stations. In addition, the Property has controlled automobile and pedestrian access.
Unit amenities include wood cabinets with quartz countertops, plank flooring in the kitchen area, nine-foot ceiling, in-unit washer and dryer, LED lighting, and private patios/balconies.
Unit Type | # of Units | Avg SF/Unit | Avg Rent/Unit | Avg Rent/SF |
---|---|---|---|---|
Studio | 30 | 630 | $1,287 | $2.04 |
1 BR / 1 BA | 121 | 732 | $1,410 | $1.92 |
2 BR / 2 BA | 65 | 1,087 | $1,927 | $1.77 |
Total | 216 | 825 | $1,608 | $1.94 |
Enso | Station R | Alexan EAV | Alexan on Krog | Inman Quarter | 675 Highland | Total / Averages | Subject | |
---|---|---|---|---|---|---|---|---|
# of Units | 333 | 285 | 120 | 222 | 172 | 125 | 226 | 216 |
Year Built | 2011 | 2017 | 2016 | 2015 | 2015 | 2016 | 2015 | 2017 |
Average SF (Per Unit) | 993 | 917 | 901 | 936 | 849 | 997 | 919 | 825 |
Average Rental Rate (Per Unit) | $1,462 | $1,781 | $1,468 | $2,093 | $1,913 | $2,241 | $1,743 | $1,608 |
Average Rent PSF | $1.47 | $1.94 | $1.63 | $2.24 | $2.24 | $2.25 | $1.90 | $1.94 |
Source: Newmark Knight Frank Appraisal dated August 18, 2017
The Peninsula Buckhead | Broadstone Court | Heights at West Midtown | Alexander on Ponce | 935M | Total / Averages | Subject | |
---|---|---|---|---|---|---|---|
Date | Jul-17 | Jun-17 | May-17 | Jan-17 | Dec-16 | - | Dec-17 |
# of Units | 311 | 250 | 244 | 330 | 282 | 283 | 216 |
Year Built | 2008 | 2015 | 2016 | 2002 | 2010 | 2010 | 2017 |
Occupancy | 95% | 95% | 90% | 95% | 96% | 94.2% | 91% |
Purchase Price | $63,500,000 | $58,200,000 | $57,500,000 | $64,400,000 | $58,450,000 | $60,410,000 | $50,250,000 |
$/Unit | $204,180 | $232,800 | $235,656 | $195,152 | $207,270 | $215,012 | $232,639 |
Cap Rate | 5.21% | 4.70% | 3.78% | 5.00% | 4.95% | 4.73% | 5.4% |
Class | A | A | A | A | A | - | A |
Source: CBRE Appraisal dated November 13, 2017
Property Appraisal available upon request. Please email investor-help@realtymogul.com.
The Property is located along Glenwood Avenue in East Atlanta, a rapidly transforming area of the city approximately 2 miles east of downtown within the Glenwood Park neighborhood, a $150 million, award winning development, featuring a mix of well-designed homes and commercial spaces. East Atlanta has already become a highly desirable urban infill part of the city and the Property boasts a premier location near the intersection of Glenwood Avenue and the East Side Trail connection, part of the Atlanta BeltLine extension enhancing access and walkability to the entire Atlanta Metro area. Anchored by the BeltLine’s Eastside Trail, the area is home to several transformative, mixed-use developments such as Ponce City Market, Inman Park Village and Krog Street Market. The future wave of surrounding economic development includes Summerhill, Atlanta Dairies, The Beacon Atlanta, Atlanta Stockade, and Larkin on Memorial. Additionally, East Atlanta is the most prominent retail district in the city and offers tremendous access to a wide variety of award winning restaurants and trendy nightlife.
[[{"fid":"52639","view_mode":"default","type":"media","field_deltas":{},"attributes":{"height":"978","width":"1531","class":"media-element file-default","data-delta":"1"},"fields":{}}]]
Market Overview
The Property is located in Atlanta, Georgia in the Atlanta Metropolitan Statistical Area (“Atlanta Metro”) in the northern part of Georgia, along Glenwood Avenue, approximately 2 miles east of downtown Atlanta. The Atlanta Metro is comprised of approximately 4.4 million residents. From April 1, 2016 to April 1, 2017, the region added 78,300 new residents. The Atlanta region has grown by over 400,000 residents since 2010. The region is projected to add 2.5 million people by 2040, the equivalent of Metro Charlotte, bringing the Atlanta Metro region total to more than 8 million people. The Atlanta Metro is home to 26 Fortune 1000 Companies, 15 Fortune 500 Company Headquarters, and 220 companies in the Inc. 5000.
According to the Bureau of Labor Statistics, job growth in Atlanta-Sandy Springs-Roswell, GA Metro Area was 2.4% in October 2017, reflecting 65,800 jobs added during a 12-month period. The metro job growth figure was above the national number of 1.4%. Axiometrics forecasts Atlanta-Sandy Springs-Roswell, GA Metro Area's job growth to be 2.6% in 2018. As of December 17, 2017, Axiometrics has identified 12,177 apartment units scheduled for delivery in 2017, of which, 8,919 have been delivered. As a comparison, there were 8,915 apartment units delivered in 2016.
The Property is a part of the Atlanta-Sandy Springs-Roswell, GA apartment market. Effective rent increased 1.5% from $1,136 in 2Q17 to $1,153 in 3Q17, which resulted in an annual growth rate of 3.1%. Annual effective rent growth is forecast to be 3.0% in 2018, and average 2.5% from 2019 to 2021. The market's annual rent growth rate was above the national average of 2.2%. Out of the 120 markets ranked by Axiometrics nationally, Atlanta-Sandy Springs-Roswell, GA Metro Area was 26th for quarterly effective rent growth, and 42nd for annual effective rent growth for 3Q17. The market's occupancy rate increased from 94.3% in 2Q17 to 94.6% in 3Q17, but was down from 95.0% a year ago. For the forecast period, the market's occupancy rate is expected to be 94.2% in 2018, and average 94.2% from 2019 to 2021.
Submarket Overview
Per Axiometrics, the Property is located in the South Fulton submarket of the Atlanta-Sandy Springs-Roswell, GA Metro Area. Effective Rent Growth was 3.5% in 3Q17, which ranks 12th of 20 submarkets. Axiometrics forecasts rent growth to average 2.8% from 2018-2021. Occupancy was 94.0% in 3Q17 which ranks 16th of 20 submarkets. Axiometrics forecasts occupancy to be an average of 93.6% from 2018-2021. The submarket has average rents of $955, which are below the market average of $1,153.
Market and Submarket Overview information above was obtained from Axiometrics and the PPM.
Demographic Information
Distance from Property | 1 Mile | 3 Miles | 5 Miles |
Population | 14,972 | 142,934 | 325,487 |
Population Projection (2022) | 15,650 | 149,709 | 341,159 |
Average Age | 35,8 | 35.2 | 35.5 |
Median Household Income | $74,164 | $52,105 | $51,486 |
Average Household Size | 2.0 | 2.0 | 2.1 |
Median Home Value | $265,561 | $242,497 | $240,419 |
Owner Occupied Households | 4,471 | 27,631 | 61,916 |
Renter Occupied Households | 2,679 | 36,455 | 74,266 |
Population Growth 2017 -2022 | 4.53% | 4.74% | 4.81% |
Demographic information above was obtained from CoStar.
This content does not constitute an offer to sell or a solicitation of an offer to buy any securities. RealtyMogul.com and North Capital Private Securities are in the process of screening, performing due diligence, and verifying information for the offering. The content is presented to gauge interest only and is subject to change without notice.
Sources of Funds | Cost |
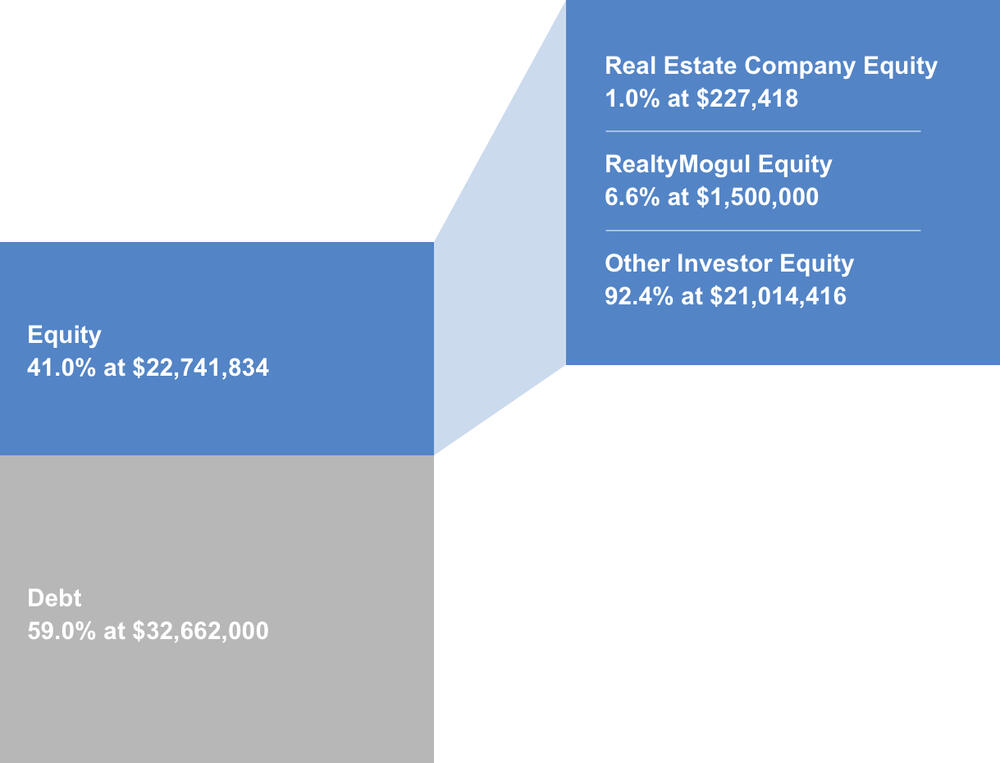
---|---|
Debt | $32,662,000 |
Equity | $22,741,834 |
Total Sources of Funds | $55,403,834 |
Uses of Funds | Cost |
Purchase Price | $50,250,000 |
Acquisition Fee | $1,005,000 |
Financing and Other Closing Costs | $1,285,992 |
Selling Commissions | $1,364,510 |
Dealer Fee | $284,273 |
Placement Agent Fee | $318,386 |
Organizational & Offering Expenses | $136,451 |
Lender Controlled Reserves | $108,000 |
Trust Controlled Reserves | $400,000 |
Acquisition Closing Costs | $251,222 |
Total Uses of Funds | $55,403,834 |
The Property has existing debt:
- Loan Origination Date: 12/13/2017
- Lender: KeyBank Fannie Mae DUS
- Loan Proceeds: $32,662,000
- Loan to Cost: 59.0%
- Interest Rate: 4.21% Fixed
- Amortization: 30-year amortization
- Interest Only: 5-year interest-only
- Recourse: Non-recourse to the Trust, but recourse to the Trust and principals of the Sponsor for certain (i) "bad acts", and (ii) environmental indemnification
- Term: 10 years
- Yield Maintenance: 84 months with a minimum 1% of outstanding loan floor
- Prepayment Penalty: 1% if loan repaid after the expiration of yield maintenance period but before the last calendar day of the fourth month prior to the month in which the loan matures
The Sponsor is to make distributions directly to investors who own a beneficial interest in the DST on a pro-rata basis.
Distributions are expected to start for each investor within 45 days of the completion of that investors purchase of beneficial interest in the DST. Distributions are targeted to continue on a monthly basis thereafter. These distributions are at the discretion of the Sponsor and made directly by the Sponsor, neither Realty Mogul Co. nor any of its affiliates have any control or discretion on the timing or amount of distributions.
Certain fees and compensation will be paid over the life of the transaction. The following fees and compensation will be paid:
Type of Fee | Amount of Fee | Received By | Paid From | Notes |
---|---|---|---|---|
Acquisition Fee | $1,005,000 | Sponsor | Capitalized Equity Contribution | 2.0% of Purchase Price. |
Selling Commission | 6.00% of offering proceeds | Broker Dealers | Capitalized Equity Contribution | Paid to North Capital(1) or other licensed broker-dealers that are Selling Group Members based on the amount of equity capital raised. Surplus fees retained by Sponsor. |
Dealer Fee | 1.25% of offering proceeds | Broker Dealers | Capitalized Equity Contribution | 1.25% based on the amount of equity invested by investors through RealtyMogul.com, third-party Broker Dealers (including North Capital(1)) are entitled to additional fees based on equity they originate. Surplus fees retained by Sponsor. |
Placement Agreement Fee | 1.40% of offering proceeds | Broker Dealers | Capitalized Equity Contribution | Managing Broker-Dealer will receive a fee up to 1.4% of the Total Sales, which it may at its sole discretion partially re-allow to Selling Group Members for non-accountable marketing expenses in addition to any other allowances. |
Organization and Offering Expenses | 0.60% of offering proceeds | Sponsor | Capitalized Equity Contribution | The Sponsor and its affiliates will be entitled to reimbursement for Organization and Offering Expenses, on an accountable basis, estimated at $136,451 or 0.60% of the Offering Amount. |
Disposition Fee | 3.50% | Sponsor | Sale Proceeds | 3.5% of Sales Price |
Type of Fee | Amount of Fee | Received By | Paid From | Notes |
---|---|---|---|---|
Asset Management Fee | 0.20% of Purchase Price | Manager | Operating Cash Flow | |
Property Management Fee | 2.5% of Effective Gross Income | Property Manager | Operating Cash Flow | GREP Southeast, LLC ("GREP"), an unaffiliated party, will perform the property management on the Property. GREP is an affiliate of Greystar Real Estate Partners |
Master Lease Operating Profit | N/A | Master Lessee | Operating Cash Flow | The Master Lessee will retain net operating revenues from the Property that exceed the total rent payable to the Trust under the Master Lease. |
Notes:
(1) Certain employees of Realty Mogul, Co. are registered representatives of, and are paid commissions by, North Capital Private Securities Corp., a Delaware corporation ("North Capital"). In addition, North Capital pays a technology provider services fee to Realty Mogul, Co. for licensing and access to certain technology, reporting, communications, branding, entity formation and administrative services performed from time to time by Realty Mogul, Co., and North Capital and Realty Mogul, Co. are parties to a profit sharing arrangement.
The above presentation is based upon information supplied by the Sponsor or others. Realty Mogul, Co. along with its respective affiliates, officers, directors or representatives (the "RM Parties") hereby advise you that none of them has independently confirmed or verified any of the information contained herein. The RM Parties further make no representations as to the accuracy or completeness of any such information and undertake no obligation now or in the future to update or correct this presentation or any information contained herein.
This content does not constitute an offer to sell or a solicitation of an offer to buy any securities. RealtyMogul.com and North Capital Private Securities are in the process of screening, performing due diligence, and verifying information for the offering. The content is presented to gauge interest only and is subject to change without notice.
RM Securities, LLC, its registered representatives, affiliates, associated persons, and personnel of its affiliates who may also be associated with it, including our associated persons and personnel of our affiliates who are also be associated with RM Securities, LLC (it (“RM Securities,” “we,” “our,” or “us”) will receive fees, expense reimbursements, and other compensation (“Fees”) from the issuer of this investment offering, its sponsor, or an affiliate thereof (“Sponsor”), or otherwise in connection with Sponsor’s offering. The Fees paid to us are in addition to other fees you will pay to Sponsor or in connection with Sponsor’s investment offering. You will pay Fees to Sponsor, either directly or indirectly as an investor in the Sponsor’s offering. Sponsor will use the Fees you pay, as well as funds you invest in the relevant offering, to compensate us. The Fees paid to us will directly or indirectly be borne by you as the investor (typically, but not always, in the form of an expense of the Sponsor’s offering in which you invest) because such Fees will reduce the proceeds available for distribution to you and reduce the amount you earn over time.
For more information on the Fees paid to us, or any other Fees you will pay in connection with Sponsor’s offering, please carefully review the Sponsor’s Investment Documents. Please also carefully review RM Securities’ Form CRS, Regulation Best Interest Disclosures, and Limited Brokerage Services Agreement.
No Approval, Opinion or Representation, or Warranty by RM Securities, LLCSponsor has provided, approved, and is solely responsible in all aspects for the information on this webpage (“Page”), including Sponsor’s offering documentation, which may include without limitation the Private Placement Memorandum, Operating or Limited Partnership Agreement, Subscription Agreement, the Project Summary and all exhibits and other documents attached thereto or referenced therein (collectively, the “Investment Documents”). The Investment Documents linked on this page have been prepared and posted by Sponsor, and not by RM Securities. We did not assist in preparing, do not adopt or endorse, and we are not otherwise responsible for, the Sponsor’s Investment Documents. We make no representations or warranties as to the accuracy of information on this Page or in the Sponsor’s Investment Documents and we accept no liability therefor. No part of the information on this Page or in the Sponsor’s Investment Documents is intended to be binding on us.
Sponsor’s Information Qualified by Investment DocumentsThe information on this Page is qualified in its entirety by reference to the more complete information about the offering contained in the Sponsor’s Investment Documents. The information on this Page is not complete and subject to change at the Sponsor’s discretion at any time up to the closing date. The Sponsor’s Investment Documents and supplements thereto contain important information about the Sponsor’s offering including relevant investment objectives, the business plan, risks, charges, expenses, and other information, which you should consider carefully before investing. The information on this Page should not be used as a basis for an investor’s decision to invest.
Risk of InvestmentThis investment is speculative, highly illiquid, and involves substantial risk. There can be no assurances that all or any of Sponsor’s assumptions, expectations, estimates, goals, hypothetical illustrations, or other aspects of Sponsor’s business plans (“Assumptions”) will be true or that actual performance will bear any relation to Sponsor’s Assumptions, and no guarantee or representation is made that Sponsor’s Assumptions will be achieved. If Sponsor does not achieve its Assumptions, your investment could be materially and adversely affected. A loss of part or all of the principal value of your investment may occur. You should not invest unless you can readily bear the consequences of such loss. Sponsor’s Assumptions should not be relied upon as the primary basis for your decision to invest.
No Reliance on Forward-Looking Statements; Sponsor AssumptionsSponsor is solely responsible for statements made concerning forward-looking statements and Assumptions, which apply only as of the date made, are preliminary and subject to change, and are expressly qualified in their entirety by the disclosures and cautionary statements included in Sponsor’s Investment Documents, which you should carefully review. Neither RM Securities nor Sponsor are obligated to update or revise such forward-looking statements or Assumptions to reflect events or circumstances that arise after the date made or to reflect the occurrence of unanticipated events. Sponsor’s forward-looking statements and Assumptions are hypothetical, not based on actual investment achievements or events, and are presented solely for purposes of providing insight into the Sponsor’s investment objectives, detailing Sponsor’s anticipated risk and reward characteristics, and establishing a benchmark for future evaluation of actual results; therefore, they are not a predictor, projection, or guarantee of future results. You should not rely on Sponsor’s forward-looking statements as a basis to invest.
Importantly, we do not adopt, endorse, or provide any assurance of returns or as to the accuracy or reasonableness of Sponsor’s Assumptions or forward-looking statements.
No Reliance on Past PerformanceAny description of past performance is not a reliable indicator of future performance and should not be relied upon as the primary basis to invest.
Sponsor’s Use of DebtA substantial portion of the total cost of the real estate asset acquired by the Sponsor with investor funds (“Property”) will be paid with borrowed funds, i.e., debt. Sponsor’s estimated rates and terms of the debt financing are subject to lender approval, and there is no assurance that the Sponsor will secure debt at the rates and terms presented on this Page or in the Sponsor’s Investment Documents, or at all. The use of borrowed money to acquire real estate is referred to as leveraging, which can amplify losses and could result in lender foreclosure. In addition, if the debt includes a variable (or “floating”) interest rate, the total amount of interest paid over the term of the debt will fluctuate and can increase. As a result, Sponsor’s use of debt can result in a loss of some or all of your investment.
Sponsor’s Offering is Not RegisteredSponsor’s securities offering will not be registered under the Securities Act of 1933, as amended (the “Securities Act”), in reliance upon the exemptions from registration pursuant to Rule 506(c) of Regulation D as promulgated under the Securities Act (“Private Placement”). In addition, the offering will not be registered under any state securities laws in reliance on exemptions from state registration. Such securities (your ownership interests) are subject to restrictions on transferability and resale and may not be transferred or resold except as permitted under applicable state and federal securities laws pursuant to registration or an available exemption. All Private Placements on the Platform are intended solely for “Accredited Investors,” as that term is defined in Rule 501(a) under the Securities Act.
No Investment AdviceNothing on this Page should be regarded as investment advice (either with respect to a particular security or regarding an overall investment strategy), a recommendation, an offer to sell, or a solicitation of or an offer to buy any security. Advice from a securities professional is strongly advised to understand and assess the risks associated with real estate or private placement investments. For additional information on RM Securities’ involvement in this offering, please carefully review the Sponsor’s Investment Documents, and RM Securities’ Form CRS, Regulation Best Interest Disclosures, and Limited Brokerage Services Agreement.
1031 Exchange RiskInternal Revenue Code Section 1031 (“Section 1031”) contains complex tax concepts and certain tax consequences may vary depending on the individual circumstances of each investor. RM Securities and its affiliates make no representation or warranty of any kind with respect to the tax consequences of your investment or that the IRS will not challenge any such treatment. You should consult with and rely on your own tax advisor about the tax aspects with respect to your particular circumstances.