


Orion Real Estate Partners is a private real estate investment firm with offices in Los Angeles, Austin, and Denver. Orion targets value-add multifamily assets in select Western US markets with strong demographics and job growth. Utilizing proven institutional processes to source and manage investments, they identify assets with capital and operational repositioning opportunities to provide attractive returns for their investors.
Built in 1973, the Property is a 199 unit garden style multifamily property consisting of 149,314 square feet across 26 two-story buildings on a 7.13 acre site. The Property has 351 total parking spaces for a parking ratio of 1.8 parking spaces per unit. The Property offers ten different floorplans across one, two and three bedroom units. The multifamily unit mix is comprised of 106 one-bedroom units, 92 two-bedroom units and one three-bedroom unit, with a weighted average size and average in-place rent per unit of 750 square feet and $856 per unit ($1.14 per square foot), respectively. The Property was 95.5% occupied as of October 31, 2017.
The Property features wood-frame construction on concrete slab foundations, with flat roofing and brick and stucco siding, with ceramic flooring throughout most of the Property. Public amenities at the Property include a pool, coin-operated laundry machines, a childrens' playground, and a recently renovated on-site leasing office.
| Unit Type | # of Units | Unit Square Feet | Total Square Feet | Rent per Unit | Rent per Square Foot |
|---|---|---|---|---|---|
| One Bedroom | 106 | 601 | 63,752 | $684 | $1.14 |
| Two Bedroom | 92 | 919 | 84,504 | $1,049 | $1.14 |
| Three Bedroom | 1 | 1,050 | 1,050 | $1,268 | $1.21 |
| Total | 199 | 750 | 149,306 | $856 | $1.14 |
| Property | Sale Date | # of Units | Year Built | Purchase Price | $ per Unit | Cap Rate |
|---|---|---|---|---|---|---|
| Promotory Point | January 2017 | 228 | 1983 | $19,200,000 | $84,211 | 5.50% |
| The Legacy | December 2016 | 192 | 1984 | $23,100,000 | $120,313 | 5.80% |
| Austin 3 Portfolio | June 2016 | 84 | 1961-1972 | $11,000,000 | $130,952 | 5.40% |
| Westheimer Oaks | December 2016 | 70 | 1972 | $4,850,000 | $69,286 | 6.10% |
| Pecan Grove | December 2016 | 192 | 1984 | $23,100,000 | $120,313 | 5.80% |
| Average | October 2016 | 153 | 1981 | $16,250,000 | $105,015 | 5.72% |
| Subject | December 2017 | 199 | 1973 | $16,100,000 | $80,905 | 5.60% |
Above sales comps are per Axiometrics.com. Subject acquisition cap rate is based on Year One Estimated Financials net operating income adjusted for Year Two fully realized tax increase.
| Property | Year Built | Avg. Sq. Ft. / Unit (1 bed) | Avg. Rent / Sq. Ft. (1 bed) | Avg. Rental / Sq. Ft. (1 bed) | Avg. Sq. Ft. / Unit (2 bed) | Avg. Rent / Unit (2 bed) | Avg. Rent / Sq. Ft. (2 bed) |
|---|---|---|---|---|---|---|---|
| Mezzo Flats | 1971 | 780 | $900 | $1.15 | 931 | $1,175 | $1.26 |
| Redondo Flats | 1983 | 376 | $845 | $2.25 | 753 | $1,10 | $1.46 |
| Val Dor Flats | 1971 | 630 | $908 | $1.44 | 798 | $1,025 | $1.28 |
| Ibra Urban Flats | 1973 | 695 | $899 | $1.29 | 931 | $1,075 | $1.15 |
| Averages | 1975 | 620 | $888 | $1.53 | 853 | $1,094 | $1.29 |
| Subject - In-Place | 1973 | 601 | $684 | $1.14 | 919 | $1,049 | $1.14 |
| Subject - Expected Post-Renovation | 1973 | 601 | $890 | $1.48 | 919 | $1,151 | $1.25 |
Above leasing comparables were self-reported by the respective leasing agents of the competitive properties.
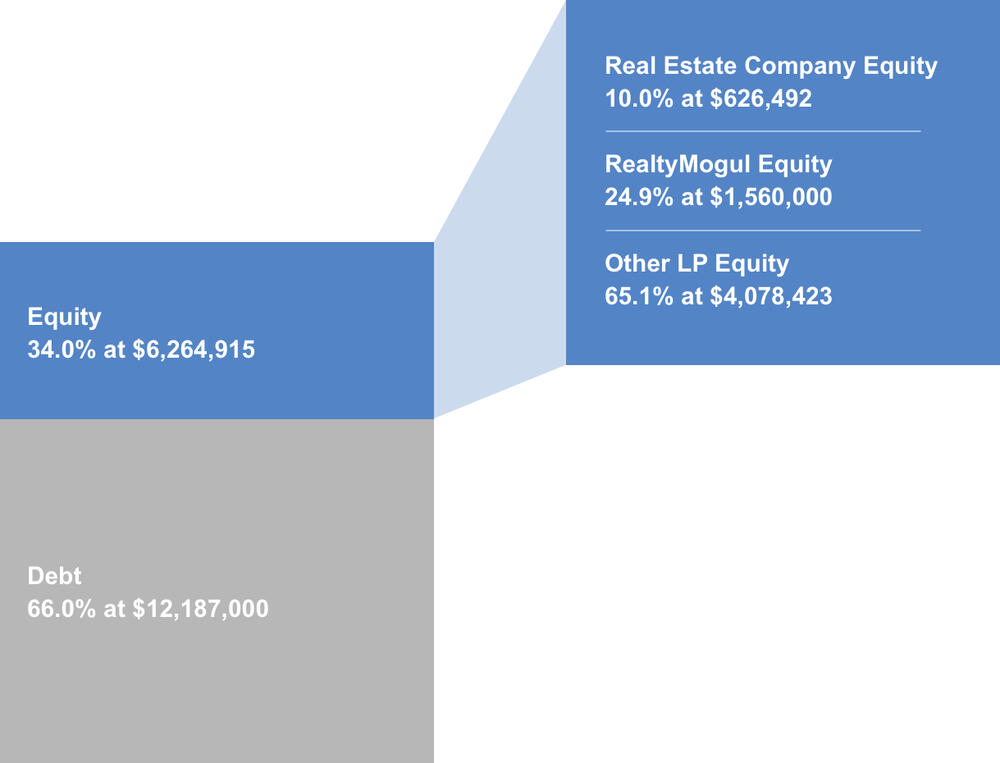
| Sources of Funds | Cost |
|---|---|
| Debt | $12,187,000 |
| Equity | $6,264,915 |
| Total Sources of Funds | $18,451,915 |
| Uses of Funds | Cost |
| Purchase Price | $16,100,000 |
| CapEx Reserve | $1,865,669 |
| Sponsor Acquisition Fee | $161,000 |
| Sponsor Legal & DD Costs | $115,350 |
| North Capital Broker Dealer Fee | $62,400 |
| Lender Origination Fee | $97,496 |
| Working Capital | $50,000 |
| Total Uses of Funds | $18,451,915 |
The projected terms of the debt financing are as follows:
- Lender: CBRE (as a Fannie Mae DUS Lender)
- Estimated Proceeds: $12,187,000
- Estimated Rate: 1.76% + US 10-Year Treasury (4.10% all-in as of December 7, 2017)
- Amortization: 30 years, with two years of interest-only
- Term: 10 years
- Prepayment Penalty: During the first 114 months of the loan, the greater of (i) yield maintenance or (ii) 1.0% of total loan proceeds. From Months 114 - 121 of the loan the prepayment penalty shall be 1.0%. Thereafter, the loan may be paid off at par.
There can be no assurance that a lender will provide debt on the rates and terms noted above, or at all. All rates and terms of the debt financing are subject to lender approval, including but not limited to possible increases in capital reserve requirements for funds to be held in a lender controlled capital reserve account.
The Target intends to make distributions of operating cash flows to investors (The Company, Other LP investors and the Real Estate Company, collectively, the "Members") as follows:
Operating Income, Refinance, and Sales Proceeds
- To the Members, pari passu, all excess operating cash flows to an 8.0% IRR to the Members,
- 80.0% / 20.0% (80.0% pro rata to the Members / 20.0% to the Real Estate Company) of excess operating cash flows to a 14.0% IRR,
- 65.0% / 35.0% thereafter.
Note that these distributions will occur after the payment of the Company's liabilities (loan payments, operating expenses and other fees as set forth in the LLC agreement, in addition to any member loans or returns due on member loans).
The Company will distribute 100% of its share of excess cash flow (after expenses and fees) to the members of The Company (the RealtyMogul.com investors). The Manager of The Company will receive a portion (up to 10%) of The Real Estate Company's promote.
Distributions are expected to start in June 2018 and are expected to continue on a quarterly basis thereafter. These distributions are at the discretion of the The Real Estate Company, who may decide to delay distributions for any reason, including maintenance or capital reserves.
| Year 1 | Year 2 | Year 3 | Year 4 | Year 5 | |
|---|---|---|---|---|---|
| Effective Gross Revenue | $2,289,381 | $2,509,484 | $2,626,722 | $2,759,910 | $2,849,438 |
| Total Operating Expenses | $1,333,565 | $1,426,038 | $1,461,382 | $1,498,130 | $1,533,917 |
| Net Operating Income | $955,816 | $1,083,446 | $1,165,340 | $1,261,780 | $1,315,521 |
| Year 0 | 2019 | 2020 | 2021 | 2022 | 2023 | |
|---|---|---|---|---|---|---|
| Distributions to Realty Mogul 103, LLC Investors |
($1,580,000) | $88,062 | $119,294 | $87,716 | $111,398 | $2,640,160 |
| Net Earnings to Investor - Hypothetical $50,000 Investment |
($50,000) | $2,787 | $3,775 | $2,776 | $3,525 | $83,549 |
Certain fees and compensation will be paid over the life of the transaction. The following fees and compensation will be paid:
| Type of Fee | Amount of Fee | Received By | Paid From | Notes |
| One-Time Fees: | ||||
|---|---|---|---|---|
| Acquisition Fee | $161,000 | The Real Estate Company | Capitalized Equity Contribution | 1.0% of Property purchase price |
| Broker-Dealer Fee | $62,400 | North Capital (1) | Capitalized Equity Contribution | 4.0% based on the amount of equity invested by The Company |
| Recurring Fees: | ||||
| Asset Management Fee | 1.0% of effective gross revenues | The Real Estate Company | Operating Cash Flow | |
| Construction Management Fee | 4.0% of total costs | The Real Estate Company | Capitalized Equity Contribution | |
| Management and Administrative Fee | 1.0% of amount invested in The Company | RM Manager, LLC | Distributable Cash | RM Manager, LLC is the Manager of The Company and a wholly-owned subsidiary of Realty Mogul, Co. (2) |
Notes:
(1) Certain employees of Realty Mogul, Co. are registered representatives of, and are paid commissions by, North Capital Private Securities Corp., a Delaware corporation ("North Capital"). In addition, North Capital pays a technology provider services fee to Realty Mogul, Co. for licensing and access to certain technology, reporting, communications, branding, entity formation and administrative services performed from time to time by Realty Mogul, Co., and North Capital and Realty Mogul, Co. are parties to a profit sharing arrangement.
(2) Fees may be deferred to reduce impact to investor distributions
The above presentation is based upon information supplied by the Sponsor or others. Realty Mogul, Co., RM Manager, LLC, and The Company, along with their respective affiliates, officers, directors or representatives (the "RM Parties") hereby advise you that none of them has independently confirmed or verified any of the information contained herein. The RM Parties further make no representations as to the accuracy or completeness of any such information and undertake no obligation now or in the future to update or correct this presentation or any information contained herein.
The information on this Page is qualified in its entirety by reference to the more complete information about the offering contained in the Sponsor’s Investment Documents. The information on this Page is not complete and subject to change at the Sponsor’s discretion at any time up to the closing date. The Sponsor’s Investment Documents and supplements thereto contain important information about the Sponsor’s offering including relevant investment objectives, the business plan, risks, charges, expenses, and other information, which you should consider carefully before investing. The information on this Page should not be used as a basis for an investor’s decision to invest.
Risk of InvestmentThis investment is speculative, highly illiquid, and involves substantial risk. There can be no assurances that all or any of Sponsor’s assumptions, expectations, estimates, goals, hypothetical illustrations, or other aspects of Sponsor’s business plans (“Assumptions”) will be true or that actual performance will bear any relation to Sponsor’s Assumptions, and no guarantee or representation is made that Sponsor’s Assumptions will be achieved. If Sponsor does not achieve its Assumptions, your investment could be materially and adversely affected. A loss of part or all of the principal value of your investment may occur. You should not invest unless you can readily bear the consequences of such loss. Sponsor’s Assumptions should not be relied upon as the primary basis for your decision to invest.
No Reliance on Forward-Looking Statements; Sponsor AssumptionsSponsor is solely responsible for statements made concerning forward-looking statements and Assumptions, which apply only as of the date made, are preliminary and subject to change, and are expressly qualified in their entirety by the disclosures and cautionary statements included in Sponsor’s Investment Documents, which you should carefully review. Sponsor is obligated to update or revise such forward-looking statements or Assumptions to reflect events or circumstances that arise after the date made or to reflect the occurrence of unanticipated events. Sponsor’s forward-looking statements and Assumptions are hypothetical, not based on actual investment achievements or events, and are presented solely for purposes of providing insight into the Sponsor’s investment objectives, detailing Sponsor’s anticipated risk and reward characteristics, and establishing a benchmark for future evaluation of actual results; therefore, they are not a predictor, projection, or guarantee of future results. You should not rely on Sponsor’s forward-looking statements as a basis to invest.
Importantly, we do not adopt, endorse, or provide any assurance of returns or as to the accuracy or reasonableness of Sponsor’s Assumptions or forward-looking statements.
No Reliance on Past PerformanceAny description of past performance is not a reliable indicator of future performance and should not be relied upon as the primary basis to invest.
Sponsor’s Use of DebtA substantial portion of the total cost of the real estate asset acquired by the Sponsor with investor funds (“Property”) will be paid with borrowed funds, i.e., debt. Sponsor’s estimated rates and terms of the debt financing are subject to lender approval, and there is no assurance that the Sponsor will secure debt at the rates and terms presented on this Page or in the Sponsor’s Investment Documents, or at all. The use of borrowed money to acquire real estate is referred to as leveraging, which can amplify losses and could result in lender foreclosure. In addition, if the debt includes a variable (or “floating”) interest rate, the total amount of interest paid over the term of the debt will fluctuate and can increase. As a result, Sponsor’s use of debt can result in a loss of some or all of your investment.
Sponsor’s Offering is Not RegisteredSponsor’s securities offering will not be registered under the Securities Act of 1933, as amended (the “Securities Act”), in reliance upon the exemptions from registration pursuant to Rule 506(c) of Regulation D as promulgated under the Securities Act (“Private Placement”). In addition, the offering will not be registered under any state securities laws in reliance on exemptions from state registration. Such securities (your ownership interests) are subject to restrictions on transferability and resale and may not be transferred or resold except as permitted under applicable state and federal securities laws pursuant to registration or an available exemption. All Private Placements on the Platform are intended solely for “Accredited Investors,” as that term is defined in Rule 501(a) under the Securities Act.
No Investment AdviceNothing on this Page should be regarded as investment advice (either with respect to a particular security or regarding an overall investment strategy), a recommendation, an offer to sell, or a solicitation of or an offer to buy any security. Advice from a securities professional is strongly advised to understand and assess the risks associated with real estate or private placement investments.
1031 Exchange RiskInternal Revenue Code Section 1031 (“Section 1031”) contains complex tax concepts and certain tax consequences may vary depending on the individual circumstances of each investor. You should consult with and rely on your own tax advisor about the tax aspects with respect to your particular circumstances.