


Inception Investors is a private real estate investment and operating company that was founded in 2012. The company is headquartered in New York City and has offices in Brooklyn and Manhattan.
The Sponsor’s investment strategy is to acquire properties with attractive growth potential through a combination of active property and asset management and market growth. They generally target cash flowing Class-B multifamily properties and give key consideration to the following criteria:
- Gentrifying Tri-state area markets with high population density and strong market fundamentals.
- Capitalize on shifts in demographic trends and property investments that include an increased preference for urban living by baby boomers, millennials, and young professionals as well as assets that are in close proximity to transit or places of employment.
RealtyMogul.com has invested in three prior transactions with The Real Estate Company (New Jersey Multifamily, Brooklyn Multifamily and 497 Dean Street). As of Q2 2017, NOI over the previous year at New Jersey Multifamily is trending at 44.5% above proforma. At Brooklyn Multifamily, the Real Estate Company has completed five unit buyouts and renovations since the purchase of the property in July 2016, outperforming underwritten expectation of three unit buyouts and renovations during this timeframe. Renovated units are achieving a 57.6% increase in rents vs. previously in-place rent, which is greater than the 36.0% increase contemplated in the RM Estimated Financials for that property. 497 Dean Street was closed on in August 2017 and while no distribution was underwritten until March 2018 The Real Estate Company distributed to Realty Mogul in November 2017, approximately a quarter ahead of schedule.
The Real Estate Company's Track Record (includes transactions the management team completed as Principals of other firms prior to joining Clairmont and Inception Investors)
Built between 1920 and 1935, the Portfolio consists of 112 multifamily units, comprising 99,680 rentable square feet, across seven separate properties located in various neighborhoods of Brooklyn, New York. The unit mix is comprised of 30 one-bedroom, 57 two-bedroom, and 25 three-bedroom apartments with a weighted average size and rent per unit of 895 square feet and $1,488 per unit ($1.67 per square foot), respectively (per the 09.25.2017 rent roll). The Portfolio was 99.1% occupied as of 9.25.17. The Portfolio has no parking, but this is consistent with older, walk-up, low-rise properties in the Brooklyn market.
| Property | 2015 Acquisition Price | # of Units | Unit (Square Feet) | Total Square Feet | Rent per Unit | Rent per Square Foot |
|---|---|---|---|---|---|---|
| 226 Pulaski Street | $3,500,000 | 12 | 875 | 10,500 | $1,606 | $1.84 |
| 642 Wilson Avenue | $2,700,000 | 6 | 813 | 4,875 | $2,270 | $2.79 |
| 1226 Lincoln Place | $7,600,000 | 31 | 924 | 28,647 | $1,587 | $1.72 |
| 1639 Carroll Street | $3,000,000 | 17 | 728 | 12,376 | $1,111 | $1.53 |
| 3013-3019 Newkirk Avenue | $4,700,000 | 18 | 1,075 | 19,350 | $1,686 | $1.57 |
| 83-85 East 94th Street | $2,400,000 | 16 | 698 | 11,175 | $1,154 | $1.32 |
| 436 East 34th Street | $2,400,000 | 12 | 875 | 10,500 | $1,408 | $1.61 |
| Totals/Averages | $26,300,000 | 112 | 870 | 97,416 | $1,488 | $1.67 |
The Portfolio is comprised of seven properties in three distinct submarkets within Brooklyn, New York, as follows:
- 222-266 Pulaski Street - Bedford-Stuyvesant/Bushwick
- 642 Wilson Avenue - Bedford-Stuyvesant/Bushwick
- 1226 Lincoln Place - Crown Heights
- 1639 Carroll Street - Crown Heights
- 3013-3019 Newkirk Avenue - Ditmas Park/Flatbush
- 83-85 East 94th Street - Ditmas Park/Flatbush
- 436 East 34th Street - Ditmas Park/Flatbush
A summary of lease and sales comparables for each of these submarkets may be found below.
Bedford-Stuyvesant/Bushwick
| Lease Comparables | 729 Lafayette Ave | 1342 Hancock St | 1334 Hancock St | 1500 Bushwick Ave | 638 Wilson Ave | Total / Averages |
222-226 Pulaski St (Subject) |
642 Wilson Ave (Subject) |
|---|---|---|---|---|---|---|---|---|
| Occupancy | 100% | 100% | 100% | 100% | 100% | 100% | 100% | 100% |
| Units (#) | 17 | 5 | 5 | 12 | 6 | 9 | 12 | 6 |
| Year Built | 1931 | 1906 | 1906 | 1906 | 1906 | 1911 | 1931 | 1931 |
| Average SF (per unit) | 1,210 | 732 | 732 | 750 | 750 | 835 | 700 |
750 |
| Average Rental Rate (unit) | $3,214 | $1,031 | $985 | $1,813 | $1,251 | $1,658 | $1,755 |
$2,118 |
| Average $/SF | $2.66 | $1.41 | $1.35 | $2.42 | $1.67 | $1.90 | $2.51 |
$2.82 |
| Distance from Subject | 0.2 mi | 0.4 mi | 0.4 mi | 0.4 mi | 0.1 mi | 0.3 mi | - | - |
| Sale Comparables | 17-21 Woodbine St | 255 Himrod St | 96 Malcolm X Blvd | 888 Flushing Ave | 317 Putnam Ave | Total / Averages | 222-226 Pulaski St (Subject) |
642 Wilson Ave (Subject) |
|---|---|---|---|---|---|---|---|---|
| Date | April - 15 | January - 15 | January - 15 | June - 14 | March - 15 | |||
| # of Units | 6 | 6 | 8 | 8 | 6 | 7 | 12 | 6 |
| Year Built | 1930 | 1931 | 1931 | 1931 | 1931 | 1931 | 1931 | 1931 |
| Average SF (per Unit) | 812 | 750 | 793 | 875 | 1,066 | 852 | 700 | 750 |
| Purchase Price | $2,750,000 | $1,950,000 | $2,1665,000 | $2,720,000 | $3,350,000 | $2,587,000 | $3,500,000 | $2,700,000 |
| $/Unit | $458,333 | $325,000 | $270,625 | $340,000 | $558,333 | $390,458 | $291,667 | $450,000 |
| Cap Rate | - | - | - | 5.49% | 5.28% | 5.39% | - | - |
| Distance | 1.2 mi | 1.3 mi | 1.7 mi | 2.0 mi | 1.0 mi | 1.4 mi | - | - |
Lease and Sale Comparable information compiled per CoStar and RCAnalytics.
Crown Heights
| Lease Comparables | 1500 Carroll St | 1178 Eastern Pky | 1505 Saint Johns Pl | 1081 Eastern Pky | 1710 Union St | Total / Averages | 1226 Lincoln Place (Subject) |
1639 Carroll Street (Subject) |
|---|---|---|---|---|---|---|---|---|
| Occupancy | 94% | 96% | 100% | 94% | 100% | 97% | 97% | 100% |
| Units (#) | 35 | 24 | 20 | 16 | 31 | 25 | 31 | 17 |
| Year Built | 1935 | 1922 | 1915 | 1912 | 1922 | 1921 | 1923 | 1920 |
| Average SF (per unit) | 812 | 788 | 793 | 925 | 648 | 793 | 924 | 728 |
| Average Rental Rate (unit) | $1,684 | $1,834 | $2,305 | $2,131 | $1,339 | $1,859 | $1,435 | $1,140 |
| Average $/SF | $2.07 | $2.33 | $2.91 | $2.30 | $2.07 | $2.34 | $1.55 | $1.57 |
| Distance from Subject | 0.3 mi | 0.2 mi | 0.4 mi | 0.2 mi | 0.1 mi | 0.2 mi | - | - |
| Sale Comparables | 412 East 51st St | 1153 President St | 15-21 Crooke Ave | 1068 Winthrop St | 216 Macon St | Total / Averages | 1226 Lincoln Place (Subject) | 1639 Carroll Street (Subject) |
|---|---|---|---|---|---|---|---|---|
| Date | May - 15 | March - 15 | March - 15 | February - 15 | November - 14 | |||
| # of Units | 31 | 41 | 54 | 42 | 17 | 37 | 31 | 17 |
| Year Built | 1928 | 1915 | 1938 | 1929 | 1900 | 1921 | 1923 | 1920 |
| Average SF (per Unit) | 612 | 1,034 | 980 | 727 | 934 | 869 | 924 | 728 |
| Purchase Price | $4,125,000 | $13,100,000 | $14,250,000 | $6,800,000 | $4775,000 | $8,610,000 | $7,600,000 | $3,000,000 |
| $/Unit | $133,065 | $319,512 | $263,889 | $161,905 | $280,882 | $231,851 | $245,161 | $176,471 |
| Cap Rate | - | 4.50% | 3.75% | - | 4.30% | 4.18% | - | - |
| Distance | 1.5 mi | 1.0 mi | 2.6 mi | 1.1 mi | 1.1 mi | 1.5 mi | - | - |
Lease and Sale Comparable information compiled per CoStar and RCAnalytics.
Ditmas Park/Flatbush
| Lease Comparables | 238 East 26th St | 1335 Eastern Pky | 584 East 29th St | 2022 Nostrand Ave | 1178 Eastern Pky | Total / Averages | 3013-3019 Newkirk Ave (Subject) | 83-85 East 94th St (Subject) | 436 East 34th St (Subject) |
|---|---|---|---|---|---|---|---|---|---|
| Occupancy | 100% | 97% | 96% | 73% | 96% | 92% | 83% | 88% |
100% |
| Units (#) | 24 | 30 | 23 | 11 | 24 | 22 | 18 | 16 | 12 |
| Year Built | 1925 | 1922 | 1931 | 1933 | 1922 | 1927 | 1935 | 1930 | 1931 |
| Average SF (per unit) | 875 | 770 | 1,000 | 911 | 788 | 869 | 1,075 | 875 | 875 |
| Average Rental Rate (unit) | $1,612 | $1,646 | $1,195 | $2,941 | $1,838 | $1,846 | $1,686 | $1,154 | $1,408 |
| Average $/SF | $1.84 | $2.14 | $1.20 | $3.23 | $2.33 | $2.15 | $1.57 | $1.32 | $1.61 |
| Distance from Subject | 0.4 mi | 0.4 mi | 0.3 mi | 0.3 mi | 0.4 mi | 0.4 mi | - | - | - |
| Sale Comparables | 146 Fenimore St | 1103 Carroll St | 15-21 Crooke Ave | 147 Ocean Ave | 990 President St | Total / Averages | 3013-3019 Newkirk Ave (Subject) | 83-85 East 94th St (Subject) | 436 East 34th St (Subject) |
|---|---|---|---|---|---|---|---|---|---|
| Date | July - 14 | November - 14 | March - 15 | September - 14 | March - 15 | ||||
| # of Units | 17 | 8 | 54 | 21 | 54 | 31 | 16 | 18 | 12 |
| Year Built | 1926 | 1912 | 1938 | 1927 | 1938 | 1928 | 1930 | 1935 | 1931 |
| Average SF (per Unit) | 944 | 1,400 | 833 | 846 | 880 | 981 | 1,075 | 875 | 875 |
| Purchase Price | $3,400,000 | $2,750,000 | $14,250,000 | $4,775,000 | $11,500,000 | $7,335,000 | $4,700,000 | $2,400,000 | $2,400,000 |
| $/Unit | $200,000 | $343,750 | $263,889 | $227,381 | $212,963 | $249,597 | $261,111 | $150,000 | $200,000 |
| Cap Rate | 4.96% | 4.50% | 3.75% | 3.60% | 5.00% | 4.36% | - | - | - |
| Distance | 1.5 mi | 1.5 mi | 1.5 mi | 1.8 mi | 1.9 mi | 1.6 mi | - | - | - |
Lease and Sale Comparable information compiled per CoStar and RCAnalytics.
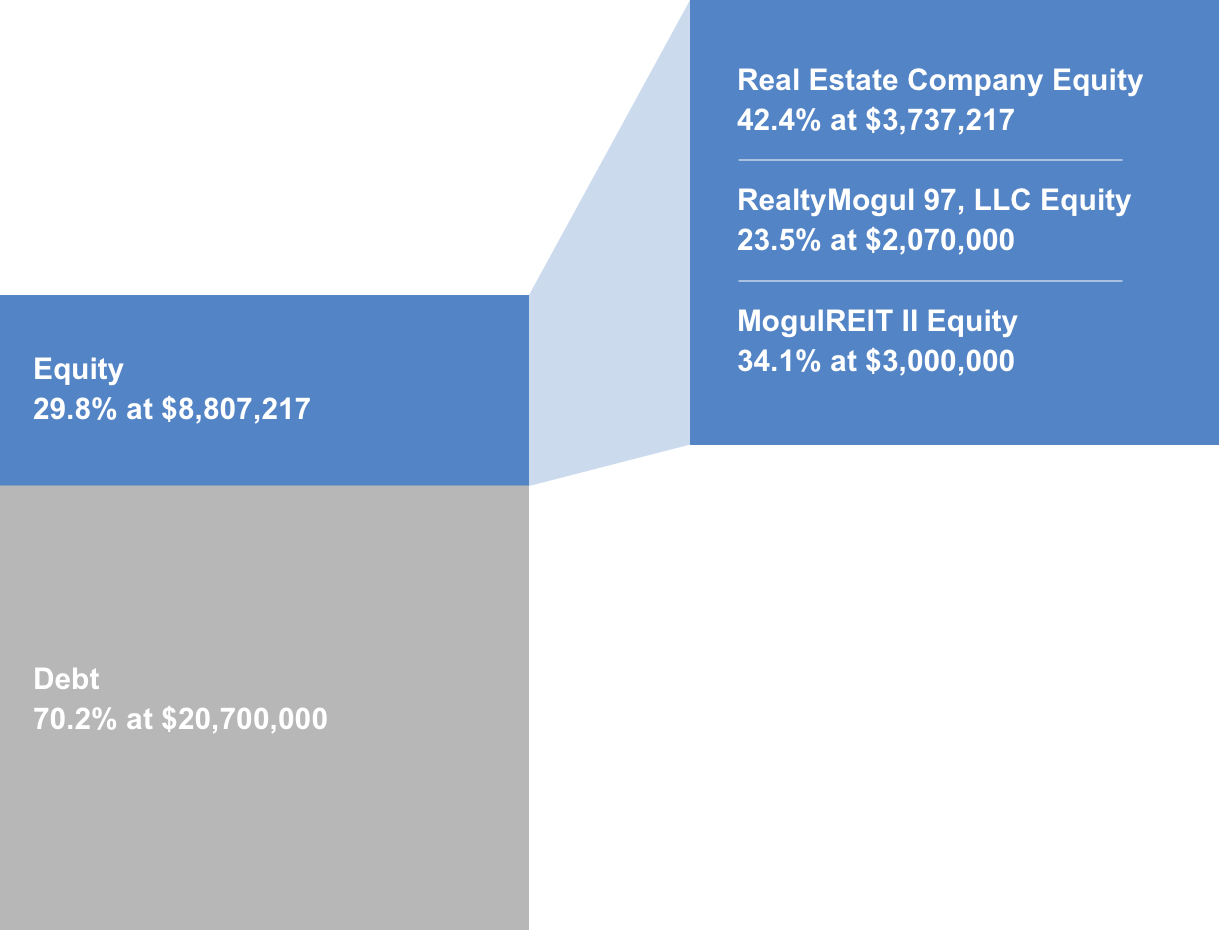
| Sources of Funds | Cost |
|---|---|
| Debt | $20,700,000 |
| Equity | $8,807,217 |
| Total Sources of Funds | $29,507,217 |
| Uses of Funds | Cost |
| Purchase Price | $26,300,000 |
| Buyout & Unit Renovation Reserve | $952,846 |
| MogulREIT II Acquisition Fee | $143,993 |
| North Capital Broker Dealer Fee | $99,360 |
| Existing Preferred Equity Accrued Payoff | $411,301 |
| Real Estate Company Initial Closing Costs and Reserves | $1,549,717 |
| Fresh Working Capital | $50,000 |
| Total Uses of Funds | $29,507,217 |
The general terms of the debt financing are as follows:
- Lender: New York Community Bank
- Loan Origination Date: August 2015
- Initial Proceeds: $20,700,000
- Rate: 3.00% Fixed (see Note below)
- Interest Only Period: Two (2) years
- Amortization: 30 year schedule, commencing at the expiration of the Interest Only Period
- Term: 10 years
- Prepayment Penalty: 2.0% penalty through August 2018, then 1.0% through August 2020, none thereafter.
Note: The senior loan used to acquire the Portfolio was a ten-year loan at fixed 3.0% interest rate during the first five years of the loan term, with a two-year interest only term which started in August 2015, followed by a three-year term at a fixed 3.0% interest rate and an amortization schedule of 30 years. Upon the completion of the first five years of the loan, the interest rate is to increase to the Wall Street Journal Prime Rate (4.25% as of 10.16.17) with a spread of 2.75%. The expectation is that the Portfolio will be sold soon after the change in interest rate event occurs.
The Target will make distributions to investors (The Company and Real Estate Company, collectively, the "Members") as follows:
Operating Cash Flow
- First, to Members for any accumulated unpaid 7% preferred return,
- Second, a cumulative quarterly-compounded 7% annual preferred return,
- Then, any excess balance will be split 75% to Members pari passu and 25% to Sponsor.
Capital Events (sale, refinance)
- First, to Members for any accumulated unpaid 7% preferred return,
- Second, return of capital,
- Then, any excess balance will be split 75% to Members pari passu and 25% to Sponsor to an 18% IRR Hurdle,
- Then, any excess balance will be split 55% to members pari passu and 45% to Sponsor.
Note that these distributions will occur after the payment of the Company's liabilities (loan payments, operating expenses and other fees as set forth in the LLC agreement, in addition to any member loans or returns due on member loans).
The Company will distribute 100% of its share of excess cash flow (after expenses) to the members of The Company (the RealtyMogul.com investors). The manager of The Company will receive a portion (up to 10% pro-rata) of the Real Estate Company's promote interest. Distributions are projected to start in June 2018 and are projected to continue on a quarterly basis thereafter. These distributions are at the discretion of the Real Estate Company, who may decide to delay distributions for any reason, including maintenance or capital reserves.
| Year 1 | Year 2 | Year 3 | |
|---|---|---|---|
| Effective Gross Revenue | $2,106,430 | $2,276,122 | $2,361,070 |
| Total Operating Expenses | $636,009 | $654,935 | $670,735 |
| Net Operating Income | $1,470,421 | $1,621,197 | $1,690,335 |
| Year 0 | 2017 | 2018 | 2019 | 2020 | |
|---|---|---|---|---|---|
| Distributions to Realty Mogul 97, LLC Investors |
($2,095,000) | $0 | $72,131 | $102,295 | $3,151,371 |
| Net Earnings to Investor - Hypothetical $50,000 Investment |
($50,000) | $0 | $1,722 | $2,441 | $75,212 |
Certain fees and compensation will be paid over the life of the transaction. The following fees and compensation will be paid:
| Type of Fee | Amount of Fee | Received By | Paid From | Notes |
|---|---|---|---|---|
| Acquisition Fee | $143,993 | RM Advisor, LLC | Capitalized Equity Contribution | 0.5475% of the Property purchase price. RM Advisor, LLC is the Manager of MogulREIT II and a wholly-owned subsidiary of Realty Mogul, Co. |
| Disposition Fee | 0.5475% of Gross Sale Proceeds | RM Advisor, LLC | Distributable Cash | RM Advisor, LLC is the Manager of MogulREIT II and a wholly-owned subsidiary of Realty Mogul, Co. |
| Broker-Dealer Fee | $99,360 | North Capital (1) | Capitalized Equity Contribution | 4.8% based on the amount of equity invested by Realty Mogul 97, LLC. |
| Construction Management Fee | 10.0% of total costs | Real Estate Company | Capitalized Equity Contribution |
| Type of Fee | Amount of Fee | Received By | Paid From | Notes |
|---|---|---|---|---|
| Property Management Fee | 4.0% of effective gross revenues | EPP Management, LLC, a third party property management firm | Operating Cash Flow | |
| Asset Management Fee | $20,000 annually | Real Estate Company | Operating Cash Flow | Paid on a monthly basis. |
| Management and Administrative Fee | 1.25% of amount invested in Realty Mogul 97, LLC | RM Manager, LLC | Distributable Cash | RM Manager, LLC is the Manager of Realty Mogul 97, LLC and a wholly-owned subsidiary of Realty Mogul, Co. (2) |
(1) Certain employees of Realty Mogul, Co. are registered representatives of, and are paid commissions by, North Capital Private Securities Corp., a Delaware corporation ("North Capital"). In addition, North Capital pays a technology provider services fee to Realty Mogul, Co. for licensing and access to certain technology, reporting, communications, branding, entity formation and administrative services performed from time to time by Realty Mogul, Co., and North Capital and Realty Mogul, Co. are parties to a profit sharing arrangement.
(2) Fees may be deferred to reduce impact to investor distributions.
The above presentation is based upon information supplied by the Real Estate Company or others. Realty Mogul, Co., RM Manager, LLC, and The Company, along with their respective affiliates, officers, directors or representatives (the "RM Parties") hereby advise you that none of them has independently confirmed or verified any of the information contained herein. The RM Parties further make no representations as to the accuracy or completeness of any such information and undertake no obligation now or in the future to update or correct this presentation or any information contained herein.
The information on this Page is qualified in its entirety by reference to the more complete information about the offering contained in the Sponsor’s Investment Documents. The information on this Page is not complete and subject to change at the Sponsor’s discretion at any time up to the closing date. The Sponsor’s Investment Documents and supplements thereto contain important information about the Sponsor’s offering including relevant investment objectives, the business plan, risks, charges, expenses, and other information, which you should consider carefully before investing. The information on this Page should not be used as a basis for an investor’s decision to invest.
Risk of InvestmentThis investment is speculative, highly illiquid, and involves substantial risk. There can be no assurances that all or any of Sponsor’s assumptions, expectations, estimates, goals, hypothetical illustrations, or other aspects of Sponsor’s business plans (“Assumptions”) will be true or that actual performance will bear any relation to Sponsor’s Assumptions, and no guarantee or representation is made that Sponsor’s Assumptions will be achieved. If Sponsor does not achieve its Assumptions, your investment could be materially and adversely affected. A loss of part or all of the principal value of your investment may occur. You should not invest unless you can readily bear the consequences of such loss. Sponsor’s Assumptions should not be relied upon as the primary basis for your decision to invest.
No Reliance on Forward-Looking Statements; Sponsor AssumptionsSponsor is solely responsible for statements made concerning forward-looking statements and Assumptions, which apply only as of the date made, are preliminary and subject to change, and are expressly qualified in their entirety by the disclosures and cautionary statements included in Sponsor’s Investment Documents, which you should carefully review. Sponsor is obligated to update or revise such forward-looking statements or Assumptions to reflect events or circumstances that arise after the date made or to reflect the occurrence of unanticipated events. Sponsor’s forward-looking statements and Assumptions are hypothetical, not based on actual investment achievements or events, and are presented solely for purposes of providing insight into the Sponsor’s investment objectives, detailing Sponsor’s anticipated risk and reward characteristics, and establishing a benchmark for future evaluation of actual results; therefore, they are not a predictor, projection, or guarantee of future results. You should not rely on Sponsor’s forward-looking statements as a basis to invest.
Importantly, we do not adopt, endorse, or provide any assurance of returns or as to the accuracy or reasonableness of Sponsor’s Assumptions or forward-looking statements.
No Reliance on Past PerformanceAny description of past performance is not a reliable indicator of future performance and should not be relied upon as the primary basis to invest.
Sponsor’s Use of DebtA substantial portion of the total cost of the real estate asset acquired by the Sponsor with investor funds (“Property”) will be paid with borrowed funds, i.e., debt. Sponsor’s estimated rates and terms of the debt financing are subject to lender approval, and there is no assurance that the Sponsor will secure debt at the rates and terms presented on this Page or in the Sponsor’s Investment Documents, or at all. The use of borrowed money to acquire real estate is referred to as leveraging, which can amplify losses and could result in lender foreclosure. In addition, if the debt includes a variable (or “floating”) interest rate, the total amount of interest paid over the term of the debt will fluctuate and can increase. As a result, Sponsor’s use of debt can result in a loss of some or all of your investment.
Sponsor’s Offering is Not RegisteredSponsor’s securities offering will not be registered under the Securities Act of 1933, as amended (the “Securities Act”), in reliance upon the exemptions from registration pursuant to Rule 506(c) of Regulation D as promulgated under the Securities Act (“Private Placement”). In addition, the offering will not be registered under any state securities laws in reliance on exemptions from state registration. Such securities (your ownership interests) are subject to restrictions on transferability and resale and may not be transferred or resold except as permitted under applicable state and federal securities laws pursuant to registration or an available exemption. All Private Placements on the Platform are intended solely for “Accredited Investors,” as that term is defined in Rule 501(a) under the Securities Act.
No Investment AdviceNothing on this Page should be regarded as investment advice (either with respect to a particular security or regarding an overall investment strategy), a recommendation, an offer to sell, or a solicitation of or an offer to buy any security. Advice from a securities professional is strongly advised to understand and assess the risks associated with real estate or private placement investments.
1031 Exchange RiskInternal Revenue Code Section 1031 (“Section 1031”) contains complex tax concepts and certain tax consequences may vary depending on the individual circumstances of each investor. You should consult with and rely on your own tax advisor about the tax aspects with respect to your particular circumstances.