The team at our affiliated broker-dealer, RM Securities, conducts diligence on of the issuer, including detailed background checks, criminal checks, bad actor checks, and reference checks on sponsors. In addition to screening for any criminal background, we may also turn down sponsors due to poor reference checks, even if the background and criminal checks are satisfactory.
We require unaffiliated sponsors to use an unaffiliated third-party escrow agent.* When an investor makes an investment with such sponsors using the RealtyMogul platform, the investor’s money is transferred directly into a third-party escrow account. All closing conditions in connection with a sponsor’s contingency offering need to be met before the third-party escrow agent will approve releasing investor funds to the issuer or general partner. For example, if an issuer or general partner plans to use funds for a real estate acquisition that does not ultimately transact, the third-party escrow agent will not transfer investor funds to the issuer or general partner, and funds will be returned to investors.
* Unless otherwise disclosed, escrow accounts are not required for some investments that accommodate 1031 investments where the property is already acquired.
Our processes typically includes visiting certain properties (or a subset of properties if it's a fund) to confirm the real estate is what and where the real estate is supposed to be. For certain properties that accommodate 1031 exchange investments, the team will review third-party prepared due diligence reports in lieu of a site visit.
We have formalized processes and checklists for every private placement deal listed on the platform.
ExchangeRight Real Estate
ExchangeRight is committed to providing 1031-exchangeable DST offerings of value-added multifamily properties and net-leased portfolios. Our multifamily platform targets Class B apartments with stable income and value added upside potential. Our multifamily offerings feature strong cash flow, high debt coverage ratios, conservative underwriting, long-term fixed-rate financing, and the potential to enhance return with value-added strategies.
In addition to intentionally structuring offerings with an alignment of interest with investors, the principals of the company have taken a personal investment position in each DST offering that has been brought to market. Each of our DST offerings provides both 1031 and cash investors with pass-through tax deferral advantages.
http://www.exchangeright.com/Offering | Description | Projected Annualized Return | Actual Annualized Return* |
---|---|---|---|
Net-Leased Preferred Equity Fund 1 | Shorter-term fund to acquire and sell net-leased assets for the Sponsor. | Range of 12-20%** | Average Annualized Fund Return of 14% |
Net-Leased Preferred Equity Fund 2 | Shorter-term fund to acquire and sell net-leased assets for the Sponsor. Performing as expected. | Range of 8-12%** | 10% |
Net-Leased Preferred Equity Fund 3 | Shorter-term fund to acquire and sell net-leased assets for the Sponsor. Performing as expected. | 8.25% | 8.25% |
Acquisition Notes | Company that issues short term debt capital to the Sponsor to acquire and sell net-leased assets. Performing as expected. | Range of 12-14%** |
12% |
Acquisitions Notes II | Company that issues short term debt capital to the Sponsor to acquire and sell net-leased assets. Performing as expected. | Range of 8- 12%** |
10% |
Net-Leased Portfolio 1 | Portfolio of two long-term net-leased properties leased to Family Dollar. One of the two properties sold in January, 2015 at a 10.59% annualized net profit to investors. Current remaining property return shown in chart and is exceeding expectations. | 7.25% | 7.39% |
Net-Leased Portfolio 2 | Portfolio of seven long-term net-leased properties leased to Family Dollar (6) and Dollar General (1). Performing as expected. | 7.23% | 7.23% |
Net-Leased Portfolio 3 | Portfolio of nine long-term net-leased properties leased to Family Dollar (8) and Dollar General (1). Performing as expected. | 7.30% | 7.30% |
Net-Leased Portfolio 4 | Portfolio of eleven long-term net-leased properties leased to Family Dollar (8), Dollar General (1), Aaron's (1) and Advance Auto Parts (1). Performing as expected. | 8.02% | 8.02% |
Net-Leased Portfolio 5 | Portfolio of fourteen long-term net- leased properties leased to Family Dollar (5), Dollar General (4), Advance Auto Parts (2), AutoZone (1), Sherwin Williams (1) and The Christ Hospital (1). Performing as expected. | 7.50% | 7.50% |
Net-Leased Portfolio 6 | Portfolio of sixteen long-term net- leased properties leased to Family Dollar (3), Dollar General (8), Advance Auto Parts (1), AutoZone (1), CVS (1), Dollar Tree (1) and Tractor Supply (1). Performing as expected. | 7.51% | 7.51% |
Net-Leased Portfolio 7 | Portfolio of sixteen long-term net- leased properties leased to Family Dollar (4), Dollar General (8), Advance Auto Parts (1), CVS (1), Napa Auto Parts (1), and O'Reilly Auto Parts (1). Performing as expected. | 7.75% | 7.75% |
Net-Leased Portfolio 8 | Portfolio of thirteen long- term net- leased properties leased to Advance Auto Parts (3), AutoZone (2), CVS (1), Dollar General (2), Family Dollar (1), Franciscan Alliance (1), Ross Stores (1) and Tractor Supply (2). Performing as expected. | 7.32% | 7.32% |
Net-Leased Portfolio 9 | Portfolio of twenty-two long- term net- leased properties leased to Advance Auto Parts (4), AutoZone (4), CVS (1), Dollar General (9), Hobby Lobby (1), Napa Auto Parts (2) and TCF National Bank (1). Performing as expected. | 7.03% | 7.03% |
Net-Leased Portfolio 10 | Portfolio of twenty-two long-term net- leased properties leased to Advance Auto Parts (3), AutoZone (1), CVS (1), Dollar General (5), Dollar Tree (1), Family Dollar (4), Napa Auto Parts (2), O'Reilly Auto Parts (2), PNC Bank (1) and Tractor Supply (2). Performing as expected. | 7.03% | 7.03% |
Net-Leased Portfolio 11 | Portfolio of seventeen long-term net- lease properties leased to Advance Auto Parts (3), CVS (1), Dollar General (5), Family Dollar (2), Hobby Lobby (1), Napa Auto Parts (3), Sherwin- Williams (1) and Walgreens (1). | 6.75% | 6.75% |
Net-Leased Portfolio 12 | Portfolio of nineteen long-term net-lease properties leased to Advance Auto Parts (3), Dollar General (9), Family Dollar (1), Fresenius Medical Care (1), Kroger (1), Napa Auto Parts (2), Tractor Supply (1), and Walgreens (1). | 6.15% | 6.30% |
Net-Leased Portfolio 13 | Portfolio of twenty long-term net-lease properties leased to Advance Auto Parts (1), CVS, (1), Dollar General (5), Family Dollar (4), Hobby Lobby (1), Napa Auto Parts (1), Sherwin Williams (4), Tractor Supply (1) and Walgreens (2). | 6.64% | 6.80% |
Net-Leased Portfolio 14 | Portfolio of seventeen long-term netlease properties leased to Advance Auto Parts (1), Athletico Physical Therapy (1), Dollar General (6), Fresenius Medical Care (2), MedSpring (1), Napa Auto Parts (1), O’Reilly Auto Parts (1), Tractor Supply (1) and Walgreens (3) | 6.50% | 6.57% |
Multifamily 1 - Van Mark Creek Apartments | One (1) apartment community consisting of 144 units. Performing as expected. | 7.11% | 7.11% |
Mira Bella and San Martin | One (1) apartment community consisting of 378 units. Performing as expected. | 6.56% | 6.62% |
Lakeside at Arbor Place Apartments | One (1) apartment community consisting of 246 units. Performing as expected. | 6.20% | 6.20% |
North Austin Apartment Portfolio | Three (3) apartment communities consisting of 422 units. Performing as expected. | 6.25% | 6.25% |
*These returns were provided by and calculated by the Sponsor
**These investment opportunities are open-ended (i.e. Investors come into the fund at different times) resulting in a range of returns
The Trust acquired the apartment complex with 224 units commonly known as the Crystal Lake Apartments (the "Property") on January 25, 2017 from GQ Crystal Lake, LLC, a subsidiary of Greystone and an unaffiliated third party. Concurrently with the acquisition of the Property, the Trust obtained a loan from Société Générale. The Property is master leased by the Trust to Crystal Lake Florida Apartments Master Lessee, LLC ("Master Lessee" or "Master Tenant") an affiliate of the Sponsor. The Master Tenant will pay rent to the Trust and sub-lease the apartment units to tenants pursuant to residential leases. The Trust is a passive owner of the Property and will not be involved in any manner in the active management of the Property. The Master Lessee is to enter into a property management agreement with RAM Partners, LLC, an unaffiliated third party (the "Property Manager") to manage the day-to-day operations of the Property.
The Sponsor intends to implement approximately $1,500,000 toward interior upgrades to approximately 111 units and partial upgrades on an additional 17 units, representing 57% of the property’s total units, and add/upgrade amenities including clubhouse, irrigation system, landscaping, resident car wash, stair landings/guards, parking, etc. The Sponsor estimates that upon renovation the renovated units should be able to achieve rental premiums of approximately $40–$70 per month, excluding potential organic rent growth that the Property is currently experiencing, over a four-year renovation time frame. Under the prior owner, the units that underwent similar interior upgrades in 2015, without many of the amenity upgrades, realized $70–$95 rent premiums.
The Trust expects to provide the Beneficial Owners a return on their investment in two primary ways: (i) in the form of monthly cash distributions to the Beneficial Owners; and (ii) upon any disposition of the Property. The Trust intends to dispose of all of the assets in the Trust in a single sale of the Property. This strategy is anticipated to provide investors with the opportunity to perform a 1031 exchange following the disposition.
Investors are being offered the opportunity to invest in the acquisition of a 224-unit Class B Multifamily property located in Pensacola, FL (the "Property"). The Property was constructed in 1997, renovated in 2015, and is currently 99.5% occupied.
Crystal Lake Florida Apartments DST, a Delaware Statutory Trust ("DST" or "Trust"), owns the Property, and Crystal Lake Florida Apartments, LLC an entity wholly-owned and managed by ExchangeRight Real Estate, LLC (the "Sponsor"), is offering beneficial interests in the DST to investors. The Sponsor is retaining at least a 1.0% ownership interest in the Property and is offering up to 99.0% of the beneficial interests in the DST to accredited investors ("Beneficial Owners"). The Trust expects to provide the Beneficial Owners a return on their investment in two primary ways: (i) in the form of monthly cash distributions to the Beneficial Owners; and (ii) upon any Disposition of the Properties.
The total offering amount is $23,430,000, of which $10,895,000 is equity and $12,535,000 is long-term fixed-rate financing.
This offering is designed for two types of investors. "Existing 1031 Investors" who have already sold or are planning to sell an existing property that is 1031 eligible and want to invest in this offering to complete their 1031 exchange. As well as "Cash Investors" who are investing with funds that are not part of an existing 1031 exchange but want the option for future sales to be 1031 exchange eligible. Existing 1031 Investors may invest for a minimum of $100,000; Cash Investors may invest for a minimum of $25,000.
Crystal Lake Apartments is located at 7680 West Highway 98 in Pensacola, FL. The Property was built in 1997 and is currently 99.5% occupied. The 224 units consist of 1 one-bedroom one-bathroom, 215 two-bedroom two-bathroom units, and 8 large two-bedroom two-bathroom units. Average in-place rents are $841 per unit ranging from $792 to $841. Crystal Lake Apartments offers amenities which include a community pool, children’s playground, nature trail, dog-park, picnic area, sand volleyball court, gazebo with fire pit, and a common laundry facility. Standard unit interiors at the Property include laminate countertops, air conditioning, ceiling fans, basic appliance package and deadbolt locks. Some units feature screened patio/balcony areas and washer/dryer hookups. Capital improvements completed at the Property in 2015 included new vinyl siding, shutters, painted doors, sealing and striping of the parking lot, painted stairwells, building signage, screened in patios, new lights on buildings and breezeways, and enclosed dumpsters. All buildings have pitched roofs with a built-up composition shingle covering which were replaced in 2005. Other significant capital improvements completed during 2015 included total renovation of 111 apartment units, and interior upgrades throughout the project that included new appliances, ceiling fans, flooring, window coverings, furnaces, water heaters, cabinets, window screens, plumbing and electrical as needed. The previous owner completed $1,055,315 in capital improvements and repairs during 2015.
Unit Type | # of Units | Avg SF/Unit | Avg Rent/Unit | Avg Rent/SF |
---|---|---|---|---|
1 Bed / 1 Bath | 1 | 980 | $792 | $0.81 |
2 Bed / 2 Bath | 215 | 980 | $841 | $0.86 |
2 Bed / 2 Bath (L) | 8 | 1,000 | $832 | $0.83 |
Total | 224 | 981 | $841 | $0.86 |
[[{"fid":"35565","view_mode":"default","type":"media","field_deltas":{},"attributes":{"height":"704","width":"955","class":"media-element file-default","data-delta":"1"},"fields":{}}]]
Subject | Fairfield Lakes | Sandalwood Apartments | Angel Cove | Angel Landing | The Pines at Warrington | Total / Averages | |
---|---|---|---|---|---|---|---|
# of Units | 224 | 268 | 244 | 168 | 108 | 160 | 190 |
Year Built | 1997 | 2004 | 1985 | 1998 | 2005 | 2007 | 2000 |
Average SF (Per Unit) | 981 | 1,036 | 877 | 1,183 | 1,153 | 1,047 | 1,036 |
Average Rental Rate (Per Unit) | $854 | $911 | $721 | $984 | $1,115 | $763 | $873 |
Average Rent PSF | $0.87 | $0.88 | $0.82 | $0.83 | $0.97 | $0.73 | $0.84 |
Source: Colliers International Appraisal
Subject | Fairfield Lakes | Tally Square | Parkway Square | Ashley Club Apartments | Arbor Club | Total / Averages | |
---|---|---|---|---|---|---|---|
Date | Jan-17 | Dec-16 | Apr-16 | Apr-16 | Sep-15 | Aug-15 | - |
# of Units | 224 | 268 | 230 | 277 | 224 | 168 | 233 |
Year Built | 1997 | 2003 | 1972 | 1975 | 1986 | 1986 | 1984 |
Average SF (per Unit) | 981 | 1,036 | 1,212 | 810 | 814 | 808 | 942 |
Purchase Price | $19,900,000 | $28,000,000 | $19,000,000 | $21,750,000 | $16,000,000 | $11,100,000 | $20,006,470 |
$/Unit | $88,839 | $104,478 | $82,609 | $78,520 | $71,429 | $66,071 | $82,134 |
Cap Rate | 6.45% | 6.00% | 6.00% | 6.00% | 5.90% | 6.10% | 6.00% |
Occupancy at Sale | 96.4% | 92% | 93% | 86% | 95% | 96% | 92% |
Source: Colliers International Appraisal
Property Appraisal available upon request. Please email investor-help@realtymogul.com.
The Pensacola area consists of Escambia and Santa Rosa Counties. Pensacola is the westernmost city in the Florida Panhandle and the county seat of Escambia County.
Market Overview
Per the U.S. Census Bureau, the Pensacola MSA had a population of 483,494 in 2016. Pensacola’s population is projected to increase 12.0% from 2012 to 2020, as reported by Wood & Poole CEDDS 2012. More than 3.5 million visitors come to the Pensacola Bay Area each year—resulting in a $1.2 billion impact on the local economy and employing 18,000 residents. The city has been referred to as "The Cradle of Naval Aviation" and Naval Air Station Pensacola (NASP) was the first Naval Air Station commissioned by the U.S. Navy in 1914. Per Cushman & Wakefield, the Department of Defense is the largest employer in the region, with more than $7.8 billion in total economic impact annually and more than 80,000 employees collectively. There are three major military centers within five miles of the Property, which creates stability and reduces macroeconomic risk. These military centers include the Corry Station (headquarters for the U.S. Navy’s Center for Information Dominance), the Naval Air Station (initial primary training base for all Navy, Marine, and Coast Guard aviators and Naval Flight Officers), and Saufley Field (an educational and training program for the Navy). Over the past decade, a notable lack of multifamily development in the Pensacola MSA has resulted in an extremely limited Class A/B rental market. Population growth has exceeded apartment delivery, and Pensacola now has the second lowest number of Class A/B units per capita amongst major coastal markets. The multifamily product is very limited in the surrounding area and, as such, the vacancy rate in the 5-year forecast is projected to remain low at 4.1%, according to REIS 2Q 2016 report.
Submarket Overview
The Property is located within the Southwest Pensacola submarket, which is located within the Pensacola MSA. Approximately 70% of households in the metro are homeowners, with most of the market-rate apartment demand in the Pensacola and Southwest Pensacola submarkets. Asking rents in Pensacola are higher than in nearby metros and have been growing at an above-average pace. Investment totals over the past four quarters were about 75% higher than historical averages, and activity was focused in the Southwest Pensacola submarket. There are only three conventional apartments within a five mile radius of the subject that were built after 1990.
Market and Submarket Overview information above was obtained from Axiometrics, Costar and the Appraisal.
Demographic Information
Distance from Property | 1 Mile | 3 Miles | 5 Miles |
Population | 6,215 | 45,905 | 104,828 |
Population Estimates (2021) | 6,478 | 47,783 | 109,030 |
Average Age | 38.1 | 37.4 | 36.8 |
Median Household Income | $45,979 | $39,139 | $40,212 |
Average Household Size | 2.3 | 2.4 | 2.5 |
Median Home Value | $122,432 | $85,993 | $87,397 |
Owner Occupied Households | 1,358 | 10,421 | 22,389 |
Renter Occupied Households | 1,261 | 7,646 | 16,195 |
Population Growth 2016 -2021 | 4.23% | 4.09% | 4.01% |
Demographic information above was obtained from CoStar and Census.gov
This content does not constitute an offer to sell or a solicitation of an offer to buy any securities. RealtyMogul.com and North Capital Private Securities are in the process of screening, performing due diligence, and verifying information for the offering. The content is presented to gauge interest only and is subject to change without notice.
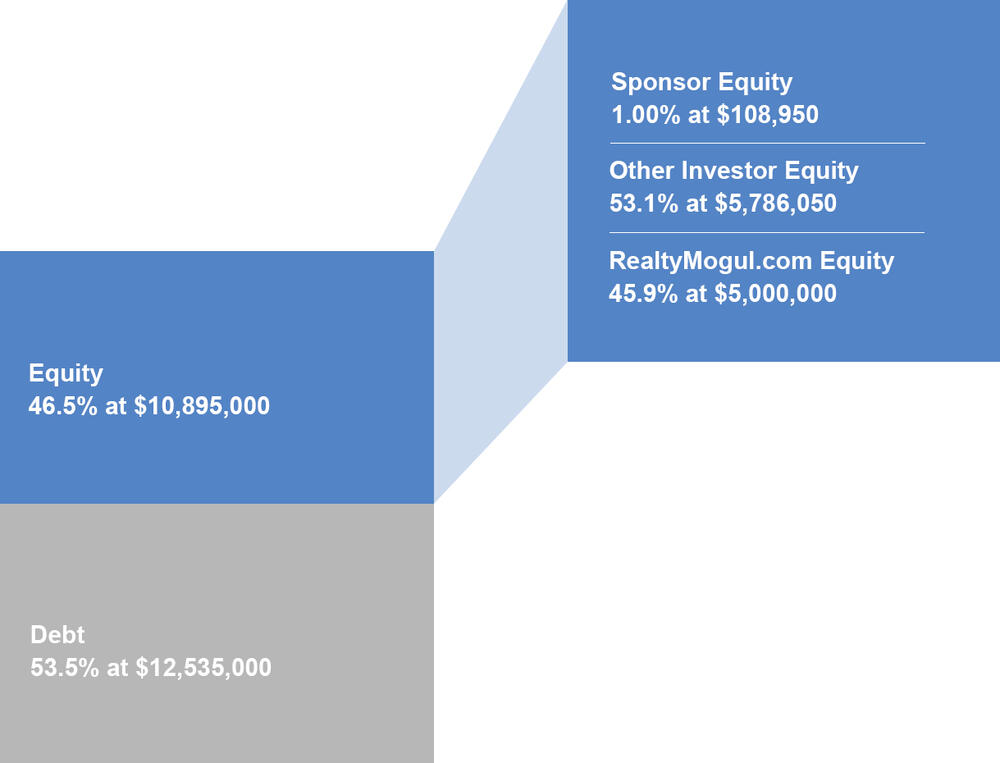
Equity | $10,895,000 | |
Debt | $12,535,000 | |
Total Sources of Funds | $23,430,000 | |
Acquisition Price* | $20,386,850 | |
Acquisition Fee | $210,595 | |
Broker-Dealer Fee and Marketing Allowance | $871,600 | |
Prepaid Taxes, Insurance and Reserves | $139,455 | |
Replacement Reserves, Unit Renovation Reserve, and Reserves for Operations and Asset Mgt. | $1,476,600 | |
Selling Commissions and Expenses | $344,900 | |
Total Uses of Funds | $23,430,000 |
* Purchase price of $19,900,000 and $486,850 of acquisition related costs
The Portfolio has existing debt:
- Lender: Société Générale
- Loan Origination Date: 01/25/2017
- Loan Proceeds: $12,535,000
- Loan to Cost: 53.5%
- Interest Rate: Fixed (4.30%)
- Amortization: Full term (10-year) interest-only
- Recourse: Non-recourse to the Trust, but recourse to the Trust and principals of the Sponsor for certain (i) "bad acts," and (ii) environmental indemnification
- Term: 10 years
- Prepayment Penalty: Subject to Yield Maintenance Premium if loan repaid before Stated Maturity Date of February 1, 2027
- Other Senior Lender Provisions:
- Upfront replacement reserves was withheld from Loan proceeds by Lender and deposited on the Trust’s behalf on the Loan closing in the amount of (A) $257,600 to be used for Replacements (the “Upfront Replacement Deposit”); (B) $772,000 to be used for the Replacements related to capital improvements (the “Capital Improvement Deposit”); and (C) the Trust shall thereafter deposit $250 per unit per year for replacements and repairs to the Property during the term of the Loan (the “Replacement Reserve Monthly Deposit”) (collectively, the “Replacement Reserve”);
- Required repair reserve was withheld from Loan proceeds by Lender and deposited on the Trust’s behalf on the Loan closing in the amount of $5,000, which amount equals one hundred twenty-five percent (125%) of the estimated cost for the completion of the Lender’s required repairs at the Property (the “Required Repair Reserve”); and,
- Taxes and insurance reserve that was funded on the Loan closing in the amount of $84,952 and an on-going tax and insurance reserve shall be funded by the Trust on each Loan payment date in an amount equal to one-twelfth of the tax premiums that the Lender estimates will be payable during the next ensuing twelve (12) months (the “Tax and Insurance Reserve”).
The Sponsor is to make distributions directly to investors who own a beneficial interest in the DST on a pro-rata basis.
Distributions are expected to start for each investor within 45 days of the completion of that investors beneficial interest in the DST. Distributions are expected to continue on a monthly basis thereafter. These distributions are at the discretion of the Sponsor and made directly by the Sponsor, neither Realty Mogul Co. nor any of its affiliates have any control or discretion on the timing or amount of distributions.
Certain fees and compensation will be paid over the life of the transaction. The following fees and compensation will be paid:
Type of Fee | Amount of Fee | Received By | Paid From | Notes |
One-Time Fees: | ||||
---|---|---|---|---|
Acquisition Fee | $210,595 | Sponsor | Capitalized Equity Contribution | 1.93% of the offering amount. |
Broker-Dealer Fee | 7.0% | Broker Dealers | Capitalized Equity Contribution | Paid to North Capital(1) or other licensed broker-dealers based on the amount of equity capital raised. Surplus fees retained by Sponsor. |
Marketing & Due Diligence Fee | 1.0% | Broker Dealers | Capitalized Equity Contribution | 1.0% based on the amount of equity invested by investors through RealtyMogul.com, third-party Broker Dealers (including North Capital(1)) are entitled to additional fees based on equity they originate. Surplus fees retained by Sponsor. |
Syndication Costs | $105,000 | Sponsor or Third Parties | Capitalized Equity Contribution | Fees associated with expenses for preparation of offering materials/documents, PPM, and tax opinion paid to third parties. |
Organizational & Offering Costs | $163,425 | Sponsor | Capitalized Equity Contribution | 1.5% of maximum offering amount. |
Sponsorship Cost | $54,475 | Sponsor | Capitalized Equity Contribution | 0.5% of the offering amount. To reimburse Sponsor for accounting, due diligence, marketing, distribution, and other costs. |
Recurring Fees: | ||||
Asset Management Fee | 0.5% - 1.0% annual gross income actually collected | Manager | Operating Cash Flow | 0.5% in Year 1, 1.0% in Year 2 through Year 10. |
Disposition Fee | 2.0% | Manager | Disposition Proceeds | 2.0% of gross proceeds from disposition of property if disposition price plus reserves is greater than $23,430,000. |
Trustee Fee | $750 annually | Third-Party | Operating Cash Flow | Gregory S. Harrison, unaffiliated third party |
Master Lease Operating Profit | N/A | Master Lessee | Operating Cash Flow | Master Lessee will retain operating revenues from the Properties that exceed the Annual Base Rent and the Annual Bonus Rent due to the Trust under the Master Lease. Master Tenant is entitled to 50% of rental income above the Effective Gross Revenue Benchmark in a given year. |
Notes:
(1) Certain employees of Realty Mogul, Co. are registered representatives of, and are paid commissions by, North Capital Private Securities Corp., a Delaware corporation ("North Capital"). In addition, North Capital pays a technology provider services fee to Realty Mogul, Co. for licensing and access to certain technology, reporting, communications, branding, entity formation and administrative services performed from time to time by Realty Mogul, Co., and North Capital and Realty Mogul, Co. are parties to a profit sharing arrangement.
The above presentation is based upon information supplied by the Sponsor or others. Realty Mogul, Co. along with its respective affiliates, officers, directors or representatives (the "RM Parties") hereby advise you that none of them has independently confirmed or verified any of the information contained herein. The RM Parties further make no representations as to the accuracy or completeness of any such information and undertake no obligation now or in the future to update or correct this presentation or any information contained herein.
RM Securities, LLC, its registered representatives, affiliates, associated persons, and personnel of its affiliates who may also be associated with it, including our associated persons and personnel of our affiliates who are also be associated with RM Securities, LLC (it (“RM Securities,” “we,” “our,” or “us”) will receive fees, expense reimbursements, and other compensation (“Fees”) from the issuer of this investment offering, its sponsor, or an affiliate thereof (“Sponsor”), or otherwise in connection with Sponsor’s offering. The Fees paid to us are in addition to other fees you will pay to Sponsor or in connection with Sponsor’s investment offering. You will pay Fees to Sponsor, either directly or indirectly as an investor in the Sponsor’s offering. Sponsor will use the Fees you pay, as well as funds you invest in the relevant offering, to compensate us. The Fees paid to us will directly or indirectly be borne by you as the investor (typically, but not always, in the form of an expense of the Sponsor’s offering in which you invest) because such Fees will reduce the proceeds available for distribution to you and reduce the amount you earn over time.
For more information on the Fees paid to us, or any other Fees you will pay in connection with Sponsor’s offering, please carefully review the Sponsor’s Investment Documents. Please also carefully review RM Securities’ Form CRS, Regulation Best Interest Disclosures, and Limited Brokerage Services Agreement.
No Approval, Opinion or Representation, or Warranty by RM Securities, LLCSponsor has provided, approved, and is solely responsible in all aspects for the information on this webpage (“Page”), including Sponsor’s offering documentation, which may include without limitation the Private Placement Memorandum, Operating or Limited Partnership Agreement, Subscription Agreement, the Project Summary and all exhibits and other documents attached thereto or referenced therein (collectively, the “Investment Documents”). The Investment Documents linked on this page have been prepared and posted by Sponsor, and not by RM Securities. We did not assist in preparing, do not adopt or endorse, and we are not otherwise responsible for, the Sponsor’s Investment Documents. We make no representations or warranties as to the accuracy of information on this Page or in the Sponsor’s Investment Documents and we accept no liability therefor. No part of the information on this Page or in the Sponsor’s Investment Documents is intended to be binding on us.
Sponsor’s Information Qualified by Investment DocumentsThe information on this Page is qualified in its entirety by reference to the more complete information about the offering contained in the Sponsor’s Investment Documents. The information on this Page is not complete and subject to change at the Sponsor’s discretion at any time up to the closing date. The Sponsor’s Investment Documents and supplements thereto contain important information about the Sponsor’s offering including relevant investment objectives, the business plan, risks, charges, expenses, and other information, which you should consider carefully before investing. The information on this Page should not be used as a basis for an investor’s decision to invest.
Risk of InvestmentThis investment is speculative, highly illiquid, and involves substantial risk. There can be no assurances that all or any of Sponsor’s assumptions, expectations, estimates, goals, hypothetical illustrations, or other aspects of Sponsor’s business plans (“Assumptions”) will be true or that actual performance will bear any relation to Sponsor’s Assumptions, and no guarantee or representation is made that Sponsor’s Assumptions will be achieved. If Sponsor does not achieve its Assumptions, your investment could be materially and adversely affected. A loss of part or all of the principal value of your investment may occur. You should not invest unless you can readily bear the consequences of such loss. Sponsor’s Assumptions should not be relied upon as the primary basis for your decision to invest.
No Reliance on Forward-Looking Statements; Sponsor AssumptionsSponsor is solely responsible for statements made concerning forward-looking statements and Assumptions, which apply only as of the date made, are preliminary and subject to change, and are expressly qualified in their entirety by the disclosures and cautionary statements included in Sponsor’s Investment Documents, which you should carefully review. Neither RM Securities nor Sponsor are obligated to update or revise such forward-looking statements or Assumptions to reflect events or circumstances that arise after the date made or to reflect the occurrence of unanticipated events. Sponsor’s forward-looking statements and Assumptions are hypothetical, not based on actual investment achievements or events, and are presented solely for purposes of providing insight into the Sponsor’s investment objectives, detailing Sponsor’s anticipated risk and reward characteristics, and establishing a benchmark for future evaluation of actual results; therefore, they are not a predictor, projection, or guarantee of future results. You should not rely on Sponsor’s forward-looking statements as a basis to invest.
Importantly, we do not adopt, endorse, or provide any assurance of returns or as to the accuracy or reasonableness of Sponsor’s Assumptions or forward-looking statements.
No Reliance on Past PerformanceAny description of past performance is not a reliable indicator of future performance and should not be relied upon as the primary basis to invest.
Sponsor’s Use of DebtA substantial portion of the total cost of the real estate asset acquired by the Sponsor with investor funds (“Property”) will be paid with borrowed funds, i.e., debt. Sponsor’s estimated rates and terms of the debt financing are subject to lender approval, and there is no assurance that the Sponsor will secure debt at the rates and terms presented on this Page or in the Sponsor’s Investment Documents, or at all. The use of borrowed money to acquire real estate is referred to as leveraging, which can amplify losses and could result in lender foreclosure. In addition, if the debt includes a variable (or “floating”) interest rate, the total amount of interest paid over the term of the debt will fluctuate and can increase. As a result, Sponsor’s use of debt can result in a loss of some or all of your investment.
Sponsor’s Offering is Not RegisteredSponsor’s securities offering will not be registered under the Securities Act of 1933, as amended (the “Securities Act”), in reliance upon the exemptions from registration pursuant to Rule 506(c) of Regulation D as promulgated under the Securities Act (“Private Placement”). In addition, the offering will not be registered under any state securities laws in reliance on exemptions from state registration. Such securities (your ownership interests) are subject to restrictions on transferability and resale and may not be transferred or resold except as permitted under applicable state and federal securities laws pursuant to registration or an available exemption. All Private Placements on the Platform are intended solely for “Accredited Investors,” as that term is defined in Rule 501(a) under the Securities Act.
No Investment AdviceNothing on this Page should be regarded as investment advice (either with respect to a particular security or regarding an overall investment strategy), a recommendation, an offer to sell, or a solicitation of or an offer to buy any security. Advice from a securities professional is strongly advised to understand and assess the risks associated with real estate or private placement investments. For additional information on RM Securities’ involvement in this offering, please carefully review the Sponsor’s Investment Documents, and RM Securities’ Form CRS, Regulation Best Interest Disclosures, and Limited Brokerage Services Agreement.
1031 Exchange RiskInternal Revenue Code Section 1031 (“Section 1031”) contains complex tax concepts and certain tax consequences may vary depending on the individual circumstances of each investor. RM Securities and its affiliates make no representation or warranty of any kind with respect to the tax consequences of your investment or that the IRS will not challenge any such treatment. You should consult with and rely on your own tax advisor about the tax aspects with respect to your particular circumstances.