The team at our affiliated broker-dealer, RM Securities, conducts diligence on of the issuer, including detailed background checks, criminal checks, bad actor checks, and reference checks on sponsors. In addition to screening for any criminal background, we may also turn down sponsors due to poor reference checks, even if the background and criminal checks are satisfactory.
We require unaffiliated sponsors to use an unaffiliated third-party escrow agent.* When an investor makes an investment with such sponsors using the RealtyMogul platform, the investor’s money is transferred directly into a third-party escrow account. All closing conditions in connection with a sponsor’s contingency offering need to be met before the third-party escrow agent will approve releasing investor funds to the issuer or general partner. For example, if an issuer or general partner plans to use funds for a real estate acquisition that does not ultimately transact, the third-party escrow agent will not transfer investor funds to the issuer or general partner, and funds will be returned to investors.
Unless otherwise disclosed, escrow accounts are not required for some investments that accommodate 1031 investments where the property is already acquired.
Our processes typically includes visiting certain properties (or a subset of properties if it's a fund) to confirm the real estate is what and where the real estate is supposed to be. For certain properties that accommodate 1031 exchange investments, the team will review third-party prepared due diligence reports in lieu of a site visit.
We have formalized processes and checklists for every private placement deal listed on the platform.
New Standard Equities, Inc.
NSE was formed in 2010 in an effort to capitalize on the extraordinary dislocation in the post‐financial crisis real estate investment market. With significant experience in buying and operating large, institutional-quality multifamily properties throughout the Western U.S., the company is deploying private and institutional capital to purchase and operate apartment assets that offer steady, long-term cash flow to its investors. New Standard Equities’ full-service real estate platform is actively engaged in property management, asset management, construction management and project consultation.
NSE has successfully operated multifamily assets in major markets throughout the Western U.S. There are inherent risks in the task of operating apartment assets, but the firm’s strict philosophy is to minimize those risks by targeting markets it knows and understands. In-fill, supply-constrained markets that offer long-term job growth potential are among the most important dynamics.
http://www.newstandardequities.com/The below track record for Edward Ring includes all the apartment acquisitions completed by New Standard Equities, as well as those Mr. Ring was responsible for while at Kennedy Wilson Multifamily.
Address | Location | Date Acquired | # of Units | Purchase Price |
---|---|---|---|---|
New Standard Equities (2011 - Present) | ||||
Fountain at Curson | Hollywood, CA | Jun-11 | 20 | $4,000,000 |
Crossings at the Bay | Long Beach, CA | Nov-11 | 235 | $34,500,000 |
Villa Olivos | Canoga Park, CA | Aug-12 | 53 | $4,950,000 |
Parke Pasadena | Pasadena, CA | Aug-13 | 22 | $3,400,000 |
Asana at North Park | San Diego, CA | Oct-14 | 132 | $18,470,000 |
Anchor Pointe | Oak Harbor, WA | Aug-15 | 107 | $7,500,000 |
Rancho Azul | San Diego, CA | Aug-15 | 74 | $14,000,000 |
SeaGlass Village | Bremerton, WA | Mar-16 | 182 | $13,000,000 |
Venue | Renton, WA | Jun-16 | 284 | $41,500,000 |
Subtotal | 1,109 | $141,320,000 | ||
Kennedy Wilson Multifamily (2002 - 20008) | ||||
Woodstone | Lompoc, CA | Mar-05 | 204 | $20,600,000 |
Rutherford Townhomes | Napa, CA | Aug-05 | 66 | $7,400,000 |
College Square | Davis, CA | Aug-05 | 240 | $24,000,000 |
Bayside | Pinole, CA | Aug-05 | 148 | $19,600,000 |
Villas at La Mesa | La Mesa, CA | Dec-05 | 86 | $11,100,000 |
Arbor Creek | Beaverton, OR | Mar-06 | 440 | $32,800,000 |
The Courtyards | Norwalk, CA | Mar-06 | 153 | $18,200,000 |
Bay Village | Vallejo, CA | Mar-06 | 260 | $32,000,000 |
Shorepark at Riverlake | Sacramento, CA | Mar-06 | 393 | $51,250,000 |
Mariposa | Anaheim, CA | Jun-06 | 286 | $46,000,000 |
Hidden Creek | Martinez, CA | Sep-06 | 168 | $21,500,000 |
Cascade Ridge | Federal Way, WA | Nov-06 | 518 | $58,000,000 |
The Enclave | Paramount, CA | Dec-06 | 306 | $51,500,000 |
Chadwick | Los Angeles, CA | Feb-07 | 687 | $120,000,000 |
The Reserve | Federal Way, WA | Mar-07 | 401 | $46,500,000 |
The Mill at Mill Creek | Mill Creek, WA | Jul-07 | 516 | $80,000,000 |
The Grove | San Jose, CA | Jul-07 | 331 | $45,750,000 |
James Street Crossing | Kent, WA | Feb-08 | 300 | $35,720,000 |
Indigo Springs | Kent, WA | Jun-08 | 278 | $36,000,000 |
Avalon at Redmond | Redmond, WA | Jun-08 | 400 | $81,250,000 |
The Lexington | Montclair, CA | Aug-08 | 165 | $29,250,000 |
Saybrook Pointe | San Jose, CA | Sep-08 | 324 | $84,000,000 |
Plaza del Sol | Santa Ana, CA | Jan-02 | 196 | $16,675,000 |
Windwood | West Covina, CA | Dec-02 | 116 | $11,250,000 |
Rancho Solana | Oxnard, CA | Mar-03 | 168 | $22,750,000 |
La Serena | Santa Ana, CA | Dec-02 | 188 | $18,000,000 |
Lakewood Manor | Lakewood, CA | Aug-04 | 661 | $68,000,000 |
Andorra & Andalucia | Indio & Palm Springs, CA | Sep-03 | 362 | $26,200,000 |
Arrowhead Apartments | Stanton, CA | Jan-04 | 168 | $19,750,000 |
Waterbrook | Rancho Cucamonga, CA | May-04 | 624 | $66,600,000 |
The Crest | Grand Terrace, CA | Mar-04 | 228 | $19,305,000 |
Verona Woods | West Covina, CA | Mar-04 | 196 | $22,000,000 |
Somerset on Garfield | Montebello, CA | Dec-04 | 256 | $31,750,000 |
Country Oaks | Santa Maria, CA | May-05 | 208 | $22,800,000 |
Windscape Village | Lompoc, CA | Sep-03 | 328 | $27,000,000 |
Creekside | San Jose, CA | Nov-05 | 200 | $26,600,000 |
Westwood Portfolio | Westwood Village, CA | Mar-05 | 153 | $32,100,000 |
Summer House | Alameda, CA | Sep-05 | 615 | $86,750,000 |
Subtotal | 11,337 | $1,469,950,000 | ||
Total | 12,446 | $1,611,270,000 |
The above track record information was provided by the Real Estate Company and has not been independently verified by RealtyMogul.com.
In this transaction, RealtyMogul.com investors are to invest in Realty Mogul 75, LLC. Realty Mogul 75, LLC is to subsequently invest in Fairgrounds Investors, LLC, a limited liability company that will (through another wholly-owned entity) hold title to the Property.
The Sponsor intends on implementing a $665,000 exterior capital improvement plan to enhance the Property's curb appeal and improve the common areas. The exterior capital improvements include new signage, landscaping, hardscape, lighting and facade treatments, and the remodel and expansion of the current clubhouse and fitness center. The Sponsor has also capitalized $1,020,000, or $8,500/unit, for interior unit renovations for all 120 units. The Sponsor plans to repaint the interiors, lay vinyl plank flooring, and upgrade the cabinets, countertops, appliances and bathroom lighting.
Per review of the October 2016 rent roll, recent leasing for unrenovated units at the Property has already achieved rents that are on average 99% of the expected rents post-renovation for each of the unit types. Refer below for a comparison of the underwritten post-renovation rents to the highest in-place rents at the Property by unit type:
Unit Type | # of Units | Post-Renovation Rent | Highest In-Place Rent | % of Post-Renovation Rent | |
---|---|---|---|---|---|
1/1 | 26 | $1,075 | $1,025 | 95% | |
2/1 | 30 | $1,220 | $1,199 | 98% | |
2/2 | 36 | $1,290 | $1,249 | 97% | |
3/2 | 28 | $1,550 | $1,599 | 103% | |
Total | 120 | $1,287 | $1,270 | 99% |
The Sponsor intends to begin completing the exterior capital improvements immediately upon acquiring the Property, followed by the interior renovation work starting in month three with projections assuming four units being renovated per month over a 30-month period. Upon completion of all renovations, the Sponsor plans on selling the Property. While the Sponsor targets selling the Property in five years, if the renovations are successfully implemented ahead of schedule and market conditions allow for a favorable sale, the hold period could be shorter. However, the hold period is not guaranteed and could also extend beyond the five-year expectation as well.
A summary of the capital expenditures planned at the Property is as follows:
CapEx Item | $ Amount | Per Unit |
---|---|---|
Interior Rehab ($8,500 each for 120 units) | $1,020,000 | $8,500 |
General Site Woodwork | $375,000 | $3,125 |
Exterior Paint & Architectural Elements | $150,000 | $1,250 |
Clubhouse/Office & Finishes | $65,000 | $542 |
Sign Package & Capitalized Marketing | $34,000 | $283 |
Wood Rot/Balcony Repair | $20,000 | $167 |
Pool Re-plaster | $10,000 | $83 |
Concrete Repair | $5,000 | $42 |
Railroad Tie Retaining Wall | $5,000 | $42 |
ADA Compliance | $1,000 | $8 |
Total Rehab Costs | $1,685,000 | $14,041 |
Construction Management Fee (9%) | $151,650 | $1,264 |
Total Capital Expenditure Reserve | $1,836,650 | $15,305 |
Kitsap Naval Base - Basic Allowance for Housing ("BAH")
The asset's tenant roster is diverse with the following primary industry concentrations: 47% retail/services/sales; 19% military/law enforcement; 12% professional; and 7% manufacturing/construction. However, given the naval base's importance to the local economy, RealtyMogul.com has performed a comparative analysis of the Kitsap Naval Base's basic allowance for housing with the expected post-renovation rents at the Property.
The below table depicts Kitsap Naval Base's 2016 basic allowance for housing (BAH). With E1 to E4 ranked military personnel typically living on-base, those personnel ranked E5 or higher represent the majority of the Property's renter pool who serve in the military. As shown in the table, all ranks from E5 and up without dependents receive a BAH greater than the expected rents post-renovation for all one and two bedroom units. For the three bedrooms, all military personnel ranked E5 or higher with dependents receive a BAH greater than the expected rents post-renovation.
Rank | E1 - E4 | E5 | E6 | E7 | E8 | E9 |
---|---|---|---|---|---|---|
With Dependents | $1,413 | $1,551 | $1,617 | $1,686 | $1,758 | $1,869 |
Without Dependents | $1,137 | $1,227 | $1,293 | $1,422 | $1,566 | $1,584 |
RealtyMogul.com, along with New Standard Equities (“NSE” or the “Sponsor”), is providing the opportunity to invest in the acquisition and ownership of the Village Fair Apartments (the "Property"), a 120 unit, garden-style apartment complex located in Bremerton, WA. This will be the Sponsor's second transaction with RealtyMogul.com.
The primary objective of this investment is to acquire the Property at an attractive going-in yield and basis, implement exterior and interior capital improvements, increase rental rates, and sell the Property within five years.
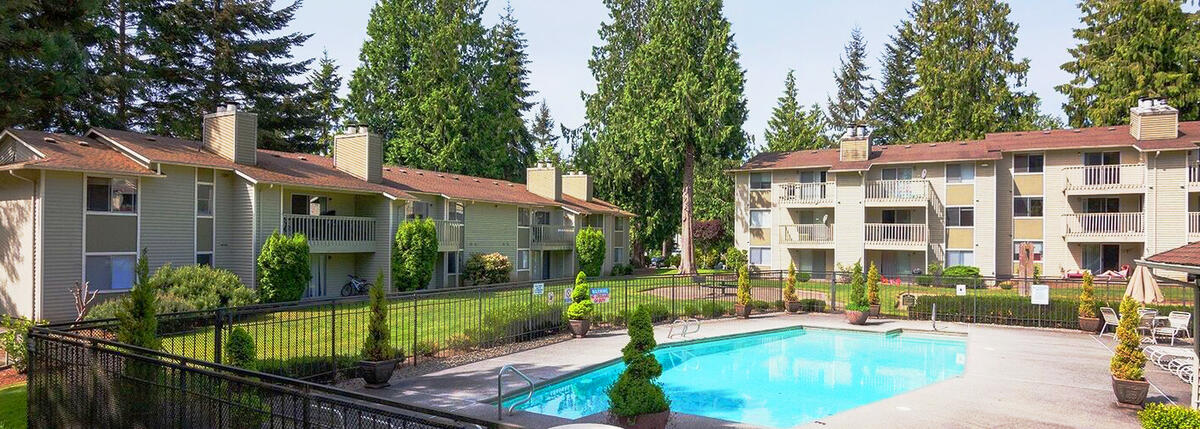
Built in 1984, the Property is a Class B, 120-unit garden-style apartment complex that is currently 90% leased to a diverse tenant roster. The asset has a balanced mix of one, two and three bedroom units that allow it to cater to a variety of tenants including singles, couples and families. Unit interiors include both vinyl and carpeted floors, dishwashers and patios or balconies. All three (3) bedroom units at the Property have full-size washer/dryers. Each unit is individually metered for electricity, with water and sewer reimbursed by tenants based on occupancy using a ratio utility billing system ("RUBS").
Unit Type | # of Units | Avg SF/Unit | In-Place Rent | Rent/SF | Post-Renovation Rent | Rent/SF |
---|---|---|---|---|---|---|
1 Bed, 1 Bath | 26 | 623 | $848 | $1.36 | $1,075 | $1.73 |
2 Bed, 1 Bath | 30 | 800 | $988 | $1.24 | $1,220 | $1.53 |
2 Bed, 2 Bath | 36 | 913 | $1,060 | $1.16 | $1,290 | $1.41 |
3 Bed, 2 Bath | 28 | 1,100 | $1,289 | $1.17 | $1,550 | $1.41 |
Total | 120 | 866 | $1,050 | $1.21 | $1,287 | $1.49 |
The Property is situated on 9.4 acres, providing for low density of only 12.8 units per acre. Property amenities include a pool, clubhouse, fitness center and multiple laundry rooms. The Property's 197 parking spaces equates to 1.6 spaces per unit. The Property consists of wood-frame construction with wood siding and concrete slab foundation. Roofs are pitched composition shingle with copper plumbing, copper electrical and cadet wall heaters.
[[{"fid":"32468","view_mode":"default","type":"media","attributes":{"height":"631","width":"818","style":"width: 600px; height: 463px;","class":"media-element file-default"}}]]
Property | Subject (Post-Renovation) | Olympic Village | The Vineyards | Weatherstone | Total / Averages |
---|---|---|---|---|---|
# of Units | 120 | 340 | 150 | 144 | 211 |
Occupancy | 95% | 97% | 93% | 97% | 96% |
Year Built | 1984 | 1995 | 1988 | 1986 | 1990 |
1 Bedroom 1 Bathroom | |||||
# of Units | 26 | 48 | 88 | 26 | 54 |
Average SF (1/1) | 623 | 698 | 612 | 576 | 632 |
Rental Rate (1/1) | $1,075 | $1,180 | $1,056 | $979 | $1,080 |
Average $/SF (1/1) | $1.73 | $1.69 | $1.73 | $1.70 | $1.71 |
2 Bedroom 1 Bathroom | |||||
# of Units | 30 | 72 | 22 | 50 | 48 |
Average SF (2/1) | 800 | 890 | 898 | 893 | 892 |
Rental Rate (2/1) | $1,220 | $1,303 | $1,211 | $1,179 | $1,246 |
Average $/SF (2/1) | $1.53 | $1.46 | $1.35 | $1.32 | $1.40 |
2 Bedroom 2 Bathroom | |||||
# of Units | 36 | 87 | 22 | 20 | 43 |
Average SF (2/2) | 913 | 980 | 949 | 1,054 | 986 |
Rental Rate (2/2) | $1,290 | $1,380 | $1,301 | $1,279 | $1,351 |
Average $/SF (2/2) | $1.41 | $1.41 | $1.37 | $1.21 | $1.37 |
3 Bedroom 2 Bathroom | |||||
# of Units | 28 | 65 | 18 | 28 | 37 |
Average SF (3/2) | 1,100 | 1,200 | 1,138 | 1,193 | 1,188 |
Rental Rate (3/2) | $1,550 | $1,565 | $1,540 | $1,529 | $1,552 |
Average $/SF (3/2) | $1.41 | $1.30 | $1.35 | $1.28 | $1.31 |
Quality | - | Superior | Inferior | Inferior | - |
Distance from Subject (miles) | - | 0.6 | 0.3 | 0.3 | 0.4 |
Property | Subject (Post-Renovation) | Reserve at Bucklin Hill | The Wellington | The Trillium | Total / Averages |
---|---|---|---|---|---|
# of Units | 120 | 154 | 240 | 225 | 206 |
Occupancy | 95% | 97% | 93% | 98% | 96% |
Year Built | 1984 | 1988 | 1988 | 1989 | 1988 |
1 Bedroom 1 Bathroom | |||||
# of Units | 26 | 60 | 58 | 24 | 47 |
Average SF (1/1) | 623 | 612 | 736 | 596 | 660 |
Rental Rate (1/1) | $1,075 | $1,201 | $1,250 | $1,244 | $1,228 |
Average $/SF (1/1) | $1.73 | $1.96 | $1.70 | $2.09 | $1.86 |
2 Bedroom 1 Bathroom | |||||
# of Units | 30 | 48 | 8 | 45 | 34 |
Average SF (2/1) | 800 | 850 | 976 | 776 | 827 |
Rental Rate (2/1) | $1,220 | $1,363 | $1,481 | $1,334 | $1,359 |
Average $/SF (2/1) | $1.53 | $1.60 | $1.52 | $1.72 | $1.64 |
2 Bedroom 2 Bathroom | |||||
# of Units | 36 | 22 | 68 | 135 | 75 |
Average SF (2/2) | 913 | 920 | 1,017 | 914 | 946 |
Rental Rate (2/2) | $1,290 | $1,433 | $1,599 | $1,410 | $1,469 |
Average $/SF (2/2) | $1.41 | $1.56 | $1.57 | $1.54 | $1.55 |
3 Bedroom 2 Bathroom | |||||
# of Units | 28 | 24 | 40 | 21 | 28 |
Average SF (3/2) | 1,100 | 1,160 | 1,211 | 1,028 | 1,151 |
Rental Rate (3/2) | $1,550 | $1,640 | $1,660 | $1,629 | $1,647 |
Average $/SF (3/2) | $1.41 | $1.41 | $1.37 | $1.58 | $1.43 |
Quality | - | Superior | Superior | Superior | - |
Distance from Subject (miles) | - | 2.4 | 3.8 | 4.2 | 3.5 |
Property | Subject | Silverdale Ridge | Santa Fe Ridge | Treetops | The Wellington | Ridgetop | Total / Averages |
---|---|---|---|---|---|---|---|
Sale Date | - | May-16 | Jan-16 | Dec-15 | Sep-15 | Sep-15 | - |
# of Units | 120 | 118 | 240 | 270 | 240 | 221 | 218 |
Year Built | 1984 | 2009 | 1993 | 1992 | 1988 | 1988 | 1994 |
Purchase Price | $13,100,000 | $20,100,000 | $37,380,000 | $40,250,000 | $38,130,000 | $31,500,000 | $33,472,000 |
$/Unit | $109,167 | $170,339 | $155,750 | $149,074 | $158,875 | $142,534 | $153,682 |
Cap Rate | 6.58% | - | 5.90% | 5.80% | 6.00% | 6.00% | 5.93% |
Quality | - | Superior | Superior | Superior | Superior | Superior | - |
Distance from Subject (miles) | - | 3.6 | 3.6 | 4.0 | 3.8 | 3.4 | 3.7 |
Sale and Leasing Comp information provided by Axiometrics and Real Capital Analytics.
The Property is located in Bremerton, Washington between downtown Silverdale (3.5 miles) and downtown Bremerton (5.6 miles). The subject is located just west of Highway 303 which is the primary thoroughfare and commercial corridor in the area. There is a Walmart located approximately 1.5 miles east in Meadowdale, and both Silverdale and Bremerton contain numerous retail amenities. Bremerton is approximately an hour and fifteen minutes away from Downtown Seattle by either car or ferry, with a higher speed ferry option expected to be available in the upcoming year which would cut the commute time in half. Additional local demand and employment drivers include the Naval Base Kitsap (4.9 miles), Olympic College (4.1 miles), and the Kitsap Mall (2.7 miles).
Bremerton is the largest city on Kitsap Peninsula, which has a total population of 254,438 as of 2015*. Kitsap County comprises the Bremerton-Silverdale, WA Metropolitan Statistical Area, which is also included in the Seattle-Tacoma, WA Combined Statistical Area. Kitsap County ranks 36th in size among Washington counties and is the third most densely populated county in the state of Washington*. The economy of Kitsap County is primarily driven by the Department of Defense and the Naval Base Kitsap which employs over 31,000 employees. Other top employers for the County include Harrison Hospital (2,442 employees), and the Washington State Government (1,746).
* - Per Business Analyst Online (BAO Online)
The Naval Base Kitsap
Operated by the United States Navy, the Naval Base Kitsap is the third-largest Navy base in the U.S and is home to the Navy's West Puget Sound fleet. The base provides support to nuclear submarines and surface ships, including two aircraft carriers, along with being one of only two strategic nuclear weapons facilities. The base is considered highly strategic, and was formed by the merging of the Naval Station Bremerton and the Naval Submarine Base Bangor in 2004. Naval Base Kitsap – Bangor specializes in working with submarines and Naval Base Kitsap – Bremerton specializes in working with surface ships. The Puget Sound Naval Shipyard is connected to Naval Base Kitsap and specializes in major ship and submarine overhauls. Located in between the two bases is Naval Hospital Bremerton, which offers a variety of specialty clinics. The Naval Base Kitsap - Bangor population is 57,496 consisting of Active Duty Military, Civilian Employees, Family Members, and Retirees (1). There are 1,278 housing units on Naval Base Kitsap – Bangor. Naval Base Kitsap – Bremerton provides an additional 41 housing units to the military population. Jackson Park and Naval Base Kitsap – Keyport provide the military with an additional 892 units (2).
The Naval Base Kitsap just recently had more than $90 million approved for multiple improvement projects to be completed in 2018. The base is home to two aircraft carriers, the USS Stennis and the USS Nimitz (3).
(1) - Per Military Installations
(2) - Per Military Installations
(3) - Per the Kitsap Sun
Market Overview
According to the 3Q 2016 Costar Bremerton Apartment market report, Bremerton's two largest job sectors are the Government sector (35.6% of employment) and the Trade, Transportation, and Utilities sector (15.6% of employment). The Government sector added 2,000 jobs over the past six months while the Trade, Transportation, and Utilities sector added 8,000 jobs over the same period of time. According to the September 2016 figures from the Bureau of Labor Statistics, the Bremerton-Silverdale MSA has an unemployment rate of 5.7%. This is slightly higher than the national unemployment rate of 5.0% and state unemployment rate of 5.6% as of September 2016.
According to the 3Q 2016 Costar Bremerton Apartment market report, employment and population growth are both accelerating after years of sluggish growth. Vacancies have compressed as they were aided by supply constraints as well as the release of pent-up demand for housing. The vacancy rate for the market stands at 3.7% and rent growth over the past 12 months (as of the end of Q3) was 11.8% for the market. Average rents for the market are $1,189/unit and the market has a total inventory of 7,946 units. Only 71 units were delivered over the past 12 months.
Submarket Overview
According to the 3Q 2016 Costar Tracyton/Meadowdale Apartment market report, the submarket has experienced effective annual rent growth of 11.6% over the past 12 months and ranks as one of the fastest growing markets in the United States in terms of rent growth. The vacancy rate sits at 2.3% at the end of the third quarter and there were zero units delivered to the submarket over the past 12 months. Ranking third of the seven submarkets, the vacancy rate of 2.3% is below the market average of 3.7% as of the third quarter. Average rents for the submarket are $1,232 /unit, which ranks fourth of the seven submarkets.
Demographic Information
Distance from Property | 1 Mile | 3 Miles | 5 Miles |
---|---|---|---|
Population | 10,580 | 46,825 | 108,292 |
Population Growth (2010-2016) | 10.1% | 5.1% | 3.6% |
Expected Growth (2016-2021) | 2.0% | 1.1% | 0.8% |
Average Household Income | $72,177 | $72,452 | $73,294 |
Median Household Income | $64,932 | $60,340 | $56,890 |
Median Home Value | $195,243 | $225,934 | $236,286 |
Owner Occupied Households | 2,746 | 11,724 | 24,655 |
Renter Occupied Households | 1,244 | 6,908 | 17,311 |
Demographic information above was obtained from CoStar.
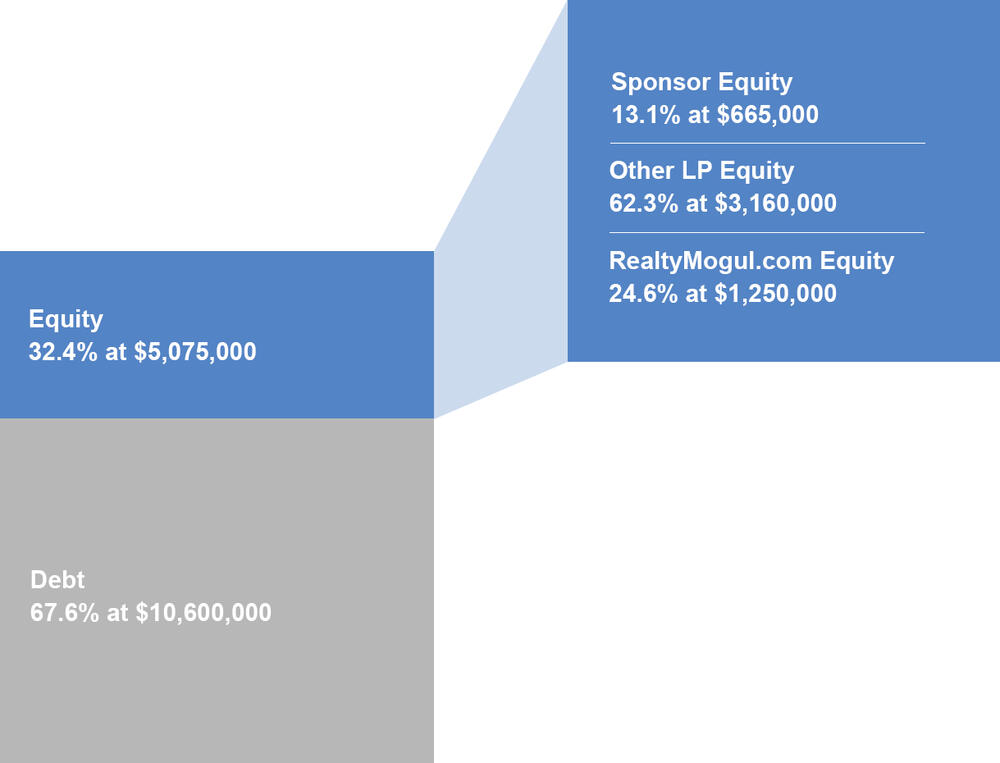
Sources of Funds | Cost |
---|---|
Debt | $10,600,000 |
Equity | $5,075,000 |
Total Sources of Funds | $15,675,000 |
Uses of Funds | Cost |
Purchase Price | $13,100,000 |
Acquisition Fee | $132,500 |
Broker-Dealer Fee | $50,000 |
Other LP Equity Fees | $74,550 |
Capital Expenditure Reserve | $1,836,650 |
Loan Fee & Interest Rate Cap Fee | $152,600 |
Closing Costs & Prepaid Expense Reserves | $328,700 |
Total Uses of Funds | $15,675,000 |
The projected terms of the debt financing are as follows:
- Lender: CBRE
- Loan Type: Agency (Freddie Mac - DUS)
- Proceeds: $10,600,000
- Loan to Cost: 68%
- Term: Seven years
- Rate: One-Month LIBOR plus 291 basis points (3.52% as of November 28, 2016)
- Interest Rate Cap: One-Month LIBOR cap of 3.09%
- Amortization: 30 years
- Interest-Only Period: 24 months
- Recourse: None except bad-boy carve-outs
- Yield Maintenance: Open to prepay after 12 months for a 1% exit fee
There can be no assurance that a lender will provide debt on the rates and terms noted above, or at all. All rates and terms of the debt financing are subject to lender approval, including but not limited to possible increases in capital reserve requirements for funds to be held in a lender controlled capital reserve account.
Fairgrounds Investors, LLC intends to make distributions to investors (Realty Mogul 75, LLC, Other LP investors and Sponsor, collectively, the "Members") as follows:
- To the Members, pari passu, all excess cash flows and appreciation to a 8.0%% IRR to the Members.
- 66.9% / 33.1% (66.9% to the Members, not including the Sponsor / 33.1% to the Sponsor) of excess cash flows and appreciation to a 15.0% IRR to the Members not including the Sponsor.
- 56.9% / 43.1% (56.9% to the Members, not including the Sponsor / 43.1% to the Sponsor) of excess cash flow and appreciation thereafter.
Note that these distributions will occur after the payment of the Company's liabilities (loan payments, operating expenses and other fees as set forth in the LLC agreement, in addition to any member loans or returns due on member loans).
Realty Mogul 75, LLC will distribute 100% of its share of excess cash flow (after expenses and fees) to the members of Realty Mogul 75, LLC (the RealtyMogul.com investors).
Distributions are expected to start in June 2017 and are expected to continue on a quarterly basis thereafter. These distributions are at the discretion of the Sponsor, who may decide to delay distributions for any reason, including maintenance or capital reserves.
Year 1 | Year 2 | Year 3 | Year 4 | Year 5 | |
---|---|---|---|---|---|
Effective Gross Revenue | $1,644,687 | $1,864,535 | $1,978,087 | $2,048,214 | $2,085,793 |
Total Operating Expenses | $775,713 | $795,946 | $818,357 | $843,716 | $859,735 |
Net Operating Income | $868,973 | $1,068,589 | $1,159,730 | $1,204,497 | $1,226,058 |
Annual Debt Service | $401,780 | $449,090 | $655,058 | $676,179 | $690,228 |
Distributions to Realty Mogul 75, LLC Investors | $95,599 | $133,112 | $104,830 | $110,654 | $1,801,914 |
Certain fees and compensation will be paid over the life of the transaction. The following fees and compensation will be paid:
Type of Fee | Amount of Fee | Received By | Paid From | Notes |
One-Time Fees | ||||
---|---|---|---|---|
Acquisition Fee | $132,500 | Sponsor | Capitalized Equity Contribution | 1.01% of the property purchase price |
Broker-Dealer Fee | $50,000 | North Capital (1) | Capitalized Equity Contribution | 4.00% of equity raised by RealtyMogul.com or a minimum of $50,000 |
Other LP Equity Fees | $74,550 | Various non-Sponsor affiliated parties | Capitalized Equity Contribution | 2.36% of equity raised from other LP investors |
Recurring Fees | ||||
Property Management Fee | 4.0% of Effective Gross Income | Sponsor | Distributable Cash | |
Construction Management Fee | 9.0% of Total Rehab Costs | Sponsor | Capital Expenditure Reserve | |
Management and Administrative Fee | 1.0% of amount invested in Realty Mogul 75, LLC | RM Manager, LLC | Distributable Cash | RM Manager, LLC is the Manager of Realty Mogul 75, LLC and a wholly-owned subsidiary of Realty Mogul, Co. (2) |
Notes:
(1) Certain employees of Realty Mogul, Co. are registered representatives of, and are paid commissions by, North Capital Private Securities Corp., a Delaware corporation ("North Capital"). In addition, North Capital pays a technology provider services fee to Realty Mogul, Co. for licensing and access to certain technology, reporting, communications, branding, entity formation and administrative services performed from time to time by Realty Mogul, Co., and North Capital and Realty Mogul, Co. are parties to a profit sharing arrangement.
(2) Fees may be deferred to reduce impact to investor distributions.
The above presentation is based upon information supplied by the Sponsor or others. Realty Mogul, Co., RM Manager, LLC, and Realty Mogul 75, LLC, along with their respective affiliates, officers, directors or representatives (the "RM Parties") hereby advise you that none of them has independently confirmed or verified any of the information contained herein. The RM Parties further make no representations as to the accuracy or completeness of any such information and undertake no obligation now or in the future to update or correct this presentation or any information contained herein.
RM Securities, LLC, its registered representatives, affiliates, associated persons, and personnel of its affiliates who may also be associated with it, including our associated persons and personnel of our affiliates who are also be associated with RM Securities, LLC (it (“RM Securities,” “we,” “our,” or “us”) will receive fees, expense reimbursements, and other compensation (“Fees”) from the issuer of this investment offering, its sponsor, or an affiliate thereof (“Sponsor”), or otherwise in connection with Sponsor’s offering. The Fees paid to us are in addition to other fees you will pay to Sponsor or in connection with Sponsor’s investment offering. You will pay Fees to Sponsor, either directly or indirectly as an investor in the Sponsor’s offering. Sponsor will use the Fees you pay, as well as funds you invest in the relevant offering, to compensate us. The Fees paid to us will directly or indirectly be borne by you as the investor (typically, but not always, in the form of an expense of the Sponsor’s offering in which you invest) because such Fees will reduce the proceeds available for distribution to you and reduce the amount you earn over time.
For more information on the Fees paid to us, or any other Fees you will pay in connection with Sponsor’s offering, please carefully review the Sponsor’s Investment Documents. Please also carefully review RM Securities’ Form CRS, Regulation Best Interest Disclosures, and Limited Brokerage Services Agreement.
No Approval, Opinion or Representation, or Warranty by RM Securities, LLCSponsor has provided, approved, and is solely responsible in all aspects for the information on this webpage (“Page”), including Sponsor’s offering documentation, which may include without limitation the Private Placement Memorandum, Operating or Limited Partnership Agreement, Subscription Agreement, the Project Summary and all exhibits and other documents attached thereto or referenced therein (collectively, the “Investment Documents”). The Investment Documents linked on this page have been prepared and posted by Sponsor, and not by RM Securities. We did not assist in preparing, do not adopt or endorse, and we are not otherwise responsible for, the Sponsor’s Investment Documents. We make no representations or warranties as to the accuracy of information on this Page or in the Sponsor’s Investment Documents and we accept no liability therefor. No part of the information on this Page or in the Sponsor’s Investment Documents is intended to be binding on us.
Sponsor’s Information Qualified by Investment DocumentsThe information on this Page is qualified in its entirety by reference to the more complete information about the offering contained in the Sponsor’s Investment Documents. The information on this Page is not complete and subject to change at the Sponsor’s discretion at any time up to the closing date. The Sponsor’s Investment Documents and supplements thereto contain important information about the Sponsor’s offering including relevant investment objectives, the business plan, risks, charges, expenses, and other information, which you should consider carefully before investing. The information on this Page should not be used as a basis for an investor’s decision to invest.
Risk of InvestmentThis investment is speculative, highly illiquid, and involves substantial risk. There can be no assurances that all or any of Sponsor’s assumptions, expectations, estimates, goals, hypothetical illustrations, or other aspects of Sponsor’s business plans (“Assumptions”) will be true or that actual performance will bear any relation to Sponsor’s Assumptions, and no guarantee or representation is made that Sponsor’s Assumptions will be achieved. If Sponsor does not achieve its Assumptions, your investment could be materially and adversely affected. A loss of part or all of the principal value of your investment may occur. You should not invest unless you can readily bear the consequences of such loss. Sponsor’s Assumptions should not be relied upon as the primary basis for your decision to invest.
No Reliance on Forward-Looking Statements; Sponsor AssumptionsSponsor is solely responsible for statements made concerning forward-looking statements and Assumptions, which apply only as of the date made, are preliminary and subject to change, and are expressly qualified in their entirety by the disclosures and cautionary statements included in Sponsor’s Investment Documents, which you should carefully review. Neither RM Securities nor Sponsor are obligated to update or revise such forward-looking statements or Assumptions to reflect events or circumstances that arise after the date made or to reflect the occurrence of unanticipated events. Sponsor’s forward-looking statements and Assumptions are hypothetical, not based on actual investment achievements or events, and are presented solely for purposes of providing insight into the Sponsor’s investment objectives, detailing Sponsor’s anticipated risk and reward characteristics, and establishing a benchmark for future evaluation of actual results; therefore, they are not a predictor, projection, or guarantee of future results. You should not rely on Sponsor’s forward-looking statements as a basis to invest.
Importantly, we do not adopt, endorse, or provide any assurance of returns or as to the accuracy or reasonableness of Sponsor’s Assumptions or forward-looking statements.
No Reliance on Past PerformanceAny description of past performance is not a reliable indicator of future performance and should not be relied upon as the primary basis to invest.
Sponsor’s Use of DebtA substantial portion of the total cost of the real estate asset acquired by the Sponsor with investor funds (“Property”) will be paid with borrowed funds, i.e., debt. Sponsor’s estimated rates and terms of the debt financing are subject to lender approval, and there is no assurance that the Sponsor will secure debt at the rates and terms presented on this Page or in the Sponsor’s Investment Documents, or at all. The use of borrowed money to acquire real estate is referred to as leveraging, which can amplify losses and could result in lender foreclosure. In addition, if the debt includes a variable (or “floating”) interest rate, the total amount of interest paid over the term of the debt will fluctuate and can increase. As a result, Sponsor’s use of debt can result in a loss of some or all of your investment.
Sponsor’s Offering is Not RegisteredSponsor’s securities offering will not be registered under the Securities Act of 1933, as amended (the “Securities Act”), in reliance upon the exemptions from registration pursuant to Rule 506(c) of Regulation D as promulgated under the Securities Act (“Private Placement”). In addition, the offering will not be registered under any state securities laws in reliance on exemptions from state registration. Such securities (your ownership interests) are subject to restrictions on transferability and resale and may not be transferred or resold except as permitted under applicable state and federal securities laws pursuant to registration or an available exemption. All Private Placements on the Platform are intended solely for “Accredited Investors,” as that term is defined in Rule 501(a) under the Securities Act.
No Investment AdviceNothing on this Page should be regarded as investment advice (either with respect to a particular security or regarding an overall investment strategy), a recommendation, an offer to sell, or a solicitation of or an offer to buy any security. Advice from a securities professional is strongly advised to understand and assess the risks associated with real estate or private placement investments. For additional information on RM Securities’ involvement in this offering, please carefully review the Sponsor’s Investment Documents, and RM Securities’ Form CRS, Regulation Best Interest Disclosures, and Limited Brokerage Services Agreement.
1031 Exchange RiskInternal Revenue Code Section 1031 (“Section 1031”) contains complex tax concepts and certain tax consequences may vary depending on the individual circumstances of each investor. RM Securities and its affiliates make no representation or warranty of any kind with respect to the tax consequences of your investment or that the IRS will not challenge any such treatment. You should consult with and rely on your own tax advisor about the tax aspects with respect to your particular circumstances.