Inception Investors is a private real estate investment and operating company that was founded in 2012. The company is headquartered in New York City and has offices in Brooklyn and Manhattan.
The Sponsor’s investment strategy is to acquire properties with attractive growth potential through either a combination of active property and asset management and market growth. They generally target cash flowing Class-B multifamily and give key consideration to the following criteria:
- Gentrifying Tri-state area markets with high population density and strong market fundamentals.
- Capitalize on shifts in demographic trends and property investments that include an increased preference for urban living by baby boomers, millennials, and young professionals as well as assets that are in close proximity to transit or places of employment.
The Sponsor is an affiliated entity to The Clairmont Group – the same sponsor who transacted on the 23-Unit New Jersey Multifamily deal with RealtyMogul.com in March 2016. Two of the three principals with Inception are also principals of the Clairmont Group. The two companies share asset management, accounting, and back office operations and invest together as principals, so it truly is one company at this time. They have maintained their respective names due to legacy and relationship reasons.
Sponsor Track Record (includes transactions the management team completed as Principals of other firms prior to joining Clairmont and Inception Investors)
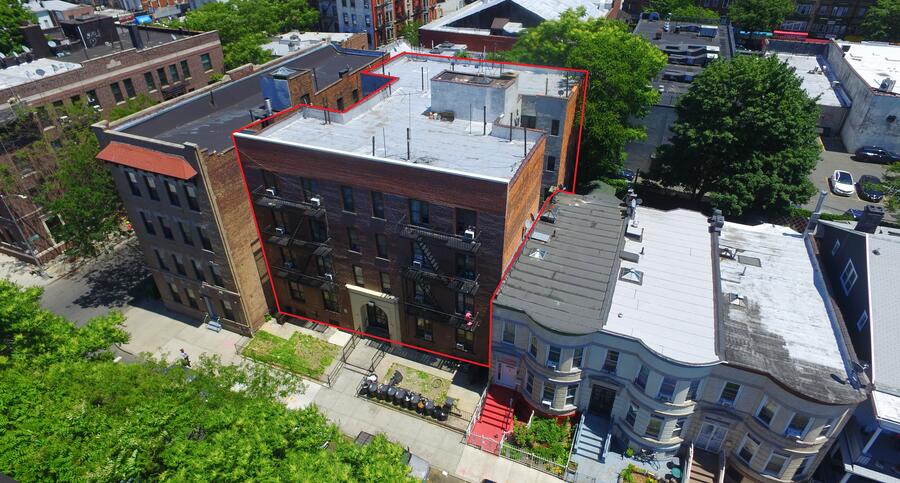
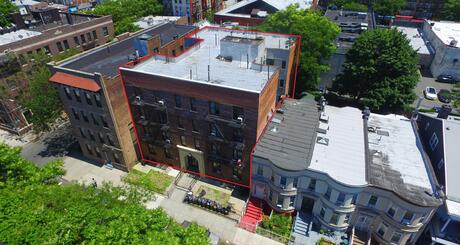
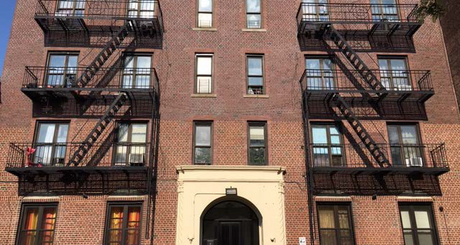
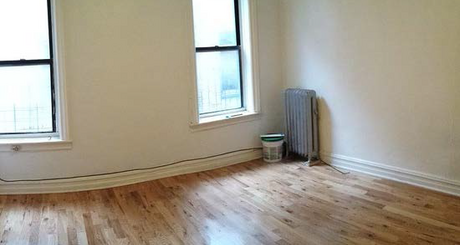
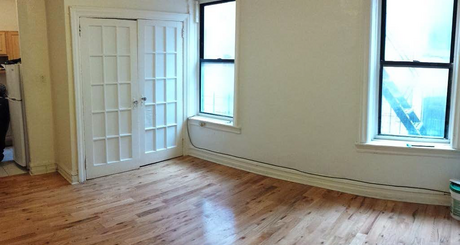
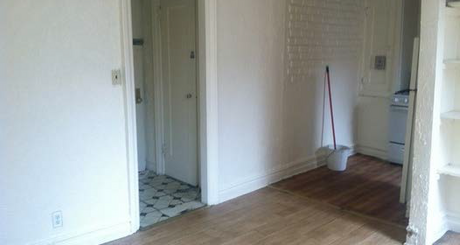
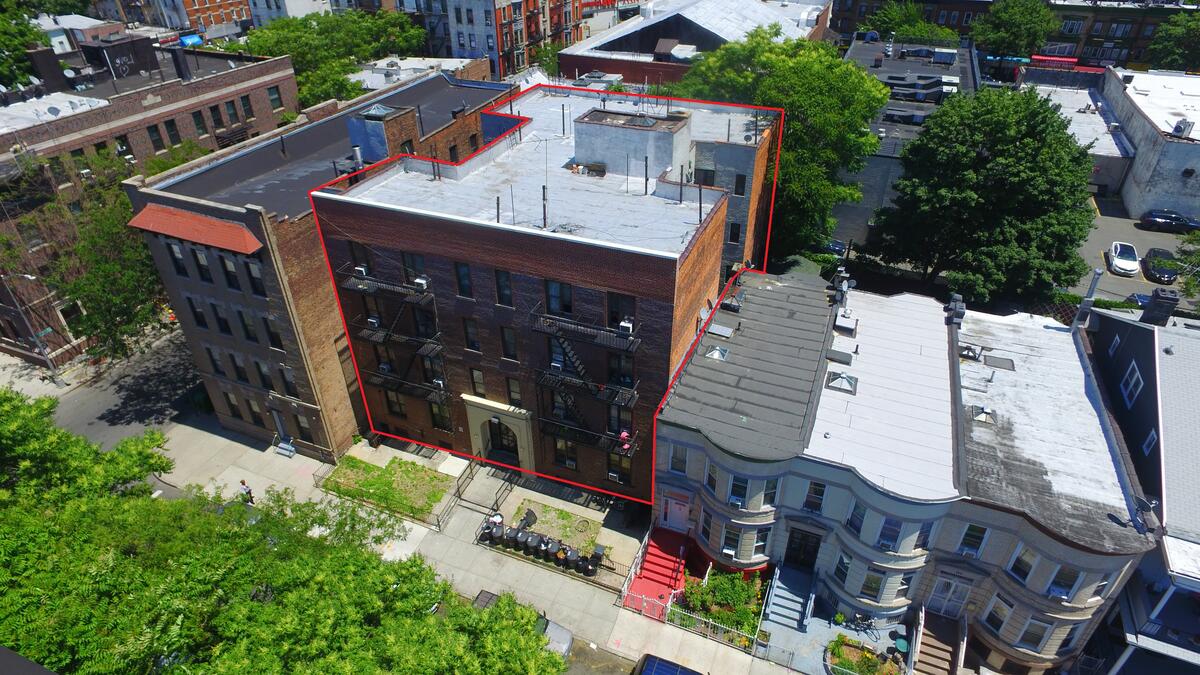
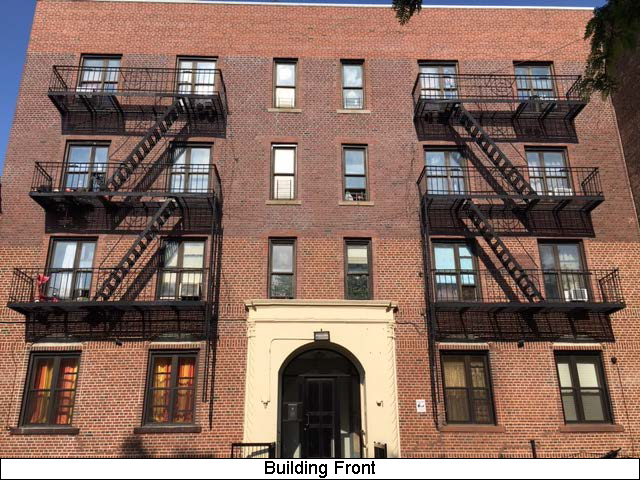
The Property is a 27-unit walk-up building located at 330 E. 22nd Street in the Flatbush neighborhood of Brooklyn, NY. The Property was built in 1926 and is currently 93% leased. The unit mix consists of six 2-bedroom units, twenty 3-bedroom units, and one 4-bedroom unit. Average in-place rents are $1,053 per unit, ranging from $743 per unit to $1,450 per unit. Due to the rent stabilized nature of the units, in-place rents are currently below the similar properties in the neighborhood.
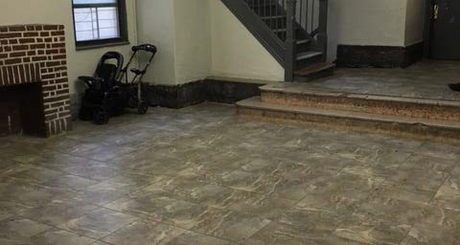
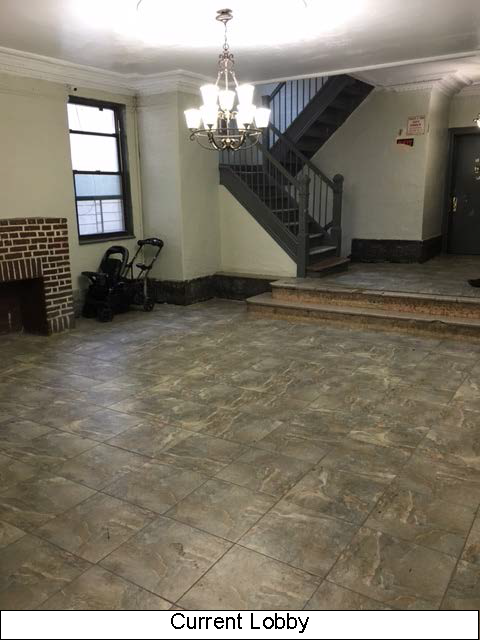
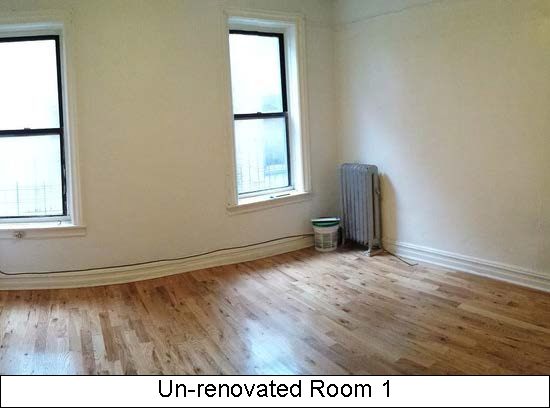
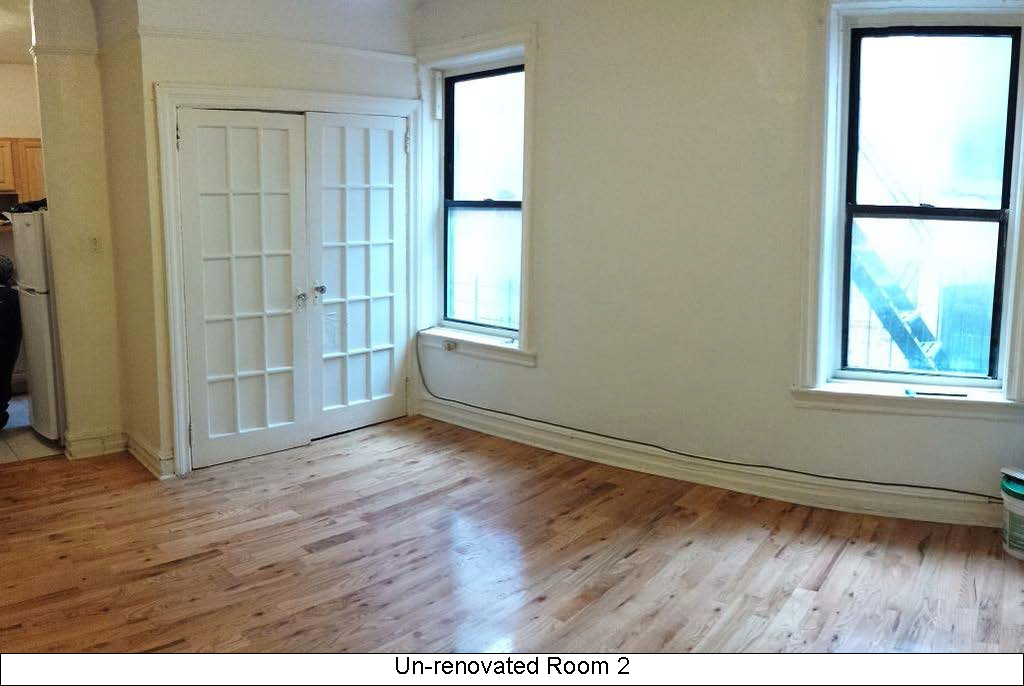
The current amenities at the property are consistent with those of buildings constructed in that era. Recently completed common area and building improvements by the current owner include: a new roof, electric paneling, masonry repairs, pointing, new hot water heater, security doors, and a new TV/security system. The sponsor’s proposed renovations should bring the units and building in-line with modern amenities found in newer construction.
Unit Mix
| Unit Type | # of Units | Avg In-Place Rent/Unit |
| 2/1 | 6 | 1,156 |
| 3/1.5 | 20 | 1,016 |
| 4/2 | 1 | 1,175 |
| Total | 27 | 1,053 |
| Pre-Renovation Rental Comparables | Subject | 835 Ocean Ave | 1135 Flatbush Ave | 1140 Flatbush Ave | 2112 Dorchester Rd | Total / Averages |
| 2/1 | $1,156 | $1,750 | - | - | - | $1,750 |
| 3/1.5 | $1,166 | - | $1,800 | $1,795 | $1,750 | $1,782 |
| Location Relative to Subject | SW | S | SW | SW | - | |
| Blocks From Subject | - | 3 | 1 | 1 | 2 | 2 |
| Post-Renovation Rental Comparables | Subject | 447 E 21st | 252 E 23rd Street | 1137 Flatbush Ave | 1066 Flatbush | 2503 Clarendon |
| 2/1 | $1,456 | - | - | - | - | $2,500 |
| 3/1.5 | $1,616 | $2,500 | $2,100 | $2,075 | $2,300 | - |
| 4/2 | $1,675 | - | - | - | - | - |
| Location Relative to Subject | - | E | E | S | NW | E |
| Blocks From Subject | - | 2 | 1 | 1 | 2 | 3 |
| 2434 Bedford Ave | 711 Ocean Ave | 810 Ocean Ave | 2395 Bedford Ave | 2149 Cortelyou Rd | Total / Averages | |
| 2/1 | $2,000 | $2,250 | - | $1,850 | $1,700 | $2,060 |
| 3/1.5 | - | - | $2,610 | $2,317 | ||
| 4/2 | - | - | $2,900 | $2,900 | ||
| Location Relative to Subject | E | NW | W | NE | N | - |
| Blocks From Subject | 2 | 5 | 2 | 3 | 0 | 2 |
Source: Zillow/Costar
| Sales Comparables | Subject | 485 E 21st St | 2505 Bedford Ave | 531 E 22nd St | 17 East 17th St | 398 E 18th St | Total / Averages |
| Date | June-16 | April-15 | December-15 | January-16 | June-15 | May-15 | |
| # of Units | 27 | 28 | 48 | 35 | 20 | 16 | 29 |
| Year Built | 1926 | 1922 | 1931 | 1934 | 1931 | 1927 | 1929 |
| Average SF (per bed) | 711 | 893 | 775 | 1,026 | 773 | 1,094 | 912 |
| Purchase Price | $4,750,000 | $5,025,000 | $8,550,000 | $7,000,000 | $4,900,000 | $3,250,000 | $6,436,054 |
| $/Unit | $175,926 | $179,464 | $178,125 | $200,000 | $245,000 | $203,125 | $201,162 |
| Cap Rate | 5.32% | N/A | 4.00% | N/A | 4.10% | 4.50% | 4.20% |
| Location Relative to Subject | - | SW | SE | SW | NW | W | |
| Blocks from Subject | - | 2 | 3 | 6 | 9 | 5 | 5 |
Source: RCA/Costar
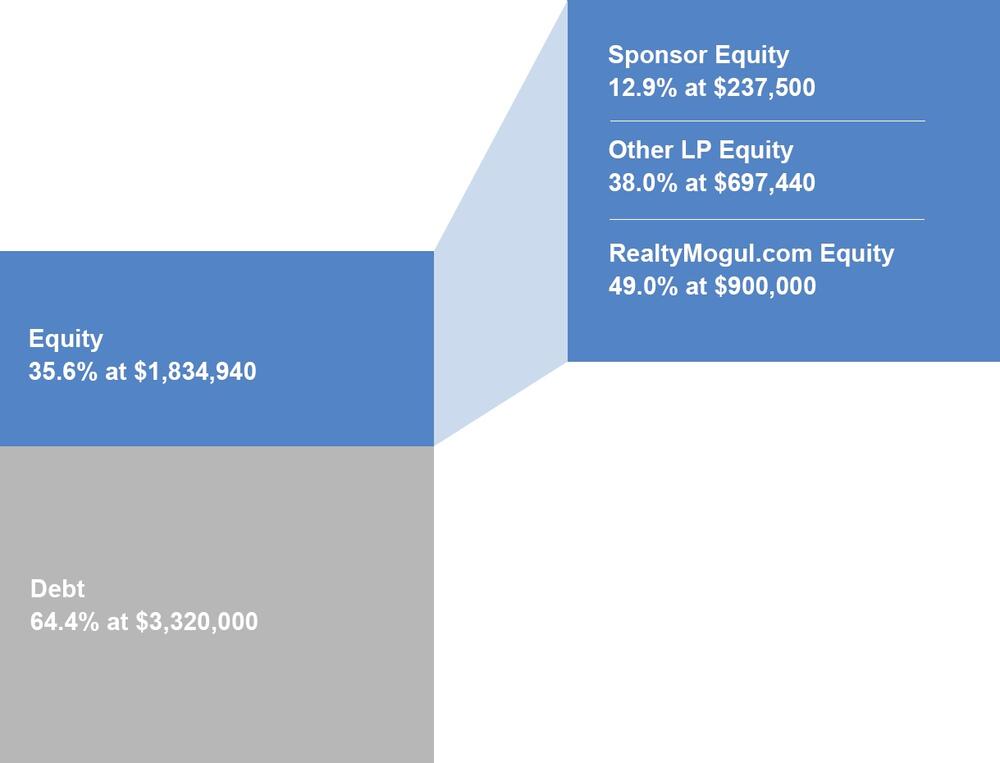
| Total Capitalization | |
| Sources of Funds | |
| Senior Loan | $3,320,000 |
| Equity | $1,834,940 |
| Total Sources of Funds | $5,154,940 |
| Uses of Funds | |
| Purchase Price | $4,750,000 |
| Cap Ex Reserves | $160,000 |
| Closing Costs | $164,940 |
| Broker Dealer Placement Fee | $40,000 |
| Sponsor Acquisition Fee | $40,000 |
| Total Uses of Funds | $5,154,940 |
The projected terms of the debt financing are as follows:
- Lender: Oritani Finance Company
- Principal Balance: $3,320,000
- Term: 36 months
- Extension Term: 36 months (RM assumes Sponsor executes)
- Rate: 2.75%. Initial 3-year term at the greater of i) the Federal Home Loan Bank of New York (FHLB) Amortizing Advance Indication for 3-Year Final Maturities plus 125 basis points and ii) 2.75%
- Rate on Extension Term: The interest rate shall reset to the then current FHLB New York 3-year Fixed Rate Advance plus 125 basis points, subject to a floor of 2.75%.
- Interest Only: 12 months
- Amortization: 29 years thereafter
- Loan to Cost: 64%
- Loan to Purchase Price: 70%
- Prepayment Penalty: 3%, 2%, 1% last 90 days open, resets after 3 year initial loan term
- Reserves: Borrower will fund a reserve account of $48,000 from either 1) loan proceeds or 2) a monthly contribution of $4,000 for the renovation of vacated units
Realty Mogul has underwritten that the Sponsor exercises their 3-year option to extend the initial loan term.
There can be no assurance that a lender will provide debt on the rates and terms noted above, or at all. All rates and terms of the debt financing are subject to lender approval, including but not limited to possible increases in capital reserve requirements for funds to be held in a lender controlled capital reserve account.
Order of Distributions to Realty Mogul 67, LLC (Operating Income, Sale or Refinance)
- First, to investors for any accumulated unpaid preferred return
- Second, a cumulative non-compounded 7% annual preferred return
- Then, any excess balance will be split 75% to members pari passu and 25% to Sponsor
Realty Mogul 67, LLC will distribute 100% of its share of excess cash flow (after expenses) to the members of Realty Mogul 67, LLC (the RealtyMogul.com investors). The manager of Realty Mogul 67, LLC will receive a portion (up to 10%) of the Sponsor's promote interest.
Distributions are projected to start in December 2016 and are projected to continue on a quarterly basis thereafter. These distributions are at the discretion of the Sponsor, who may decide to delay distributions for any reason, including maintenance or capital reserves.
| Cash Flow Projections | |||||
| Year 1 | Year 2 | Year 3 | Year 4 | Year 5 | |
| Effective Gross Revenue | $417,698 | $439,164 | $460,131 | $483,264 | $497,762 |
| Total Operating Expenses | $157,125 | $162,108 | $167,299 | $172,709 | $177,891 |
| Net Operating Income | $260,573 | $277,056 | $292,832 | $310,555 | $319,872 |
| Distributions to Realty Mogul 67, LLC Investors | $61,419 | $36,338 | $44,075 | $52,768 | $1,431,081 |
Certain fees and compensation will be paid over the life of the transaction. The following fees and compensation will be paid:
| Type of Fee | Amount of Fee | Received By | Paid From | Notes |
| One-Time Fees: | ||||
|---|---|---|---|---|
| Acquisition Fee | $40,000 | Sponsor | Capitalized Equity Contribution | $40,000 fixed |
| Broker-Dealer Fee | $40,000 | North Capital (1) | Capitalized Equity Contribution | $40,000 fixed |
| Recurring Fees: | ||||
|
Asset Management Fee |
$10,000 annually | Sponsor | Operating Cash Flow | $10,000 fixed annually |
| Property Management Fee | 4.0% of monthly gross rental receipts | Sponsor | Operating Cash Flow | 4.0% of monthly gross rental receipts |
| Management and Administrative Fee | 1.0% of amount invested in Realty Mogul 67, LLC | RM Manager, LLC | Distributable Cash | RM Manager, LLC is the Manager of Realty Mogul 67, LLC and a wholly-owned subsidiary of Realty Mogul, Co. (2) |
Notes:
(1) Certain employees of Realty Mogul, Co. are registered representatives of, and are paid commissions by, North Capital Private Securities Corp., a Delaware corporation ("North Capital"). In addition, North Capital pays a technology provider services fee to Realty Mogul, Co. for licensing and access to certain technology, reporting, communications, branding, entity formation and administrative services performed from time to time by Realty Mogul, Co., and North Capital and Realty Mogul, Co. are parties to a profit sharing arrangement.
(2) Fees may be deferred to reduce impact to investor distributions
The above presentation is based upon information supplied by the Sponsor or others. Realty Mogul, Co., RM Manager, LLC, and Realty Mogul 67, LLC, along with their respective affiliates, officers, directors or representatives (the "RM Parties") hereby advise you that none of them has independently confirmed or verified any of the information contained herein. The RM Parties further make no representations as to the accuracy or completeness of any such information and undertake no obligation now or in the future to update or correct this presentation or any information contained herein.
RM Securities, LLC, its registered representatives, affiliates, associated persons, and personnel of its affiliates who may also be associated with it, including our associated persons and personnel of our affiliates who are also be associated with RM Securities, LLC (it (“RM Securities,” “we,” “our,” or “us”) will receive fees, expense reimbursements, and other compensation (“Fees”) from the issuer of this investment offering, its sponsor, or an affiliate thereof (“Sponsor”), or otherwise in connection with Sponsor’s offering. The Fees paid to us are in addition to other fees you will pay to Sponsor or in connection with Sponsor’s investment offering. You will pay Fees to Sponsor, either directly or indirectly as an investor in the Sponsor’s offering. Sponsor will use the Fees you pay, as well as funds you invest in the relevant offering, to compensate us. The Fees paid to us will directly or indirectly be borne by you as the investor (typically, but not always, in the form of an expense of the Sponsor’s offering in which you invest) because such Fees will reduce the proceeds available for distribution to you and reduce the amount you earn over time.
For more information on the Fees paid to us, or any other Fees you will pay in connection with Sponsor’s offering, please carefully review the Sponsor’s Investment Documents. Please also carefully review RM Securities’ Form CRS, Regulation Best Interest Disclosures, and Limited Brokerage Services Agreement.
No Approval, Opinion or Representation, or Warranty by RM Securities, LLCSponsor has provided, approved, and is solely responsible in all aspects for the information on this webpage (“Page”), including Sponsor’s offering documentation, which may include without limitation the Private Placement Memorandum, Operating or Limited Partnership Agreement, Subscription Agreement, the Project Summary and all exhibits and other documents attached thereto or referenced therein (collectively, the “Investment Documents”). The Investment Documents linked on this page have been prepared and posted by Sponsor, and not by RM Securities. We did not assist in preparing, do not adopt or endorse, and we are not otherwise responsible for, the Sponsor’s Investment Documents. We make no representations or warranties as to the accuracy of information on this Page or in the Sponsor’s Investment Documents and we accept no liability therefor. No part of the information on this Page or in the Sponsor’s Investment Documents is intended to be binding on us.
Sponsor’s Information Qualified by Investment DocumentsThe information on this Page is qualified in its entirety by reference to the more complete information about the offering contained in the Sponsor’s Investment Documents. The information on this Page is not complete and subject to change at the Sponsor’s discretion at any time up to the closing date. The Sponsor’s Investment Documents and supplements thereto contain important information about the Sponsor’s offering including relevant investment objectives, the business plan, risks, charges, expenses, and other information, which you should consider carefully before investing. The information on this Page should not be used as a basis for an investor’s decision to invest.
Risk of InvestmentThis investment is speculative, highly illiquid, and involves substantial risk. There can be no assurances that all or any of Sponsor’s assumptions, expectations, estimates, goals, hypothetical illustrations, or other aspects of Sponsor’s business plans (“Assumptions”) will be true or that actual performance will bear any relation to Sponsor’s Assumptions, and no guarantee or representation is made that Sponsor’s Assumptions will be achieved. If Sponsor does not achieve its Assumptions, your investment could be materially and adversely affected. A loss of part or all of the principal value of your investment may occur. You should not invest unless you can readily bear the consequences of such loss. Sponsor’s Assumptions should not be relied upon as the primary basis for your decision to invest.
No Reliance on Forward-Looking Statements; Sponsor AssumptionsSponsor is solely responsible for statements made concerning forward-looking statements and Assumptions, which apply only as of the date made, are preliminary and subject to change, and are expressly qualified in their entirety by the disclosures and cautionary statements included in Sponsor’s Investment Documents, which you should carefully review. Neither RM Securities nor Sponsor are obligated to update or revise such forward-looking statements or Assumptions to reflect events or circumstances that arise after the date made or to reflect the occurrence of unanticipated events. Sponsor’s forward-looking statements and Assumptions are hypothetical, not based on actual investment achievements or events, and are presented solely for purposes of providing insight into the Sponsor’s investment objectives, detailing Sponsor’s anticipated risk and reward characteristics, and establishing a benchmark for future evaluation of actual results; therefore, they are not a predictor, projection, or guarantee of future results. You should not rely on Sponsor’s forward-looking statements as a basis to invest.
Importantly, we do not adopt, endorse, or provide any assurance of returns or as to the accuracy or reasonableness of Sponsor’s Assumptions or forward-looking statements.
No Reliance on Past PerformanceAny description of past performance is not a reliable indicator of future performance and should not be relied upon as the primary basis to invest.
Sponsor’s Use of DebtA substantial portion of the total cost of the real estate asset acquired by the Sponsor with investor funds (“Property”) will be paid with borrowed funds, i.e., debt. Sponsor’s estimated rates and terms of the debt financing are subject to lender approval, and there is no assurance that the Sponsor will secure debt at the rates and terms presented on this Page or in the Sponsor’s Investment Documents, or at all. The use of borrowed money to acquire real estate is referred to as leveraging, which can amplify losses and could result in lender foreclosure. In addition, if the debt includes a variable (or “floating”) interest rate, the total amount of interest paid over the term of the debt will fluctuate and can increase. As a result, Sponsor’s use of debt can result in a loss of some or all of your investment.
Sponsor’s Offering is Not RegisteredSponsor’s securities offering will not be registered under the Securities Act of 1933, as amended (the “Securities Act”), in reliance upon the exemptions from registration pursuant to Rule 506(c) of Regulation D as promulgated under the Securities Act (“Private Placement”). In addition, the offering will not be registered under any state securities laws in reliance on exemptions from state registration. Such securities (your ownership interests) are subject to restrictions on transferability and resale and may not be transferred or resold except as permitted under applicable state and federal securities laws pursuant to registration or an available exemption. All Private Placements on the Platform are intended solely for “Accredited Investors,” as that term is defined in Rule 501(a) under the Securities Act.
No Investment AdviceNothing on this Page should be regarded as investment advice (either with respect to a particular security or regarding an overall investment strategy), a recommendation, an offer to sell, or a solicitation of or an offer to buy any security. Advice from a securities professional is strongly advised to understand and assess the risks associated with real estate or private placement investments. For additional information on RM Securities’ involvement in this offering, please carefully review the Sponsor’s Investment Documents, and RM Securities’ Form CRS, Regulation Best Interest Disclosures, and Limited Brokerage Services Agreement.
1031 Exchange RiskInternal Revenue Code Section 1031 (“Section 1031”) contains complex tax concepts and certain tax consequences may vary depending on the individual circumstances of each investor. RM Securities and its affiliates make no representation or warranty of any kind with respect to the tax consequences of your investment or that the IRS will not challenge any such treatment. You should consult with and rely on your own tax advisor about the tax aspects with respect to your particular circumstances.