


StarPoint Properties is a real estate investment and operating company with a 25-year+ track record. Founded in 1995 and headquartered in Beverly Hills, StarPoint aims to outperform other alternative investment vehicles by leveraging its seasoned management team, proprietary underwriting systems, decades of developed infrastructure, and deep acquisition network. With a focus on the acquisition, development, and redevelopment of under-valued multifamily and commercial properties, StarPoint has delivered a weighted average IRR of 24.6% to investors since inception.
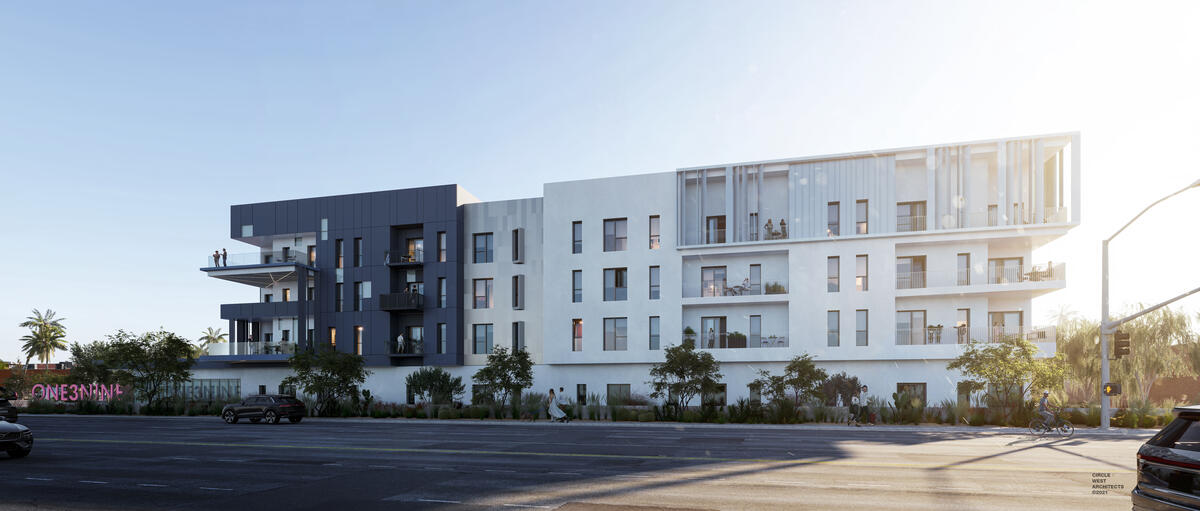
The Project, located near the intersection of Dobson Road and Main Street, is situated only one mile away from the SR-101 freeway and a five-minute walk from a Metro light-rail stop. Site work, including demolition, utility infrastructure, and grading completed in Q2 2023, with the Project exit expected in early 2025.
Unit Mix
| Unit Type | # of Units | Avg SF/Unit | $ / Unit | $ / SF |
| Studio | 28 | 568 | $1,690 | $2.98 |
| 1x1 | 124 | 751 | $1,843 | $2.45 |
| 2x2 | 93 | 1,033 | $2,190 | $2.12 |
| Total/Averages | 245 | 837 | $1,957 | $2.34 |
Lease Comparables
| Metro 101 | Cadia Crossing | The Retreat at Rio Salado | Skye at McClintock Station | Volta on Broadway | Averages | Subject | |
| Year Built | 2019 | 2017 | 2020 | 2017 | 2016 | 2018 | 2024 |
| # of Units | 259 | 256 | 276 | 423 | 194 | 282 | 245 |
| Average Rental Rate | $2,175 | $1,955 | $1,932 | $1,962 | $1,991 | $2,003 | $1,928 |
| Average Unit Size | 781 | 1,034 | 893 | 914 | 940 | 912 | 837 |
| Average $/SF | $2.78/SF | $1.89/SF | $2.16/SF | $2.15/SF | $2.12/SF | $2.22/SF | $2.30/SF |
| Levels | 4 | 4 | 4 | 4 | 4 | 4 | |
| Occupancy | 92.00% | 95.00% | 95.00% | 95.00% | 94.00% | 94.20% | |
| Distance from subject | 1.2 mi | 7.5 mi | 1.2 mi | 2.0 mi | 2.7 mi | 2.9 mi | |
| $/Unit (Studio) | $1,941 | - | $1,539 | - | $1,654 | $1,711 | $1,654 |
| SF (Studio) | 522 SF | - | 582 SF | - | 738 SF | 614 SF | 568 SF |
| $/SF (Studio) | $3.72/SF | - | $2.64/SF | - | $2.24/SF | $2.87/SF | $2.91/SF |
| $/Unit (1x1) | $2,078 | $1,702 | $1,713 | $1,725 | $1,863 | $1,816 | $1,809 |
| SF (1x1) | 699 SF | 738 SF | 755 SF | 735 SF | 738 SF | 733 SF | 751 SF |
| $/SF (1x1) | $2.97/SF | $2.31/SF | $2.27/SF | $2.35/SF | $2.52/SF | $2.48/SF | $2.41/SF |
| $/Unit (2x2) | $2,325 | $2,138 | $2,341 | $2,195 | $2,316 | $2,263 | $2,171 |
| SF (2x2) | 1,276 SF | 1,088 SF | 1,113 SF | 1,058 SF | 1,033 SF | 1,114 SF | 1,033 SF |
| $/SF (2x2) | $1.82/SF | $1.97/SF | $2.10/SF | $2.07/SF | $2.24/SF | $2.04/SF | $2.10/SF |
Sales Comparables
| Seventyone15 McDowell | Craft at Gilbert & Baseline | Hudson on Farmer | Sentral Old Town | Roadrunner on McDowell | Averages | Subject | |
| Date Sold | Oct-22 | Jun-22 | May-22 | Apr-22 | Feb-22 | 2024 | |
| Year Built | 2022 | 2018 | 2021 | 2021 | 2021 | 2021 | 2024 |
| # of Units | 274 | 104 | 171 | 160 | 356 | 213 | 245 |
| Average Unit Size | 860 SF | 1018 SF | 853 SF | 968 SF | 828 SF | 905 SF | 837 SF |
| Sale Price | $150,000,000 | $45,000,000 | $96,000,000 | $121,000,000 | $193,500,000 | $121,100,000 | $99,386,265 |
| $/Unit | $547,445 | $432,692 | $561,404 | $756,250 | $543,539 | $568,266 | $405,658 |
| $/SF | $637 | $425 | $658 | $781 | $656 | $631 | $485 |
| Cap Rate | 5.00% | ||||||
| Building Size | 235,640 SF | 105,872 SF | 145,863 SF | 154,880 SF | 294,768 SF | 187,405 SF | 205,009 SF |
| Distance from subject | 6.9 mi | 7.9 mi | 4.4 mi | 10.0 mi | 7.5 mi | 7.3 mi |
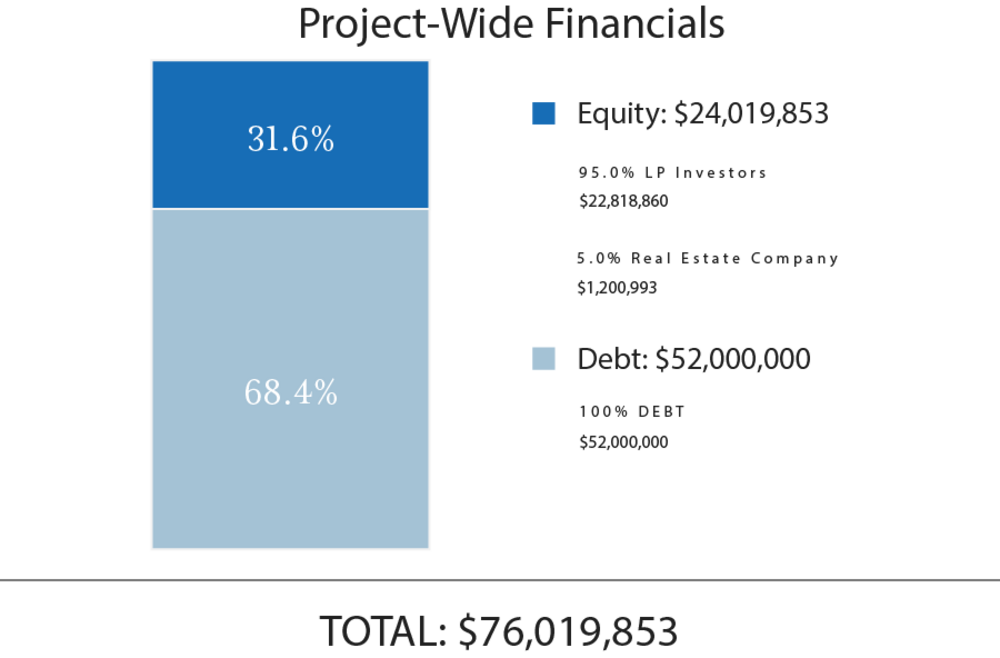
Total Project Capitalization
| Sources of Funds | $ Amount | $/Unit |
| Debt | $52,000,000 | $212,245 |
| GP Investor Equity(3) | $1,200,993 | $4,902 |
| LP Equity | $22,818,860 | $93,138 |
| Total Sources of Funds | $76,019,853 | $310,285 |
| Uses of Funds | $ Amount | $/Unit |
| Land Acquisition Price | $7,100,000 | $28,980 |
| Development Fee | $1,959,043 | $7,996 |
| Loan Fee | $676,000 | $2,759 |
| Closing Costs | $461,333 | $1,883 |
| Hard Costs | $50,231,871 | $205,028 |
| Soft Costs | $6,526,435 | $26,639 |
| Financing Costs | $563,117 | $2,298 |
| Other Costs | $8,502,055 | $34,702 |
| Total Uses of Funds | $76,019,854 | $310,285 |
(3) The Sponsor’s equity contribution may consist of friends and family equity and equity from funds controlled by the Sponsor.
The expected terms of the debt financing for the Project are as follows:
- Lender: Stonehill Strategic Capital
- Term: 3 Years
- LTC: 68.4%
- Estimated Proceeds: $52,000,000
- Interest Type: Floating
- Annual Interest Rate: The greater of (i) SOFR + 7.50% and (ii) 11.50%
- Interest-only Period: Full Term
- Amortization: N/A
- Prepayment Terms: $5,000,000 of minimum interest on the total loan commitment shall be due to Lender
- Extension Requirements: 1 twelve (12) month extension; 50 bp extension fee.
- Modeled Refinance: No
(4) A substantial portion of the total acquisition of the Property will be paid with borrowed funds, i.e., debt. Please carefully review the Disclaimers section below for additional information concerning the Sponsor's use of debt.
The Manager intends to make distributions as follows:
- To the Investors, pari passu, all operating cash flows to a 10.0% IRR;
- 80% / 20% (80% to Investors / 20% to Promoted/Carried Interest) of excess cash flow to a 14.0% IRR;
- 70% / 30% (70% to Investors / 30% to Promote/Carried Interest) of excess cash flow thereafter.
The Manager intends to make distributions to investors after the payment of the company's liabilities (loan payments, operating expenses, and other fees as more specifically set forth in the Offering Documentation, in addition to any member loans or returns due on member loans). Distributions are at the discretion of the Manager, who may decide to delay distributions for any reason, including maintenance or capital reserves.
The Manager will receive a promoted/carried interest as indicated above.
| Project-Level Cash Flows | ||||||
| Year 0 | Year 1 | Year 2 | Year 3(5) | |||
| Net Cash Flow | ($24,019,853) | $0 | $0 | $45,756,811 | ||
| Cash Flows to Investors via RM Platform(6) | ||||||
| Year 0 | Year 1 | Year 2 | Year 3(5) | |||
| Net Cash Flow | ($10,305,556) | $0 | $0 | $17,327,090 | ||
| Cash Flows to Investors via RM Platform - Hypothetical $50,000 Investment(6) | ||||||
| Year 0 | Year 1 | Year 2 | Year 3(5) | |||
| Net Cash Flow | ($50,000) | $0 | $0 | $84,067 | ||
(5) Stub year of one month
(6) RM Technologies, LLC and its affiliates do not provide any assurance of returns. Returns presented are net of all fees. Please carefully review the Fees and Disclaimers sections below for additional information concerning Sponsor’s use or projected returns and fees paid to Sponsor and RM Technologies, LLC
Certain fees and compensation will be paid over the life of the ownership of the Project; please refer to the Offering Documentation for specific details. The following fees and compensation will be paid(7)(8):
| One-Time Fees: | |||
| Type of Fee | Amount of Fee | Received By | Paid From |
| Developer Fee | 3.9% of all development costs | Manager or its designated affiliate | Capitalization |
| Equity Financing Fee | 0.76% of the non-Sponsor contributed equity | Manager or its designated affiliate | Capitalization |
| Debt Financing Fee | None | Manager or its designated affiliate | Capitalization |
| Recurring Fees: | |||
| Type of Fee | Amount of Fee | Paid From | |
| Asset Management Fee | 1.5% of aggregate capital contributions, paid monthly | Manager | Cash Flow |
| Property Management Fee | 3.0% of gross operating income, paid monthly | StarPoint Property Management, LLC, or a designated affiliate of Manager | Cash Flow |
| RM Technologies, LLC Fees, to be paid by the Manager: | Received By | ||
| Technology Solution Licensing Fee(8) | Flat one-time licensing fees of $15,000 plus $1,500 per each prospective investor onboarded by Sponsor through its license and use of RM Technologies’ Technology Solution | RM Technologies, LLC | |
| Administration Solution Licensing Fee(8) | Flat quarterly licensing fee of $125 per investor serviced by Sponsor through the license and use of RM Technologies’ Administration Solution | RM Technologies, LLC | |
(7) Fees may be deferred to reduce impact to investor distributions.
(8) Please see the Fees and Disclaimers sections below for additional information concerning fees paid to RM Technologies, LLC.
RM Securities, LLC, its registered representatives, affiliates, associated persons, and personnel of its affiliates who may also be associated with it, including our associated persons and personnel of our affiliates who are also be associated with RM Securities, LLC (it (“RM Securities,” “we,” “our,” or “us”) will receive fees, expense reimbursements, and other compensation (“Fees”) from the issuer of this investment offering, its sponsor, or an affiliate thereof (“Sponsor”), or otherwise in connection with Sponsor’s offering. The Fees paid to us are in addition to other fees you will pay to Sponsor or in connection with Sponsor’s investment offering. You will pay Fees to Sponsor, either directly or indirectly as an investor in the Sponsor’s offering. Sponsor will use the Fees you pay, as well as funds you invest in the relevant offering, to compensate us. The Fees paid to us will directly or indirectly be borne by you as the investor (typically, but not always, in the form of an expense of the Sponsor’s offering in which you invest) because such Fees will reduce the proceeds available for distribution to you and reduce the amount you earn over time.
For more information on the Fees paid to us, or any other Fees you will pay in connection with Sponsor’s offering, please carefully review the Sponsor’s Investment Documents. Please also carefully review RM Securities’ Form CRS, Regulation Best Interest Disclosures, and Limited Brokerage Services Agreement.
No Approval, Opinion or Representation, or Warranty by RM Securities, LLCSponsor has provided, approved, and is solely responsible in all aspects for the information on this webpage (“Page”), including Sponsor’s offering documentation, which may include without limitation the Private Placement Memorandum, Operating or Limited Partnership Agreement, Subscription Agreement, the Project Summary and all exhibits and other documents attached thereto or referenced therein (collectively, the “Investment Documents”). The Investment Documents linked on this page have been prepared and posted by Sponsor, and not by RM Securities. We did not assist in preparing, do not adopt or endorse, and we are not otherwise responsible for, the Sponsor’s Investment Documents. We make no representations or warranties as to the accuracy of information on this Page or in the Sponsor’s Investment Documents and we accept no liability therefor. No part of the information on this Page or in the Sponsor’s Investment Documents is intended to be binding on us.
Sponsor’s Information Qualified by Investment DocumentsThe information on this Page is qualified in its entirety by reference to the more complete information about the offering contained in the Sponsor’s Investment Documents. The information on this Page is not complete and subject to change at the Sponsor’s discretion at any time up to the closing date. The Sponsor’s Investment Documents and supplements thereto contain important information about the Sponsor’s offering including relevant investment objectives, the business plan, risks, charges, expenses, and other information, which you should consider carefully before investing. The information on this Page should not be used as a basis for an investor’s decision to invest.
Risk of InvestmentThis investment is speculative, highly illiquid, and involves substantial risk. There can be no assurances that all or any of Sponsor’s assumptions, expectations, estimates, goals, hypothetical illustrations, or other aspects of Sponsor’s business plans (“Assumptions”) will be true or that actual performance will bear any relation to Sponsor’s Assumptions, and no guarantee or representation is made that Sponsor’s Assumptions will be achieved. If Sponsor does not achieve its Assumptions, your investment could be materially and adversely affected. A loss of part or all of the principal value of your investment may occur. You should not invest unless you can readily bear the consequences of such loss. Sponsor’s Assumptions should not be relied upon as the primary basis for your decision to invest.
No Reliance on Forward-Looking Statements; Sponsor AssumptionsSponsor is solely responsible for statements made concerning forward-looking statements and Assumptions, which apply only as of the date made, are preliminary and subject to change, and are expressly qualified in their entirety by the disclosures and cautionary statements included in Sponsor’s Investment Documents, which you should carefully review. Neither RM Securities nor Sponsor are obligated to update or revise such forward-looking statements or Assumptions to reflect events or circumstances that arise after the date made or to reflect the occurrence of unanticipated events. Sponsor’s forward-looking statements and Assumptions are hypothetical, not based on actual investment achievements or events, and are presented solely for purposes of providing insight into the Sponsor’s investment objectives, detailing Sponsor’s anticipated risk and reward characteristics, and establishing a benchmark for future evaluation of actual results; therefore, they are not a predictor, projection, or guarantee of future results. You should not rely on Sponsor’s forward-looking statements as a basis to invest.
Importantly, we do not adopt, endorse, or provide any assurance of returns or as to the accuracy or reasonableness of Sponsor’s Assumptions or forward-looking statements.
No Reliance on Past PerformanceAny description of past performance is not a reliable indicator of future performance and should not be relied upon as the primary basis to invest.
Sponsor’s Use of DebtA substantial portion of the total cost of the real estate asset acquired by the Sponsor with investor funds (“Property”) will be paid with borrowed funds, i.e., debt. Sponsor’s estimated rates and terms of the debt financing are subject to lender approval, and there is no assurance that the Sponsor will secure debt at the rates and terms presented on this Page or in the Sponsor’s Investment Documents, or at all. The use of borrowed money to acquire real estate is referred to as leveraging, which can amplify losses and could result in lender foreclosure. In addition, if the debt includes a variable (or “floating”) interest rate, the total amount of interest paid over the term of the debt will fluctuate and can increase. As a result, Sponsor’s use of debt can result in a loss of some or all of your investment.
Sponsor’s Offering is Not RegisteredSponsor’s securities offering will not be registered under the Securities Act of 1933, as amended (the “Securities Act”), in reliance upon the exemptions from registration pursuant to Rule 506(c) of Regulation D as promulgated under the Securities Act (“Private Placement”). In addition, the offering will not be registered under any state securities laws in reliance on exemptions from state registration. Such securities (your ownership interests) are subject to restrictions on transferability and resale and may not be transferred or resold except as permitted under applicable state and federal securities laws pursuant to registration or an available exemption. All Private Placements on the Platform are intended solely for “Accredited Investors,” as that term is defined in Rule 501(a) under the Securities Act.
No Investment AdviceNothing on this Page should be regarded as investment advice (either with respect to a particular security or regarding an overall investment strategy), a recommendation, an offer to sell, or a solicitation of or an offer to buy any security. Advice from a securities professional is strongly advised to understand and assess the risks associated with real estate or private placement investments. For additional information on RM Securities’ involvement in this offering, please carefully review the Sponsor’s Investment Documents, and RM Securities’ Form CRS, Regulation Best Interest Disclosures, and Limited Brokerage Services Agreement.
1031 Exchange RiskInternal Revenue Code Section 1031 (“Section 1031”) contains complex tax concepts and certain tax consequences may vary depending on the individual circumstances of each investor. RM Securities and its affiliates make no representation or warranty of any kind with respect to the tax consequences of your investment or that the IRS will not challenge any such treatment. You should consult with and rely on your own tax advisor about the tax aspects with respect to your particular circumstances.