


Trion Properties focuses on potentially maximizing investor returns by increasing net operating income throughout the holding period through a hands-on management style of heavy renovation and aggressive lease-up. Trion Properties is a private equity investment company which acquires opportunistic real estate investments that need moderate to heavy rehab on a mid to long term investment horizon.
Founded in 2005, Trion has successfully closed over $160 million in transactions through either the purchase of the fee simple interest or taking ownership of the asset through acquiring the non-performing debt. Trion Properties is managed by principals whose combined experience spans over 20 years in West Coast real estate markets and is in excess of one billion dollars in transactions.
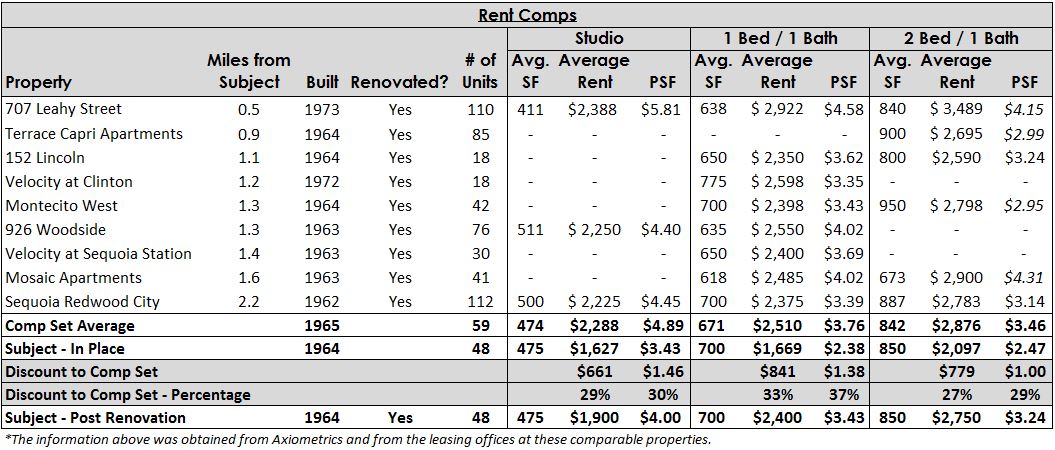
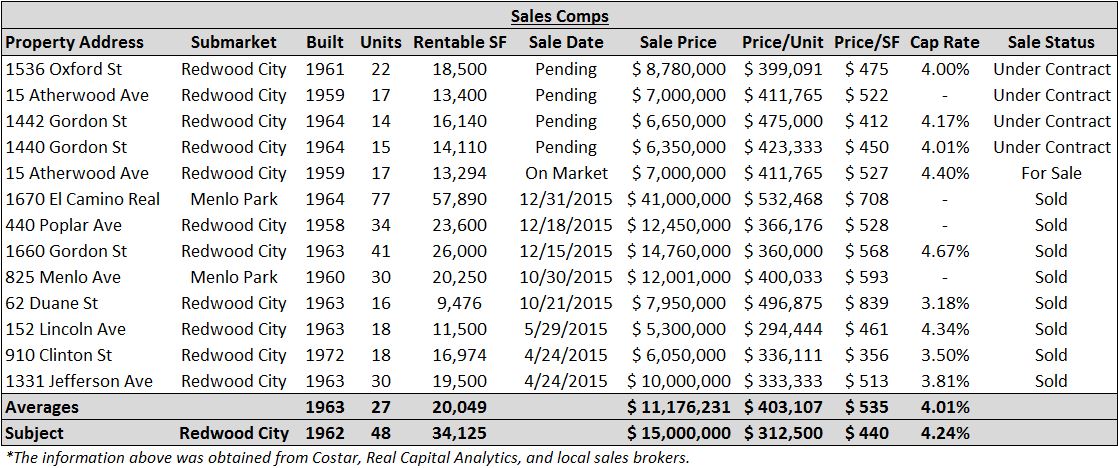
Built in 1962, the Property is a three-story apartment building comprised of 48 non-rent controlled units, including studio, one bedroom/one bath, and two-bedroom/one bath floor plans. Situated on .57 acres and offering 34,125 of residential square feet, the Property features covered and subterranean parking, on-site laundry facilities, a BBQ area and a courtyard. The Property is currently 96% occupied.
| Unit Mix | |||||
| Unit Type | # Units | % of Total | Unit SF | Avg. In-Place Rent | Avg. In-Place Rent/ SF |
| Studio | 3 | 6.25% | 475 | $1,627 | $3.43 |
| 1 Bed / 1 Bath | 37 | 77.08% | 700 | $1,669 | $2.38 |
| 2 Bed / 1 Bath | 8 | 16.67% | 850 | $2,097 | $2.47 |
| Total/ Average | 48 | 100.00% | 711 | $1,738 | $2.46 |

| Total Capitalization | |
| Sources of Funds | |
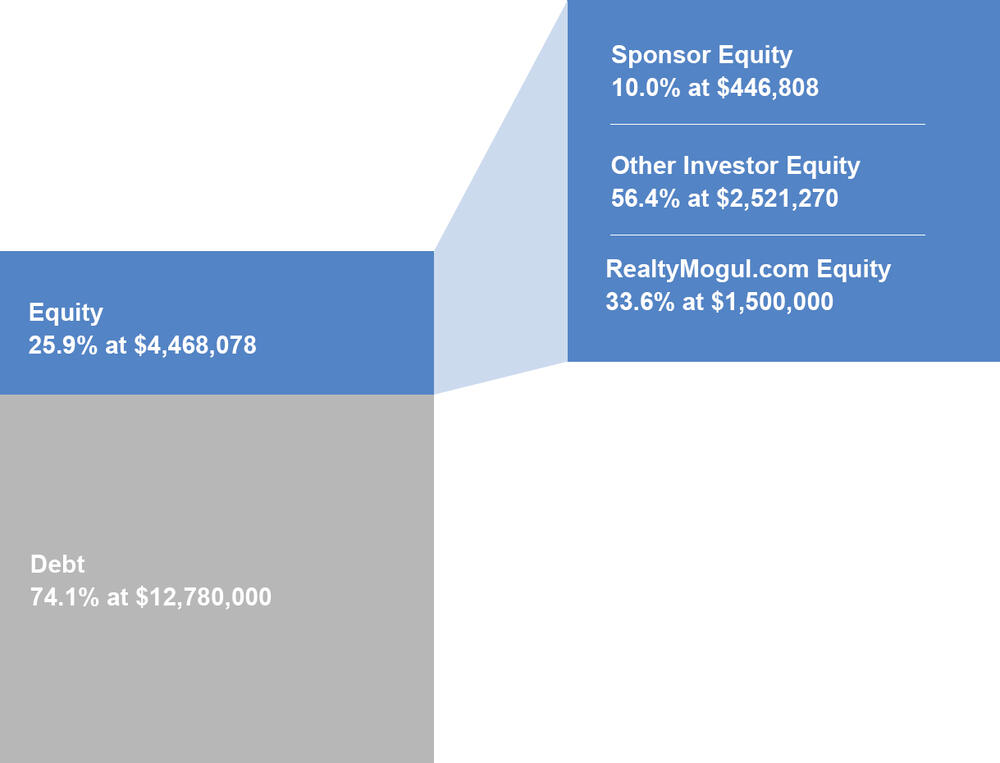
| Debt | $12,780,000 |
| Equity | $4,468,078 |
| Total Sources of Funds | $17,248,078 |
| Uses of Funds | |
| Purchase Price | $15,000,000 |
| Unit Renovation | $768,000 |
| Interest Reserves | $454,478 |
| CapEx Budget | $200,000 |
| Loan Fees and Rate Caps Purchase | $255,600 |
| Working Capital | $300,000 |
| Acquisition Fee (1%) | $150,000 |
| Broker Dealer Fee (3%) | $45,000 |
| Closing Costs | $75,000 |
| Total Uses of Funds | $17,248,078 |
The projected terms of the debt financing are as follows:
Bridge Loan
- Lender: Thorofare Capital
- Principal Balance: $12,780,000
- Term: Two Years
- Rate: 30-Day LIBOR + 515 bps (with a 0.45% LIBOR floor)
- Amortization: Interest Only
- Extension Options: Two (2) six month extension options
- Loan to Cost: 74%
- Loan to Purchase Price: 85%
Permanent Loan
- Principal Balance: $14,210,549
- Rate: 4.00%
- Amortization: 30 Years
There can be no assurance that a lender will provide debt on the rates and terms noted above, or at all. All rates and terms of the debt financing are subject to lender approval, including but not limited to possible increases in capital reserve requirements for funds to be held in a lender controlled capital reserve account.
180 Buckingham Avenue, LLC will make distributions to Realty Mogul 64, LLC as follows:
Order of Distributions to Realty Mogul 64, LLC (Operating Income, Sales, or Refinance Proceeds)
- First, to members for any accumulated unpaid preferred return, based on an 8% cumulative, non-compounding preferred return
- Second, to the Sponsor until it has received an amount equal to 30% of the sum of all Preferred Returns paid to members (the "Catch-Up")
- Third, to the Sponsor to pay any accrued but unpaid Cost Overrun Returns(1)
- Fourth, to the Sponsor until all unreturned Cost Overrun Contributions(1) have been returned to zero (0)
- Fifth, to members, until their Capital Contribution balance has been returned to zero (0)
- Then, any excess balance will be split 70% to members pari passu and 30% to the Sponsor
If, upon the final liquidation of assets, the Company does not have enough money to return 100% of members' capital contributions, the Sponsor entity will repay any Catch-Up received previously, up to the total amount of all Catch-Up payments received, and apply the refunded amounts to a pro-rata repayment of the members' Capital Contributions. Realty Mogul 64, LLC will distribute 100% of its share of cash flow (after expenses) to the members of Realty Mogul 64, LLC (the RealtyMogul.com investors). The manager of Realty Mogul 64, LLC will receive a portion (up to 10%) of the Sponsor's promote interest.
Distributions are projected to start in December 2017 and are projected to continue on a quarterly basis thereafter. These distributions are at the discretion of the Sponsor, who may decide to delay distributions for any reason, including maintenance or capital reserves.
| Cash Flow Projections | |||||||
| Year 1 | Year 2 | Year 3 | Year 4 | Year 5 | |||
| Effective Gross Revenue | $664,133 | $1,402,981 | $1,445,070 | $1,488,422 | $1,533,075 | ||
| Total Operating Expenses | $396,541 | $433,225 | $445,790 | $460,323 | $478,409 | ||
| Net Operating Income | $267,592 | $969,756 | $999,280 | $1,028,099 | $1,054,666 | ||
| Distributions to Realty Mogul 64, LLC Investors | $0 | $421,286 | $58,061 | $67,736 | $2,642,719 | ||
(1) In the event there is a capital shortfall as a result of renovation costs exceeding the budgeted costs for the same, then the Sponsor shall contribute additional capital to the Company in an amount necessary to meet such cost overruns. Such capital contributions shall be considered “Cost Overrun Contributions,” and such amounts shall accrue interest at a rate equal to the interest of the senior loan on the Property (the “Cost Overrun Return”).
Certain fees and compensation will be paid over the life of the transaction. The following fees and compensation will be paid:
| Type of Fee | Amount of Fee | Received By | Paid From | Notes |
| One-Time Fees: | ||||
|---|---|---|---|---|
| Acquisition/ Guarantor Fee | $150,000 | Sponsor | Capitalized Equity Contribution | 1.0% of the Property purchase price |
| Broker-Dealer Fee | 3.0% | North Capital (1) | Capitalized Equity Contribution | 3.0% based on the amount of equity invested by Realty Mogul 64, LLC |
| Mortgage Broker Fee | 1.0% | Continental Funding Group | Capitalized Equity Contribution | 1.0% of the loan amount. Continental Funding Group is a separate but affiliated entity of the Sponsor and its principals.
|
| Recurring Fees: | ||||
| Property Management Fee | 4.0% | Sponsor | Operating Cash Flow | The greater of 4.0% of Effective Gross Income or $2,500/month |
| Management and Administrative Fee | 1.0% | RM Manager, LLC | Distributable Cash | 1.0% of amount invested in Realty Mogul 64, LLC. RM Manager, LLC is the Manager of Realty Mogul 64, LLC and a wholly-owned subsidiary of Realty Mogul, Co. (2) |
Notes:
(1) Certain employees of Realty Mogul, Co. are registered representatives of, and are paid commissions by, North Capital Private Securities Corp., a Delaware corporation ("North Capital"). In addition, North Capital pays a technology provider services fee to Realty Mogul, Co. for licensing and access to certain technology, reporting, communications, branding, entity formation and administrative services performed from time to time by Realty Mogul, Co., and North Capital and Realty Mogul, Co. are parties to a profit sharing arrangement.
(2) Fees may be deferred to reduce impact to investor distributions
The above presentation is based upon information supplied by the Sponsor or others. Realty Mogul, Co., RM Manager, LLC, and Realty Mogul 64, LLC, along with their respective affiliates, officers, directors or representatives (the "RM Parties") hereby advise you that none of them has independently confirmed or verified any of the information contained herein. The RM Parties further make no representations as to the accuracy or completeness of any such information and undertake no obligation now or in the future to update or correct this presentation or any information contained herein.
The information on this Page is qualified in its entirety by reference to the more complete information about the offering contained in the Sponsor’s Investment Documents. The information on this Page is not complete and subject to change at the Sponsor’s discretion at any time up to the closing date. The Sponsor’s Investment Documents and supplements thereto contain important information about the Sponsor’s offering including relevant investment objectives, the business plan, risks, charges, expenses, and other information, which you should consider carefully before investing. The information on this Page should not be used as a basis for an investor’s decision to invest.
Risk of InvestmentThis investment is speculative, highly illiquid, and involves substantial risk. There can be no assurances that all or any of Sponsor’s assumptions, expectations, estimates, goals, hypothetical illustrations, or other aspects of Sponsor’s business plans (“Assumptions”) will be true or that actual performance will bear any relation to Sponsor’s Assumptions, and no guarantee or representation is made that Sponsor’s Assumptions will be achieved. If Sponsor does not achieve its Assumptions, your investment could be materially and adversely affected. A loss of part or all of the principal value of your investment may occur. You should not invest unless you can readily bear the consequences of such loss. Sponsor’s Assumptions should not be relied upon as the primary basis for your decision to invest.
No Reliance on Forward-Looking Statements; Sponsor AssumptionsSponsor is solely responsible for statements made concerning forward-looking statements and Assumptions, which apply only as of the date made, are preliminary and subject to change, and are expressly qualified in their entirety by the disclosures and cautionary statements included in Sponsor’s Investment Documents, which you should carefully review. Sponsor is obligated to update or revise such forward-looking statements or Assumptions to reflect events or circumstances that arise after the date made or to reflect the occurrence of unanticipated events. Sponsor’s forward-looking statements and Assumptions are hypothetical, not based on actual investment achievements or events, and are presented solely for purposes of providing insight into the Sponsor’s investment objectives, detailing Sponsor’s anticipated risk and reward characteristics, and establishing a benchmark for future evaluation of actual results; therefore, they are not a predictor, projection, or guarantee of future results. You should not rely on Sponsor’s forward-looking statements as a basis to invest.
Importantly, we do not adopt, endorse, or provide any assurance of returns or as to the accuracy or reasonableness of Sponsor’s Assumptions or forward-looking statements.
No Reliance on Past PerformanceAny description of past performance is not a reliable indicator of future performance and should not be relied upon as the primary basis to invest.
Sponsor’s Use of DebtA substantial portion of the total cost of the real estate asset acquired by the Sponsor with investor funds (“Property”) will be paid with borrowed funds, i.e., debt. Sponsor’s estimated rates and terms of the debt financing are subject to lender approval, and there is no assurance that the Sponsor will secure debt at the rates and terms presented on this Page or in the Sponsor’s Investment Documents, or at all. The use of borrowed money to acquire real estate is referred to as leveraging, which can amplify losses and could result in lender foreclosure. In addition, if the debt includes a variable (or “floating”) interest rate, the total amount of interest paid over the term of the debt will fluctuate and can increase. As a result, Sponsor’s use of debt can result in a loss of some or all of your investment.
Sponsor’s Offering is Not RegisteredSponsor’s securities offering will not be registered under the Securities Act of 1933, as amended (the “Securities Act”), in reliance upon the exemptions from registration pursuant to Rule 506(c) of Regulation D as promulgated under the Securities Act (“Private Placement”). In addition, the offering will not be registered under any state securities laws in reliance on exemptions from state registration. Such securities (your ownership interests) are subject to restrictions on transferability and resale and may not be transferred or resold except as permitted under applicable state and federal securities laws pursuant to registration or an available exemption. All Private Placements on the Platform are intended solely for “Accredited Investors,” as that term is defined in Rule 501(a) under the Securities Act.
No Investment AdviceNothing on this Page should be regarded as investment advice (either with respect to a particular security or regarding an overall investment strategy), a recommendation, an offer to sell, or a solicitation of or an offer to buy any security. Advice from a securities professional is strongly advised to understand and assess the risks associated with real estate or private placement investments.
1031 Exchange RiskInternal Revenue Code Section 1031 (“Section 1031”) contains complex tax concepts and certain tax consequences may vary depending on the individual circumstances of each investor. You should consult with and rely on your own tax advisor about the tax aspects with respect to your particular circumstances.