


Prescott Group
Prescott Group is in Dallas, TX and was founded in 1996 by Judson (“Jud”) Pankey and Vance Detwiler. Both founding partners are still currently active executives at the firm. Prescott has three (3) separate but cohesive verticals of the business; Prescott Realty Group, the internal operations and management of our real estate; Prescott Advisors an SEC-registered entity and co-mingled fund manager with a current AUM of $152MM and Dyck O’Neal the in-house debt restructuring and servicing platform. The firm currently has 90+ employees and managed or owned over $685MM in real estate since inception. Prescott has leased over 25MM in commercial square feet. The firm currently focuses its investment efforts through their co-mingled fund mandates. Prescott Strategies Fund II has a debt/equity focus and is asset type agnostic in an effort to create a risk-adjusted portfolio.
Hickory Capital Group
Hickory Capital Group, LLC (“HCG”) is a private real estate investment and property management company focused on the development and acquisition of self-storage properties. The firm currently has a portfolio of assets with a stabilized market value of approximately $130 million spread across the Southeast, Southwest, and Midwest. Founded in 2014, HCG has offices in Cincinnati, Ohio; Nashville, Tennessee; and New Orleans, Louisiana.
http://www.hickorycapitalgroup.com/
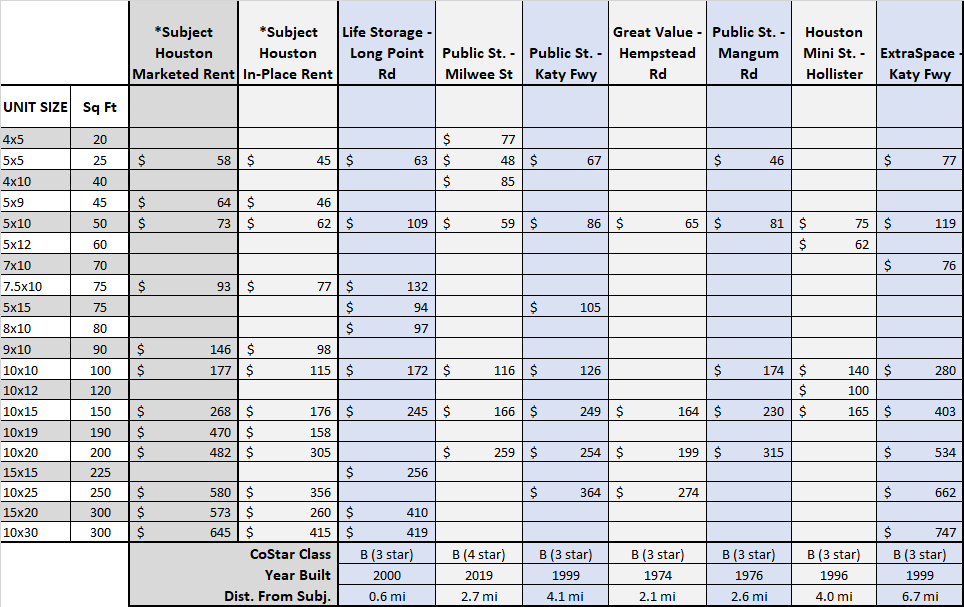
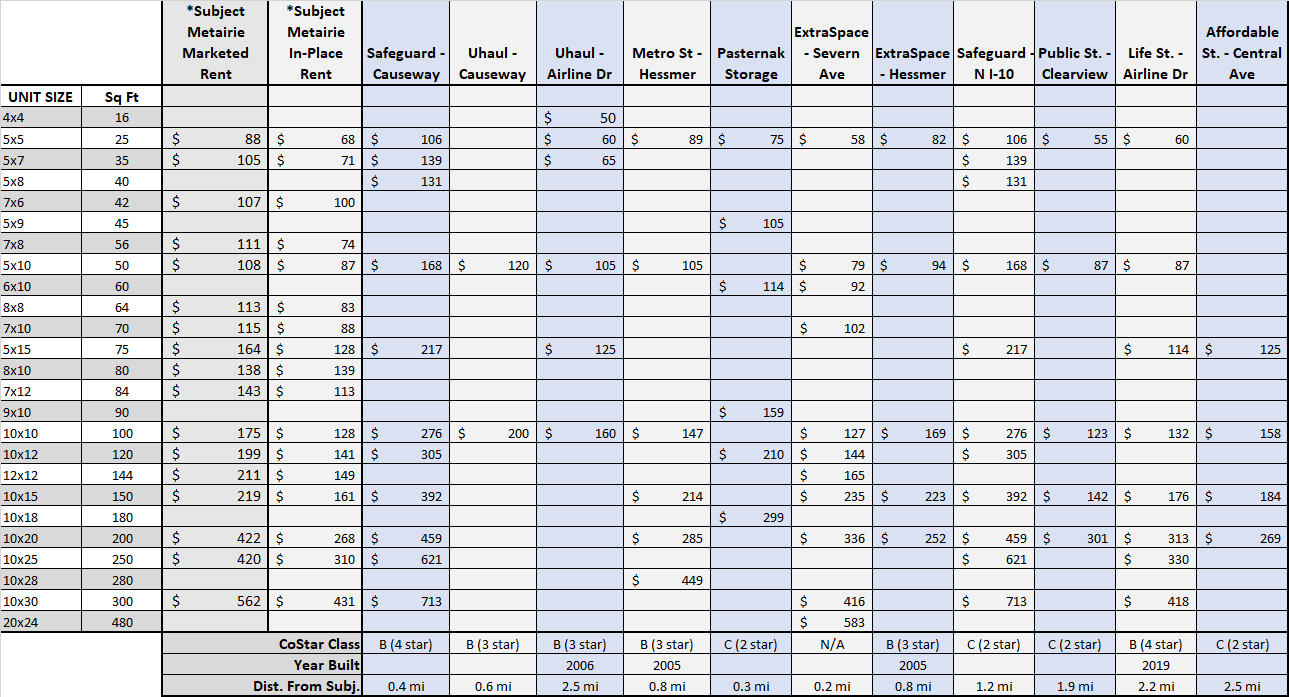
The portfolio is comprised of a total of 1,869 units of which 819 (77,969 SF) are in Houston, TX and 1,050 (97,000 SF) in Metairie, LA. All units in both Properties are climate-controlled. Both facilities are among the largest, best quality, and most visible within their respective submarkets. In the Metairie asset, there is also 3,500 SF of rentable retail space that is planned to be leased within two years. The main thesis in the business plan is to mark rents to market as both properties are currently rented at rates materially below market.
| Property | Units | Total SF | Current Eff. Rent PSF | Proforma Rent (Year Four) |
| Houston | 819 | 77,969 | $1.30 | $1.90 |
| Metairie | 1,050 | 97,000 | $1.37 | $1.90 |
| Total/Averages | 1,869 | 174,969 | $1.34 | $1.90 |
TX Lease Comparables
LA Lease Comparables
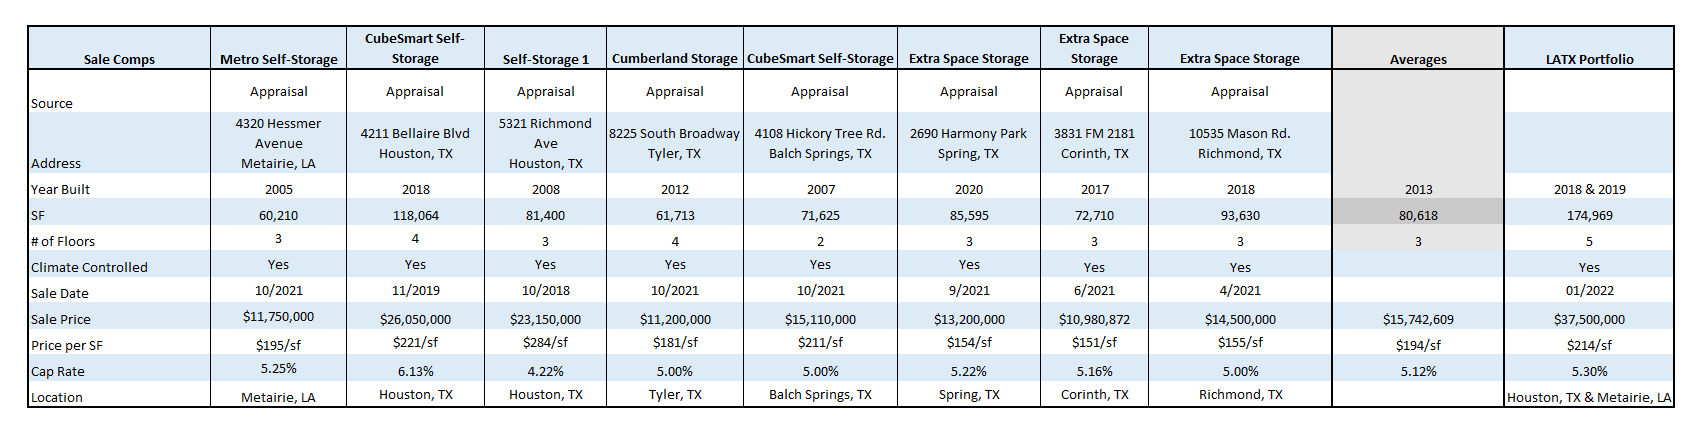
Sales Comparables
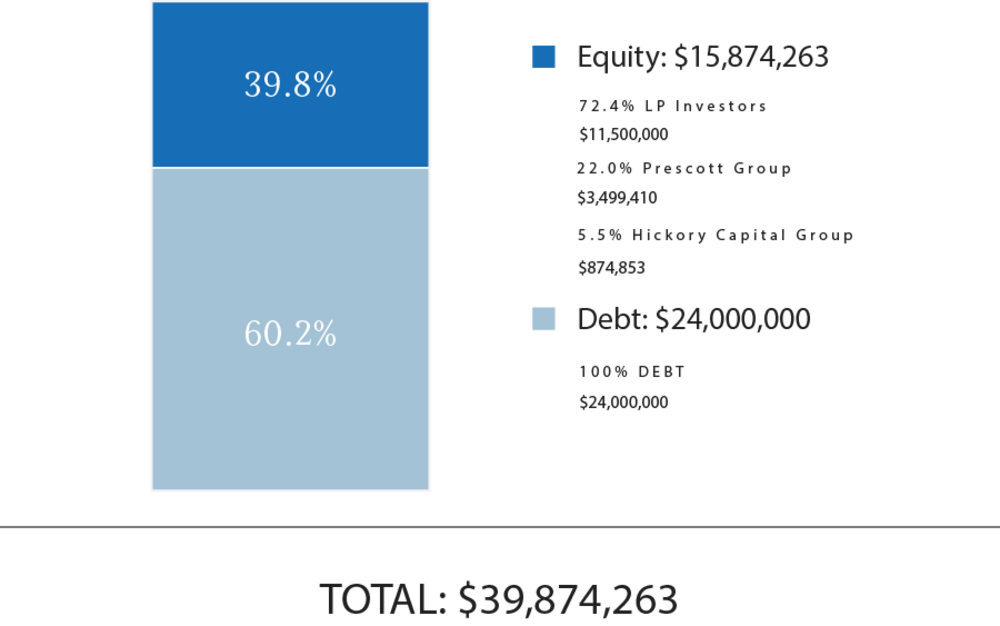
Total Capitalization
| Sources of Funds | $ Amount | $/Unit | $/SF |
| Debt | $24,000,000 | $12,841 | $137 |
| LP Equity(2) | $11,500,000 | $6,153 | $66 |
| Prescott Group Equity | $3,499,410 | $1,872 | $20 |
| Hickory Capital Group Equity | $874,853 | $468 | $5 |
| Total Sources of Funds | $39,874,263 | $21,335 | $228 |
| Uses of Funds(3) | $ Amount | $/Unit | $/SF |
| Purchase Price | $37,500,000 | $20,064 | $214 |
| Pre-Paid OPEX | $215,924 | $116 | $1 |
| CAPEX | $235,100 | $126 | $1 |
| Loan Origination & App. Fees | $220,000 | $118 | $1 |
| HCG Transaction Fee | $377,200 | $202 | $2 |
| Working Capital | $275,201 | $147 | $2 |
| Legal Fees | $128,831 | $69 | $1 |
| RealtyMogul Fees & Costs(1) | $500,000 | $268 | $3 |
| Title Insurance & Recording Fees | $178,996 | $96 | $1 |
| Credit Line Interest Carry | $150,000 | $80 | $1 |
| Other Closing Costs | $93,012 | $50 | $1 |
| Total Uses of Funds | $39,874,263 | $21,335 | $228 |
(1) The Sponsor’s equity contribution may consist of friends and family equity and equity from funds controlled by the Sponsor.
(2)(3) Please see PPM and LPA for more details. A guaranteed payment totaling $11MM was used originally to facilitate the acquisition of the property, which guaranteed payment will be paid down with the subject offering.
The terms of the debt financing are as follows:
- Lender: Trustmark Bank
- Term: 3 Years
- Loan-to-Cost: 60.2%
- Estimated Proceeds: $24,000,000
- Interest Type: Fixed
- Annual Interest Rate: 3.30%
- Interest-Only Period: 3 Years
- Amortization: 25 Years
- Prepayment Terms: The loan can be prepaid at any time without penalty
- Extension Options(2): 1 two-year extension option, no fee.
- Extension Requirements: 1.3 DSCR, no event of default, written notice within 30 to 120 days prior to maturity date
(1) A substantial portion of the total acquisition for the Property will be paid with borrowed funds, i.e., debt. Please carefully review the Disclaimers section below for additional information concerning the Sponsors use of debt.
(2) At the option of the Borrower, the interest rate for the extension above can be (1) fixed at the then current "two year swap rate" plus 2.05% (the "Swap Rate") or (2) a floating rate equal to the Swap Rate.
Prescott Group and Hickory Capital Group intend to make distributions as follows:
- To the Investors, pari passu, all operating cash flows to an 8.0% IRR;
- 80% / 20% (80% to Investors / 20% to Promote/Carried Interest) of excess cash flow to a 14.0% IRR;
- 60% / 40% (60% to Investors / 40% to Promote/Carried Interest) of excess cash flow thereafter.
Prescott Group and Hickory Capital Group intend to make distributions to investors after the payment of the company's liabilities (loan payments, operating expenses, and other fees as more specifically set forth in the LLC agreements, in addition to any member loans or returns due on member loan).
Distributions are expected to start in September 2022 and are projected to continue on a quarterly basis thereafter. Distributions are at the discretion of Prescott Group and Hickory Capital Group, who may decide to delay distributions for any reason, including maintenance or capital reserves.
| Cash Flow Summary | ||||||
| Year 1 | Year 2 | Year 3 | Year 4 | |||
| Effective Gross Revenue | $3,293,669 | $3,783,769 | $3,955,758 | $4,073,540 | ||
| Total Operating Expenses | $1,299,683 | $1,365,383 | $1,414,597 | $1,464,856 | ||
| Net Operating Income | $1,993,985 | $2,418,387 | $2,541,161 | $2,608,684 | ||
| Project-Level Cash Flows | ||||||
| Year 0 | Year 1 | Year 2 | Year 3 | Year 4 (1) | ||
| Net Cash Flow | ($15,874,263) | $1,337,151 | $1,630,511 | $1,465,565 | $26,942,867 | |
| Investor-Level Cash Flows (2) | ||||||
| Year 0 | Year 1 | Year 2 | Year 3 | Year 4 (1) | ||
| Net Cash Flow | ($11,500,000) | $840,912 | $1,053,435 | $933,940 | $16,886,888 | |
| Investor-Level Cash Flows - Hypothetical $50,000 Investment (2) | ||||||
| Year 0 | Year 1 | Year 2 | Year 3 | Year 4 (1) | ||
| Net Cash Flow | ($50,000) | $3,656 | $4,580 | $4,061 | $73,421 | |
(1) stub year of seven months
(2) RM Technologies, LLC and its affiliates do not provide any assurance of returns. Returns presented are net of all fees. Please carefully review the Fees and Disclaimers sections below for additional information concerning Sponsor’s use or projected returns and fees paid to Sponsor and RM Technologies, LLC.
Certain fees and compensation will be paid over the life of the transaction; please refer to the Sponsors' materials for details. The following fees and compensation will be paid:
| One-Time Fees: | |||
| Type of Fee | Amount of Fee | Received By | Paid From |
| Acquisition Fee | 1.0% of Purchase Price | Hickory Capital Group | Capitalization |
| Technology Solution Licensing Fee(2) | Flat one-time licensing fees of $15,000 plus $1,500 per each prospective investor onboarded by Sponsor through its license and use of RM Technologies’ Technology Solution | RM Technologies, LLC | Capitalization |
| Recurring Fees: | |||
| Type of Fee | Amount of Fee | Received By | Paid From |
| Asset Management Fee | 1.5% of EGI | Prescott Group | Cash Flow |
| Property Management Fee | 5.0% of EGI | Hickory Capital Group | Cash Flow |
| Administrative Solution Fee | flat quarterly fee of $125 per investor serviced through the Administration Solution | RM Technologies, LLC | Cash Flow |
(1) Fees may be deferred to reduce impact to investor distributions.
(2) Please see the Fees and Disclaimers sections below for additional information concerning fees paid to RM Technologies, LLC.
.
The information on this Page is qualified in its entirety by reference to the more complete information about the offering contained in the Sponsor’s Investment Documents. The information on this Page is not complete and subject to change at the Sponsor’s discretion at any time up to the closing date. The Sponsor’s Investment Documents and supplements thereto contain important information about the Sponsor’s offering including relevant investment objectives, the business plan, risks, charges, expenses, and other information, which you should consider carefully before investing. The information on this Page should not be used as a basis for an investor’s decision to invest.
Risk of InvestmentThis investment is speculative, highly illiquid, and involves substantial risk. There can be no assurances that all or any of Sponsor’s assumptions, expectations, estimates, goals, hypothetical illustrations, or other aspects of Sponsor’s business plans (“Assumptions”) will be true or that actual performance will bear any relation to Sponsor’s Assumptions, and no guarantee or representation is made that Sponsor’s Assumptions will be achieved. If Sponsor does not achieve its Assumptions, your investment could be materially and adversely affected. A loss of part or all of the principal value of your investment may occur. You should not invest unless you can readily bear the consequences of such loss. Sponsor’s Assumptions should not be relied upon as the primary basis for your decision to invest.
No Reliance on Forward-Looking Statements; Sponsor AssumptionsSponsor is solely responsible for statements made concerning forward-looking statements and Assumptions, which apply only as of the date made, are preliminary and subject to change, and are expressly qualified in their entirety by the disclosures and cautionary statements included in Sponsor’s Investment Documents, which you should carefully review. Sponsor is obligated to update or revise such forward-looking statements or Assumptions to reflect events or circumstances that arise after the date made or to reflect the occurrence of unanticipated events. Sponsor’s forward-looking statements and Assumptions are hypothetical, not based on actual investment achievements or events, and are presented solely for purposes of providing insight into the Sponsor’s investment objectives, detailing Sponsor’s anticipated risk and reward characteristics, and establishing a benchmark for future evaluation of actual results; therefore, they are not a predictor, projection, or guarantee of future results. You should not rely on Sponsor’s forward-looking statements as a basis to invest.
Importantly, we do not adopt, endorse, or provide any assurance of returns or as to the accuracy or reasonableness of Sponsor’s Assumptions or forward-looking statements.
No Reliance on Past PerformanceAny description of past performance is not a reliable indicator of future performance and should not be relied upon as the primary basis to invest.
Sponsor’s Use of DebtA substantial portion of the total cost of the real estate asset acquired by the Sponsor with investor funds (“Property”) will be paid with borrowed funds, i.e., debt. Sponsor’s estimated rates and terms of the debt financing are subject to lender approval, and there is no assurance that the Sponsor will secure debt at the rates and terms presented on this Page or in the Sponsor’s Investment Documents, or at all. The use of borrowed money to acquire real estate is referred to as leveraging, which can amplify losses and could result in lender foreclosure. In addition, if the debt includes a variable (or “floating”) interest rate, the total amount of interest paid over the term of the debt will fluctuate and can increase. As a result, Sponsor’s use of debt can result in a loss of some or all of your investment.
Sponsor’s Offering is Not RegisteredSponsor’s securities offering will not be registered under the Securities Act of 1933, as amended (the “Securities Act”), in reliance upon the exemptions from registration pursuant to Rule 506(c) of Regulation D as promulgated under the Securities Act (“Private Placement”). In addition, the offering will not be registered under any state securities laws in reliance on exemptions from state registration. Such securities (your ownership interests) are subject to restrictions on transferability and resale and may not be transferred or resold except as permitted under applicable state and federal securities laws pursuant to registration or an available exemption. All Private Placements on the Platform are intended solely for “Accredited Investors,” as that term is defined in Rule 501(a) under the Securities Act.
No Investment AdviceNothing on this Page should be regarded as investment advice (either with respect to a particular security or regarding an overall investment strategy), a recommendation, an offer to sell, or a solicitation of or an offer to buy any security. Advice from a securities professional is strongly advised to understand and assess the risks associated with real estate or private placement investments.
1031 Exchange RiskInternal Revenue Code Section 1031 (“Section 1031”) contains complex tax concepts and certain tax consequences may vary depending on the individual circumstances of each investor. You should consult with and rely on your own tax advisor about the tax aspects with respect to your particular circumstances.