FORMALIZED DUE DILIGENCE PROCESS 
Sponsors

The team at our affiliated broker-dealer, RM Securities, conducts diligence on of the issuer, including detailed background checks, criminal checks, bad actor checks, and reference checks on sponsors. In addition to screening for any criminal background, we may also turn down sponsors due to poor reference checks, even if the background and criminal checks are satisfactory.

Escrow accounts

We require unaffiliated sponsors to use an unaffiliated third-party escrow agent.* When an investor makes an investment with such sponsors using the RealtyMogul platform, the investor’s money is transferred directly into a third-party escrow account. All closing conditions in connection with a sponsor’s contingency offering need to be met before the third-party escrow agent will approve releasing investor funds to the issuer or general partner. For example, if an issuer or general partner plans to use funds for a real estate acquisition that does not ultimately transact, the third-party escrow agent will not transfer investor funds to the issuer or general partner, and funds will be returned to investors.

Unless otherwise disclosed, escrow accounts are not required for some investments that accommodate 1031 investments where the property is already acquired.

Boots on the ground

Our processes typically includes visiting certain properties (or a subset of properties if it's a fund) to confirm the real estate is what and where the real estate is supposed to be. For certain properties that accommodate 1031 exchange investments, the team will review third-party prepared due diligence reports in lieu of a site visit.

Detailed Checklists

We have formalized processes and checklists for every private placement deal listed on the platform.

Confidentiality Agreement
To access the Sponsor’s private offering documents for this investment, you must first acknowledge and agree to the below.
By clicking the ‘I Agree’ button below:
Funded
Estimated Hold Period 3 Years
Estimated First Distribution 9/2022
FUNDED 100%
...
View Our Due Diligence Process
Investment Returns: Discerning investors don't rely on a single projected return metric as a basis to invest. Rather, when assessing a potential investment, we encourage you to evaluate all information provided by a sponsor including the business plan, assumptions, and risk factors which can be found in the relevant offering documents. This approach is consistent with our requirements as a broker-dealer, which prohibit us from communicating projected returns.
Offered By
Next Wave Investors
Investment Strategy Value-Add
Investment Type Equity
Minimum Investment 35000
Overview
The Huntley Apartments is a 62-unit, garden-style multifamily community located near downtown Beaverton, a robust growing submarket of Portland, OR. The Property is being acquired with a fixed interest rate, eliminating exposure to future interest rate volatility.
Risk Adjusted Returns

The Project has a moderate leverage with a fixed-rate loan yet still has enough upside through enhanced management, as well as strategic renovations and property enhancements to provide investors with a strong return.

Severe Supply Constraint

Portland has substantially inhibited developers in recent years. Per research from JLL, from 2015 to 2019 an average of 27 permits were issued annually totaling 3,230 multifamily units in Multnomah County. In 2021, only two building permits were issued for a total of 352 units. Considering the City of Portland’s implementation of Inclusionary Housing in 2017 and the Urban Growth Boundary, the MSA is one of the more challenging markets to develop in across the country.

Location

The asset has a great location conveniently located near high-end retail as well as job centers and transportation. These transportation corridors have extensive retail and lifestyle services and easy access to Portland and the surrounding metro areas. Nestled between Beaverton Town Square and Cedar Hills Crossing, The Huntley is just minutes from lifestyle centers with numerous stores and service offerings, including restaurants, retail, boutiques, and first-run movie theaters. In addition, TriMet’s Beaverton Transit Center is just steps from The Huntley, connecting the metro area’s regional bus service, nationally recognized MAX light rail system, and WES Commuter Rail. With 90 stations and 60 miles of track, the MAX light rail connects cities and neighborhoods through Portland’s metro area, including Beaverton. Just minutes away from these national retailers: Fred Meyer, Trader Joe’s, BestBuy, Target, and Home Depot.

Property at a glance
# of Units 62
# of Buildings 5
Year Built / Partial Renovation 1972 / 2019
Parking Ratio 1.21
Exit Cap Rate 5.00%
Acquisition Price $18,000,000
Investment Highlights
Acquire a 62-unit, value-add apartment property for $18.0M, which represents a 4.55% cap rate on expected first-year NOI.
Opportunity to enhance the common areas and cure deferred maintenance to dramatically improve the curb appeal of the asset in a growing submarket of Portland.
The Property is adjacent to the TriMet Beaverton Transit Center, providing tenants with direct access to the greater metro area.
Next Wave Investors believes in-place rents are 17% below market and after renovations and installations of air conditioning units, the Sponsor plans to move rents to market rates.
Attractive returns using moderate leverage with a fixed-rate loan provide an excellent risk-adjusted return.
Management
Cumulative Distributions

Next Wave Investors

Next Wave Investors, LLC (“Next Wave”) is a Southern California-based private equity investment firm with a specialized focus in value-add multifamily investments throughout the Western United States. With more than $400 million in acquisitions to date, Next Wave is exceptionally skilled in identifying well-located, underappreciated properties where they can create value through professional operations and capital improvements. Drawing upon an 18-year track record and hands-on experience in the ownership, operation, and enhancement of multifamily properties, the firm consistently delivers value on behalf of individual and institutional investors throughout the globe.

https://nextwaveinvestors.com/
  • Jordan Fisher
    Principal
  • David Sloan
    Principal
Jordan Fisher
Principal

With nearly two decades of experience acquiring, redeveloping, and managing multifamily properties, Jordan Fisher is a multifamily investment expert. As Principal of Next Wave, Fisher spearheads the company’s investment strategy, and oversees property selection, renovations, and repositionings to ensure strong results.

Prior to joining the executive ranks in commercial real estate, Fisher was founder and CEO of TPG Consulting, LLC, a web development and digital marketing company. Under his leadership, the firm grew from two employees to over 110 with revenues over $21.5 million. TPG was recognized as an INC 500 company as well as one the Los Angeles Business Journal’s 100 fastest-growing private companies. In 2014, after running the company for over seven years, Fisher successfully sold the company to a Beijing-based multi-national Business Services firm.

Prior to founding TPG, Fisher worked at Deloitte Consulting and served as a Captain in the United States Army. A graduate of the U.S. Military Academy at West Point, Fisher earned his MBA from the UCLA Anderson School of Business.

David Sloan
Principal

A seasoned attorney with tremendous hands-on experience in real estate, David Sloan is an expert in multifamily real estate transactions, as well as asset and project management. As Principal for Next Wave, Sloan oversees all of the firm’s acquisitions and investments to ensure accuracy, legality and efficiency.

Earlier in his career, Sloan served as Senior Vice President – General Counsel of Sunstone Hotel Investors, Inc. (“Sunstone”), a publicly traded REIT. In that role, he managed all legal functions, including securities matters and real estate transactions. Prior to joining Sunstone, Sloan was engaged in the private practice of law in San Diego. He holds a B.S. degree from Ball State University and a J.D. degree (cum laude) from Thomas Jefferson School of Law.

Track Record

Property City State Asset Type Acq Date Units or SF Purchase Price Sale Price
Skyline Terrace Las Vegas NV MultiFamily 7/1/2015 44 $2,625,000 $3,175,000
Skyline Place Las Vegas NV MultiFamily 7/1/2015 87 $4,750,000 $6,075,000
Skyline Parc Las Vegas NV MultiFamily 7/1/2015 193 $7,000,000 $11,000,000
Skyline Villas Las Vegas NV MultiFamily 7/1/2015 94 $3,825,000 $7,385,000
Casa Vista Las Vegas NV MultiFamily 3/1/2016 23 $910,000 $1,200,000
Oakridge Henderson NV MultiFamily 3/1/2016 42 $1,750,000 $2,500,000
Skyline Park Tucson AZ MultiFamily 3/1/2016 60 $1,920,000 $2,600,000
Villa Pacific Tucson AZ MultiFamily 7/1/2016 176 $5,400,000 $7,282,500
Quails Tucson AZ MultiFamily 8/1/2016 288 $9,400,000 $12,200,000
Sycamore Cove Tucson AZ MultiFamily 12/1/2016 67 $1,322,000 $2,400,000
Landing Point Salt Lake City UT MultiFamily 10/24/2017 126 $13,000,000 $17,600,000
Commons on 2nd Salt Lake City UT MultiFamily 10/24/2017 72 $5,800,000 $8,300,000
Bella Vista St. George UT MultiFamily 2/9/2018 148 $13,200,000 $18,200,000
Orange Tree Village Tucson AZ MultiFamily 3/16/2018 110 $10,550,000 $15,850,000
Harlow Las Vegas NV MultiFamily 3/29/2018 98 $17,100,000 $21,500,000
Cypress Springs Las Vegas NV MultiFamily 6/1/2018 144 $15,000,000 $20,000,000
Park Station Midvale UT MultiFamily 7/20/2018 96 $10,750,000 $15,600,000
Bella Vida Las Vegas NV MultiFamily 10/16/2018 72 $12,525,000 $15,000,000
La Estrella Vista Phoenix AZ MultiFamily 5/16/2019 96 $13,175,000 $16,750,000
Aspen Village West Valley City UT MultiFamily 3/18/2019 90 $12,175,000 $18,500,000
Townhomes at Mountain Ridge S. Salt Lake UT MultiFamily 5/23/2019 63 $12,500,000  
Cove on Bruce Clearfield UT MultiFamily 9/21/2018 76 $7,600,000 $15,250,000
Westover Parc Phoenix AZ MultiFamily 9/1/2019 160 $20,000,000 $41,625,000
Tompkins Cove Las Vegas NV MultiFamily 2/4/2020 88 $14,500,000 $18,600,000
Shiloh Park Townhomes Plano TX MultiFamily 11/18/2020 73 $14,850,000  
Park Central Luxury Townhomes Phoenix AZ MultiFamily 12/16/2020 56 $25,500,000  
Spanish Oaks Las Vegas NV MultiFamily 2/12/2021 216 $28,500,000  
River Lofts Tualatin OR MultiFamily 4/23/2021 74 $14,200,000  
Serrano Spokane WA MultiFamily 4/26/2021 300 $34,400,000  
Spyglass Hills Las Vegas  NV MultiFamily 7/1/2021 56 $8,500,000  
Ashley Terrace Vancouver  WA MultiFamily 8/4/2021 118 $23,850,000  
Willow Creek Prescott AZ MultiFamily 12/1/2021 160 $58,000,000  
Park Place Apartments Spokane Valley WA MultiFamily 10/15/2021 65 $8,000,000  
Ivy Apartments Roy UT MultiFamily 12/10/2021 64 $10,100,000  
Total            $442,677,000 $298,592,500

The above bios and track record were provided by Next Wave Investors and have not been independently verified by RealtyMogul.

The objective of the Managing Member’s business plan is to maximize net operating income and generate consistent returns and appreciation during the anticipated three-year ownership period by implementing a professional leasing and management program, completing strategically planned renovations and repairs to the Property, increasing revenue, and improving overall operations.

The Real Estate Company has budgeted approximately $933,762 in capital expenditures which will be allocated to both interior and exterior renovations. Interior and exterior/common area renovations are expected to be as follows:

Interior Renovations. The Seller has completed interior upgrades in all but nine (9) units. The Real Estate Company plans to renovate the remaining nine (9) units and expects such upgrades to cost an average of $17,000 per unit. The interior renovation plan will entail new stainless-steel appliances, lighting fixtures, plumbing fixtures, vinyl plank-like flooring in common areas, new carpet in bedrooms, hard surface countertops, new cabinet doors, brushed nickel hardware in the kitchens and bathrooms, new interior paint, balcony/patio repairs, new electrical plates and the addition of washers and dryers. These upgrades will produce a blended average renovation premium of $272 per unit, representing a 19.2% return on cost.

In addition to the above-mentioned unit renovations, the Real Estate Company plans to install new wall-mounted HVAC units in all 62 units. This feature will greatly enhance the tenant experience during the summer months. For instance, last year Portland experienced record-breaking high temperatures of 116°F leaving residents without HVAC units to suffer. According to the American Housing Survey of 2019, Portland ranks third lowest in all metros that are air-conditioned in the nation. This added amenity will enhance the competitiveness of these units in the eyes of prospective tenants.

Exterior and Common Area Renovations. The Real Estate Company has plans to make strategic exterior and common area improvements that cost on average $6,726 per unit. Exterior enhancements will include refreshing the exterior paint on all buildings, roofing and walkway repairs, parking lot resurfacing, and improvements to the Property landscape. These upgrades will add value and help enhance the overall image and curb appeal of the Property. Amenity improvements will include installing new carports and a minor refresh to other amenities. The Real Estate Company expects new carports to cost an average of $2,500/space and anticipates being able to charge up to $50/month for each space, representing a 24% return on cost.

Project Uses and CapEx Budget

Acquisition Cost $ Amount Per Unit
Purchase Price $18,000,000 $290,323
Closing Costs(1) $591,238 $9,536
Mortgage Brokerage Fee $115,000 $1,855
Acquisition Fee $360,000 $5,806
Total Acquistion Costs $19,066,238 $307,520
     
Capital Expenditures - Hard Costs    
Interior Renovations (9 Units) $135,000 $15,000
Air Conditioning Unit Installation $124,000 $2,000
Parking Lot Resurfacing $80,000 $1,290
Landscaping $75,000 $1,210
Balcony/Patio Restoration $40,000 $645
Carport Installations $155,000 $2,500
Exterior Paint $40,000 $645
Water Heater Replacements $15,500 $250
Miscellaneous $127,000 $2,048
Hard Cost Contingency $39,575 $638
Total Hard Costs $831,075 $13,404
     
Capital Expenditures - Soft Costs    
Construction Management Fee $62,331 $1,005
On Site Project Supervision Costs $40,356 $651
Total Soft Costs $102,687 $1,656
     
Grand Total $20,000,000 $322,581

(1) RM Technologies, LLC, an affiliate of RealtyMogul, operates the RealtyMogul Platform.  RM Technologies, LLC charges a fixed, non-percentage-based fee for real estate companies and their sponsors to use the Platform and for Platform-related services.  Please see the Fees and Disclaimers sections below for additional information concerning fees paid to RM Technologies, LLC. The Sponsor’s equity contribution may consist of friends and family equity and equity from funds controlled by the Sponsor.

Property Information

The Huntley Apartments provides an opportunity for a value-add project in an excellent location with in-place cash flow. With this attractive going-in cash flow, the Sponsor will be able to add value both with interior renovations and amenity enhancements. The Sponsor has secured an attractive fixed-rate loan with moderate leverage in order to mitigate any interest rate risk during the hold period of the Project.

Unit Mix

Renovated # of Units Avg SF/Unit Avg Rent Rent per SF
1 Bed / 1 Bath 18 745 $1,327 $1.78
2 Bed / 1 Bath 20 973 $1,560 $1.60
3 Bed / 2 Bath 15 1,100 $1,804 $1.64
         
Non-Renovated        
1 Bed / 1 Bath 5 745 $1,239 $1.66
2 Bed / 1 Bath 4 973 $1,375 $1.41
         
Total/Averages 62 919 $1,514 $1.65
Comparables

Lease Comparables

  Willow Grove Cedar Hills Arbor Creek Cedar Crest Oak and Iron Flats Comp Averages The Huntley Apartments
Address 11981 SW Center St, Beaverton, OR 97005 11700 SW Butner Road, Beaverton, OR 97225 3280 SW 170th Avenue, Beaverton, OR 97003 4800 SW Mueller Drive, Beaverton, OR 97078 11595 SW Center Street, Beaverton, OR 97005   12310 SW Center Street, Beaverton, OR 97005
Year Built 1989 1975 1984 1991 1980 1984 1972
Units 119 180 440 254 128 224 62
Average Rental Rate $2,085 $1,619 $1,657 $1,956 $1,673 $1,766 $1,818
Average SF 921 822 681 952 851 845 919
Average $/SF $2.27 $1.97 $2.43 $2.06 $1.97 $2.09 $1.98
# Units (1x1) 40 74 220 32 60 85 23
$ (1x1) $1,841 $1,545 $1,600 $1,633 $1,595 $1,615 $1,600
SF (1x1) 750 780 610 700 775 683 745
$/SF (1x1) $2.45 $1.98 $2.62 $2.33 $2.06 $2.37 $2.15
# Units (2x1) 72 24 52 76 38 52 24
$ (2x1) $2,192 $1,849 $1,900 $1,785 $1,795 $1,927 $1,850
SF (2x1) 990 950 980 880 970 950 973
$/SF (2x1) $2.21 $1.95 $1.94 $2.03 $1.85 $2.03 $1.90
# Units (3x2) 7     68   38 15
$ (3x2) $2,384     $2,300   $2,308 $2,100
SF (3x2) 1,180     1,150   1,153 1,100
$/SF (3x2) $2.02     $2.00   $2.00 $1.91
Distance from Subject 0.2 miles 1.5 miles 2.3 miles 1.6 miles 0.3 miles    

Sales Comparables

  Seven West at the Trails Hanover Arrive Murray Hills Sunset Summit Milo at Mountain Park Total/Averages The Huntley Apartments
Date Oct '21 Under Contract Dec '21 Dec '21 Oct '21 Nov '21 May '22
Submarket Greenway Beaverton Greenway West Haven Westlake   Beaverton
Year Built 1985 1998 1975 1989 1991 1988 1972
SF 346,860 77,076 118,404 224,199 125,001 178,308 56,978
Units 423 84 138 261 129 207 62
Average SF 820 918 858 859 969 885 919
Sale Price $145,250,000 $26,500,000 $47,000,000 $80,750,000 $44,200,000 $68,740,000 $18,000,000
$/Unit $343,381 $315,476 $340,580 $309,387 $342,636 $330,292 $290,323
$/SF $419 $344 $397 $360 $354 $375 $316
Distance from Subject 4.1 miles 1.5 miles 2.4 miles 2.9 miles 6.0 miles 3.4 miles  
Location Information

Market Overview

The Portland Metro Area is one of the strongest apartment markets in the nation. The area’s diversified job market and high quality of life continue to attract new residents. In March 2021 the state economist released a report estimating that net in-migration will average 30,000 people per year in 2021 and 35,000 people per year in 2022 and beyond. The majority, between 55-70 people per day, move to the Portland metro area. Meanwhile, new apartment permit applications construction has not caught up to meet housing demand. The Portland Metro Area consistently ranks among the nation’s lowest apartment vacancy rates. According to the U.S. Census Bureau, Portland’s third-quarter 2021 vacancy rate was 5.0% compared to the U.S. vacancy rate of 5.8%. Portland is known for its extremely well-educated workforce and is among the top U.S. cities with advanced college degrees.

Submarket Overview

The City of Beaverton (pop. 97,494) is a major economic hub in the Portland metro area, along with being Portland’s second-largest suburb and the fifth-largest city in Oregon. Over the past two decades, Beaverton has attracted numerous high-tech businesses and is one of Oregon’s fastest developing areas. Between 2010 and 2020, the city’s population has increased by 8.5% (US Census).

Beaverton is a large, robust community that is home to major companies such as Nike Inc. and Columbia Sportswear. Several high-tech employers including Intel and Genentech are located along the Highway 26/Sunset Corridor, which includes nearby Hillsboro. The growing tech hub west of Portland includes more than 300 high-tech businesses that have made their home in what is called the “Silicon Forest.” As an increasing number of high skilled workers are drawn to the area, Beaverton rents have been increasing, and are forecasted to continue this trend at a healthy pace. As a result, rents in the Beaverton area rose 8.7% in 2021, and vacancy has remained below 5.0% (per Costar). In addition, planned future improvements at Cedar Hills Crossing demonstrate the sentiment for continued employment and rent growth in the area.

Cap Stack
Sources & Uses

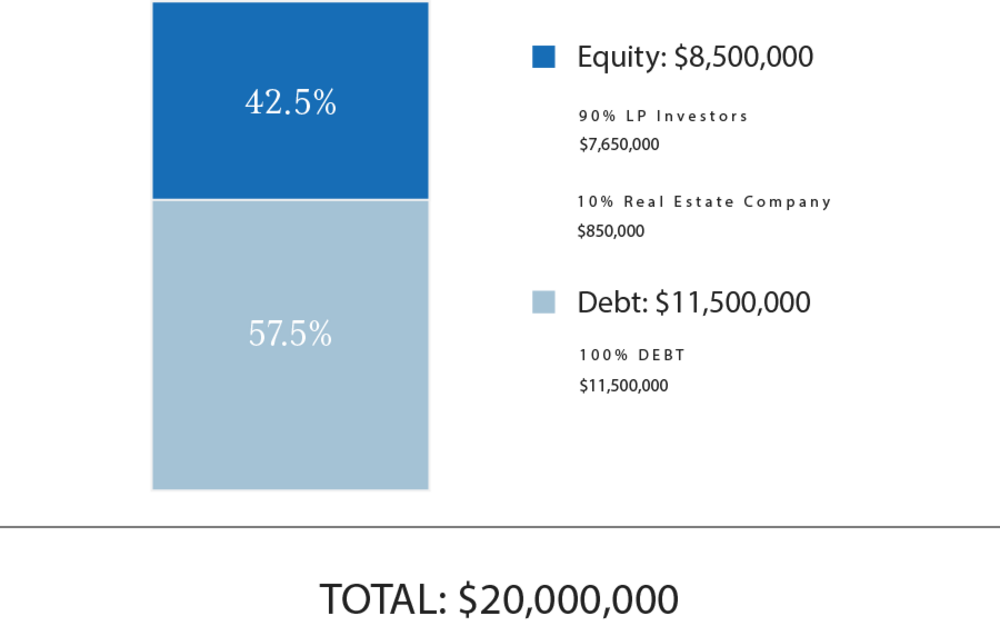
Total Capitalization

Sources of Funds $ Amount $/Unit
Debt $11,500,000 $185,484
GP Investor Equity $850,000 $13,710
LP Investor Equity $7,650,000 $123,387
Total Sources of Funds $20,000,000 $322,581
     
Uses of Funds $ Amount $/Unit
Purchase Price $18,000,000 $290,323
Closing Costs (1)(2) $1,066,238 $17,197
Hard Costs $831,075 $13,405
Soft Costs $102,687 $1,656
Total Uses of Funds $20,000,000 $322,581

(1) RM Technologies, LLC, an affiliate of RealtyMogul, operates the RealtyMogul Platform.  RM Technologies, LLC charges a fixed, non-percentage-based fee for real estate companies and their sponsors to use the Platform and for Platform-related services.  Please see the Fees and Disclaimers sections below for additional information concerning fees paid to RM Technologies, LLC. The Sponsor’s equity contribution may consist of friends and family equity and equity from funds controlled by the Sponsor.

(2) See PPM for details.

Debt Assumptions

The expected terms of the debt financing are as follows:

  • Lender: Umpqua Bank
  • Term: 30 Years
  • Loan-To-Value: 63.9%
  • Estimated Proceeds: $11,500,000
  • Interest Type: Fixed
  • Annual Interest Rate: 3.27%
  • Interest-Only Period: 36 Months
  • Amortization: 360 Months
  • Prepayment Terms: 3-1-1-1
  • Extension Requirements: None
  • Modeled Refinance: No

There can be no assurance that the Sponsor will secure debt on the rates and terms noted above, or at all.  All of the Sponsor’s estimated rates and terms of the debt financing are subject to lender approval, including but not limited to possible increases in capital reserve requirements for funds to be held in a lender-controlled capital reserve account.

A substantial portion of the total acquisition for the Property will be paid with borrowed funds. The use of borrowed money to acquire real estate is referred to as leveraging.  Leveraging increases the risk of loss.  If the Sponsor were unable to pay the payments on the borrowed funds (called a "default"), the lender might foreclose, and the Sponsor could lose its investment in its property.

Distributions

Next Wave Investors intends to make distributions as follows:

  1. To the Investors, pari passu, all operating cash flows to an 8.0% Compounded Annually;
  2. 67.5% / 32.5% (67.5% to Investors / 32.5% to Managing Member) of excess cash flow to a 17.0% Compounded Annually;
  3. 45% / 55% (45% to Investors / 55% to Managing Member) of excess cash flow thereafter.

Next Wave Investors intends to make distributions to investors after the payment of the company's liabilities (loan payments, operating expenses, and other fees as more specifically set forth in the LLC agreements, in addition to any member loans or returns due on member loan).

Distributions are expected to start in September 2022 and are projected to continue on a quarterly basis thereafter. Distributions are at the discretion of Next Wave Investors, who may decide to delay distributions for any reason, including maintenance or capital reserves.

Next Wave Investors will receive a promoted/carried interest as indicated above, and a portion of this promoted/carried interest may be received by RM Admin, LLC.

Cash Flow Summary
    Year 1 Year 2 Year 3 Year 4
Effective Gross Revenue   $1,248,002 $1,489,685 $1,599,966 $1,680,794
Total Operating Expenses   $429,649 $443,902 $458,060 $456,149
Net Operating Income   $818,353 $1,045,784 $1,141,906 $1,224,645
           
Project-Level Cash Flows
  Year 0 Year 1 Year 2 Year 3  
Net Cash Flow ($8,500,000) $437,080 $663,466 $13,475,927  
           
Investor-Level Cash Flows(1)
  Year 0 Year 1 Year 2 Year 3  
Net Cash Flow ($4,000,000) $139,821 $244,081 $5,791,409  
           
Investor-Level Cash Flows - Hypothetical $50,000 Investment(1)
  Year 0 Year 1 Year 2 Year 3  
Net Cash Flow ($50,000) $1,748 $3,051 $72,393  

(1) Returns are net of all fees.  Such Fees include fees paid to RM Admin, an affiliate of RealtyMogul, who charges an annual fixed administrative fee for providing certain ongoing administrative services to the Sponsor.  Please see the Fees and Disclaimers sections and Disclaimers sections below for additional information concerning fees paid to RM Admin. 

RM Technologies, LLC and its affiliates does not provide any assurance of returns.  The content on this Page, including Sponsor’s pro forma projections, was provided by the Sponsor or an affiliate thereof.  Although RM Technologies, LLC believes the Sponsor reliably produced this content, RM Technologies, LLC makes no representations or warranties as to the accuracy of such information and accepts no liability therefor.  The assumptions and projections included in the content on this Page, including the Sponsor’s pro forma projections, are not reflective of the position of RM Technologies, LLC or any other person or entity other than the Sponsor or its affiliates.  There can be no assurances that all or any of the Sponsor’s assumptions will be true, that actual performance will bear any relation to these hypothetical illustrations, or that the Sponsor’s investment objectives will be achieved.  For additional information concerning the Sponsor’s assumptions and projections, and the significant risks involved in investing in real estate, please see the Disclaimers section below. 

Fees

Certain fees and compensation will be paid over the life of the transaction; please refer to LXMI Capital's materials for details. The following fees and compensation will be paid(1)(2):

Real Estate Company Fees:
Type of Fee Amount of Fee Received By Paid From
Acquisition Fee 2.0% of Purchase Price Sponsor Capitalization
Construction Management Fee 7.5% of Hard Costs Sponsor Capitalization
 
Recurring Fees:
Type of Fee Amount of Fee Received By Paid From
Administrative Solution Fee flat quarterly fee of $125 per investor serviced through the Administration Solution RM Technologies, LLC(2) Distributions
Asset Management Fee 2.0% of Effective Gross Income Sponsor EGI
Property Management Fee 3.0% of Effective Gross Income Sponsor EGI

(1) Fees may be deferred to reduce impact to investor distributions.

(2) RM Technologies, LLC, an affiliate of RealtyMogul, operates the RealtyMogul Platform.  RM Technologies, LLC charges a fixed, non-percentage-based fee for real estate companies and their sponsors to use the RM Technologies, LLC’s proprietary Platform and receive Platform-related services.  An estimate of this fee is included in the Closing Costs above and is intended to be capitalized into the transaction at the discretion of the Sponsor.  The Platform fees received by RM Technologies, LLC are disclosed in the relevant operating agreement(s).  RM Technologies LLC’s receipt of Platform fees creates a conflict of interest between RealtyMogul and its affiliates, and investors or prospective investors.

The following offering documents have been prepared and are being delivered by the Sponsor of this investment opportunity, and not by RM Securities, LLC. RM Securities, LLC and its associated persons did not assist in preparing, do not explicitly or implicitly adopt or endorse, and are not otherwise responsible for, the Sponsors offering documents posted below or any content therein.
RM Securities, LLC and its Affiliates Compensation

RM Securities, LLC, its registered representatives, affiliates, associated persons, and personnel of its affiliates who may also be associated with it, including our associated persons and personnel of our affiliates who are also be associated with RM Securities, LLC (it (“RM Securities,” “we,” “our,” or “us”) will receive fees, expense reimbursements, and other compensation (“Fees”) from the issuer of this investment offering, its sponsor, or an affiliate thereof (“Sponsor”), or otherwise in connection with Sponsor’s offering. The Fees paid to us are in addition to other fees you will pay to Sponsor or in connection with Sponsor’s investment offering. You will pay Fees to Sponsor, either directly or indirectly as an investor in the Sponsor’s offering. Sponsor will use the Fees you pay, as well as funds you invest in the relevant offering, to compensate us. The Fees paid to us will directly or indirectly be borne by you as the investor (typically, but not always, in the form of an expense of the Sponsor’s offering in which you invest) because such Fees will reduce the proceeds available for distribution to you and reduce the amount you earn over time.

For more information on the Fees paid to us, or any other Fees you will pay in connection with Sponsor’s offering, please carefully review the Sponsor’s Investment Documents. Please also carefully review RM Securities’ Form CRS, Regulation Best Interest Disclosures, and Limited Brokerage Services Agreement.

No Approval, Opinion or Representation, or Warranty by RM Securities, LLC

Sponsor has provided, approved, and is solely responsible in all aspects for the information on this webpage (“Page”), including Sponsor’s offering documentation, which may include without limitation the Private Placement Memorandum, Operating or Limited Partnership Agreement, Subscription Agreement, the Project Summary and all exhibits and other documents attached thereto or referenced therein (collectively, the “Investment Documents”). The Investment Documents linked on this page have been prepared and posted by Sponsor, and not by RM Securities. We did not assist in preparing, do not adopt or endorse, and we are not otherwise responsible for, the Sponsor’s Investment Documents. We make no representations or warranties as to the accuracy of information on this Page or in the Sponsor’s Investment Documents and we accept no liability therefor. No part of the information on this Page or in the Sponsor’s Investment Documents is intended to be binding on us.

Sponsor’s Information Qualified by Investment Documents

The information on this Page is qualified in its entirety by reference to the more complete information about the offering contained in the Sponsor’s Investment Documents. The information on this Page is not complete and subject to change at the Sponsor’s discretion at any time up to the closing date. The Sponsor’s Investment Documents and supplements thereto contain important information about the Sponsor’s offering including relevant investment objectives, the business plan, risks, charges, expenses, and other information, which you should consider carefully before investing. The information on this Page should not be used as a basis for an investor’s decision to invest.

Risk of Investment

This investment is speculative, highly illiquid, and involves substantial risk. There can be no assurances that all or any of Sponsor’s assumptions, expectations, estimates, goals, hypothetical illustrations, or other aspects of Sponsor’s business plans (“Assumptions”) will be true or that actual performance will bear any relation to Sponsor’s Assumptions, and no guarantee or representation is made that Sponsor’s Assumptions will be achieved. If Sponsor does not achieve its Assumptions, your investment could be materially and adversely affected. A loss of part or all of the principal value of your investment may occur. You should not invest unless you can readily bear the consequences of such loss. Sponsor’s Assumptions should not be relied upon as the primary basis for your decision to invest.

No Reliance on Forward-Looking Statements; Sponsor Assumptions

Sponsor is solely responsible for statements made concerning forward-looking statements and Assumptions, which apply only as of the date made, are preliminary and subject to change, and are expressly qualified in their entirety by the disclosures and cautionary statements included in Sponsor’s Investment Documents, which you should carefully review. Neither RM Securities nor Sponsor are obligated to update or revise such forward-looking statements or Assumptions to reflect events or circumstances that arise after the date made or to reflect the occurrence of unanticipated events. Sponsor’s forward-looking statements and Assumptions are hypothetical, not based on actual investment achievements or events, and are presented solely for purposes of providing insight into the Sponsor’s investment objectives, detailing Sponsor’s anticipated risk and reward characteristics, and establishing a benchmark for future evaluation of actual results; therefore, they are not a predictor, projection, or guarantee of future results. You should not rely on Sponsor’s forward-looking statements as a basis to invest.

Importantly, we do not adopt, endorse, or provide any assurance of returns or as to the accuracy or reasonableness of Sponsor’s Assumptions or forward-looking statements.

No Reliance on Past Performance

Any description of past performance is not a reliable indicator of future performance and should not be relied upon as the primary basis to invest.

Sponsor’s Use of Debt

A substantial portion of the total cost of the real estate asset acquired by the Sponsor with investor funds (“Property”) will be paid with borrowed funds, i.e., debt. Sponsor’s estimated rates and terms of the debt financing are subject to lender approval, and there is no assurance that the Sponsor will secure debt at the rates and terms presented on this Page or in the Sponsor’s Investment Documents, or at all. The use of borrowed money to acquire real estate is referred to as leveraging, which can amplify losses and could result in lender foreclosure. In addition, if the debt includes a variable (or “floating”) interest rate, the total amount of interest paid over the term of the debt will fluctuate and can increase. As a result, Sponsor’s use of debt can result in a loss of some or all of your investment.

Sponsor’s Offering is Not Registered

Sponsor’s securities offering will not be registered under the Securities Act of 1933, as amended (the “Securities Act”), in reliance upon the exemptions from registration pursuant to Rule 506(c) of Regulation D as promulgated under the Securities Act (“Private Placement”). In addition, the offering will not be registered under any state securities laws in reliance on exemptions from state registration. Such securities (your ownership interests) are subject to restrictions on transferability and resale and may not be transferred or resold except as permitted under applicable state and federal securities laws pursuant to registration or an available exemption. All Private Placements on the Platform are intended solely for “Accredited Investors,” as that term is defined in Rule 501(a) under the Securities Act.

No Investment Advice

Nothing on this Page should be regarded as investment advice (either with respect to a particular security or regarding an overall investment strategy), a recommendation, an offer to sell, or a solicitation of or an offer to buy any security. Advice from a securities professional is strongly advised to understand and assess the risks associated with real estate or private placement investments. For additional information on RM Securities’ involvement in this offering, please carefully review the Sponsor’s Investment Documents, and RM Securities’ Form CRS, Regulation Best Interest Disclosures, and Limited Brokerage Services Agreement.

1031 Exchange Risk

Internal Revenue Code Section 1031 (“Section 1031”) contains complex tax concepts and certain tax consequences may vary depending on the individual circumstances of each investor. RM Securities and its affiliates make no representation or warranty of any kind with respect to the tax consequences of your investment or that the IRS will not challenge any such treatment. You should consult with and rely on your own tax advisor about the tax aspects with respect to your particular circumstances.

INVEST TODAY

...

Questions?

(877) 781-7062

Contact Investor Relations
Staff Menu (IO ID#: 1921848):
EDIT IO DOCUMENTS
Staff Menu (IO ID#: 1921848):
EDIT IO DOCUMENTS
JOIN REALTYMOGUL
Create an account or sign in.
Are you an Accredited Investor?
Must be 8 characters or more with an uppercase and lowercase character, a number, and a symbol.
By clicking "JOIN REALTYMOGUL" you are agreeing to our Terms of Service and Privacy Policy, and that you've had an opportunity to review RM Securities, LLC's Form Customer Relationship Summary.
SIGN IN
Don’t have an account yet? Join RealtyMogul.
Forgot Password?
Questions? Our Investor Relations team is available to help 8 AM - 6 PM PST Monday to Friday. Contact us at (877) 977-2776.
Forgot Password
Enter your email address to receive a code to reset your password.
Enter the code sent to your email address below and your new password.

Resend Code

WELCOME
Welcome,

Welcome to RealtyMogul! We need to ask a few additional questions to get to know you.

Your Net Worth
Are you interested in 1031 exchanges?
Thank you!

We’ve received your information and updated your Investor Profile.

Welcome to RealtyMogul

As part of RealtyMogul's commitment to transparency, we want to inform you that you have been directed to our website from an unaffiliated third-party marketing company who is compensated up to $250 for each investor who registers on our site. RealtyMogul and its affiliates have no relationship with the marketing company other than this compensation arrangement. RealtyMogul and its affiliates are not responsible for the preparation or accuracy of, and do not explicitly or implicitly adopt or endorse, any content provided by the unaffiliated marketing company.