


LXMI Capital is a Texas-based developer, owner, and operator of real estate in the major markets of Texas as well as select metros in the Southwest, Southeast, and Mountain West. LXMI is focused on acquiring under-performing multifamily real estate, typically undertaking a significant makeover of these properties in order to reposition them as leaders amongst their competitive set. In Texas, LXMI serves as construction managers on all their local assets and contracts with best-in-class 3rd party property managers and designers.
LXMI Capital was founded by Tony Gupta in 2019 and has acquired 11 properties with an aggregate value of over $341M since its inception. Total commercial real estate acquired $834M.
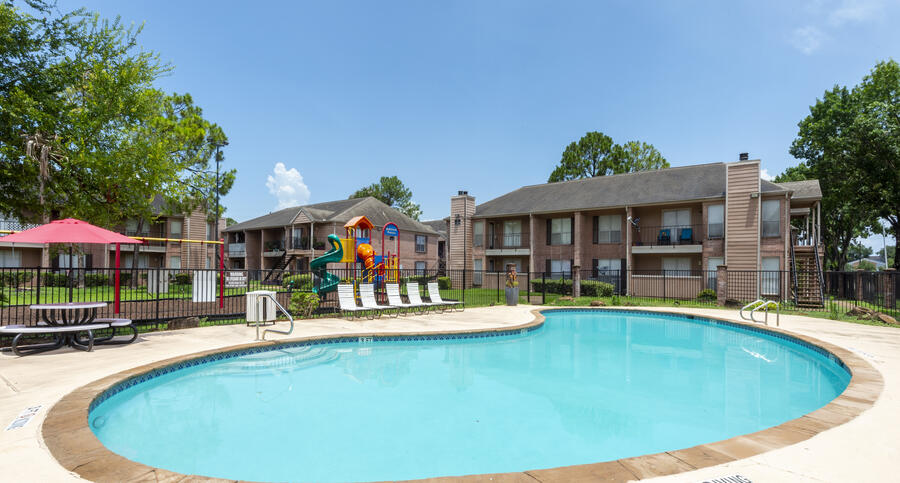
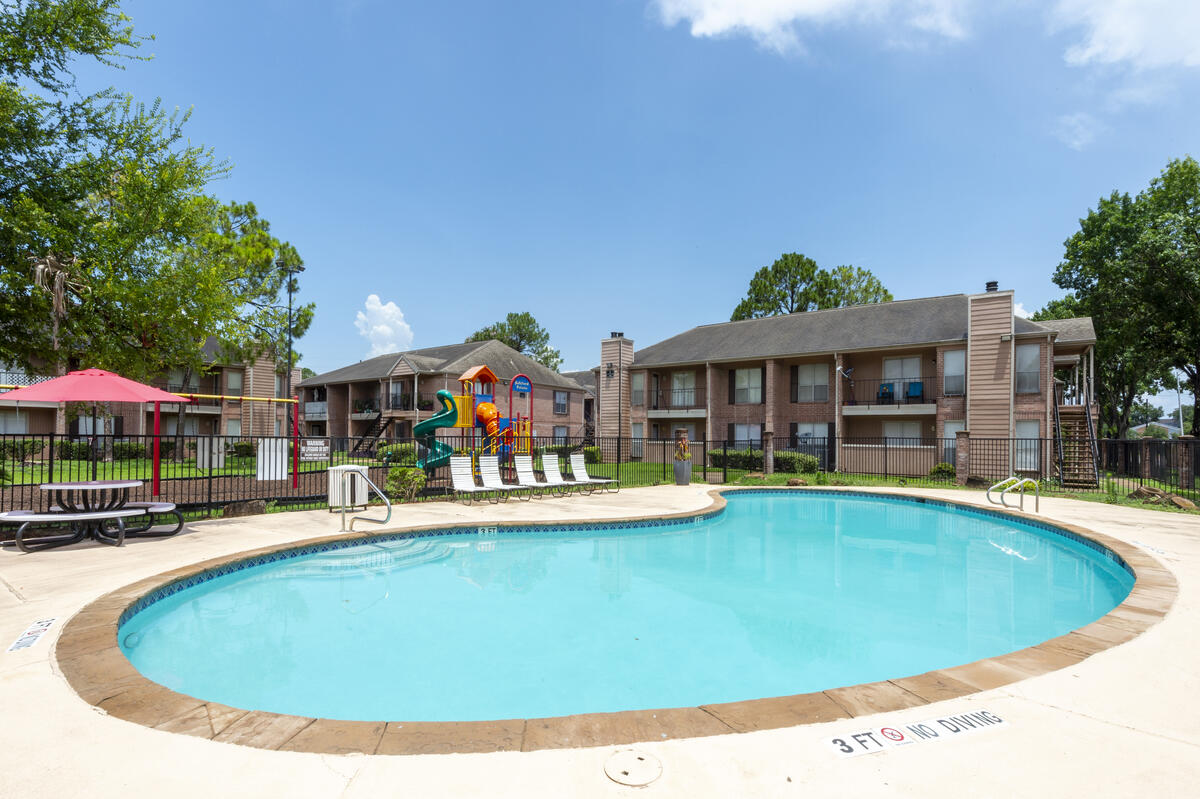
The Property is a Class B asset located in the West Houston market that is above-market occupancy and can achieve rental increases with an interior renovation program and improved project amenities. The purchase price is below replacement cost and the market is experiencing rental growth.
Unit Mix
| # of Units | Avg SF/Unit | Current Rent | Rent per SF | Post-Reno Rent | Post-Reno Rent per SF | |
| 1/1 | 64 | 510 | $701 | $1.38 | $850 | $1.67 |
| 1/1 | 80 | 625 | $797 | $1.28 | $975 | $1.56 |
| 2/1 | 52 | 780 | $902 | $1.16 | $1,050 | $1.35 |
| 2/2 | 28 | 879 | $987 | $1.12 | $1,200 | $1.37 |
| Total/Averages | 224 | 660 | $818 | $1.24 | $985 | $1.49 |
Lease Comparables
| Apex at Royal Oaks | Artesian on Westheimer | Ashford Court | Knox at Westchase | The Ranch at Shadow Lake | Westchase Forest | Averages | Subject | |
| Year Built | 2003 | 2009 | 1983 | 1999 | 1999 | 1999 | 1999 | 1983 |
| # of Units | 282 | 660 | 442 | 518 | 624 | 400 | 488 | 224 |
| Distance from Subject | 3.4 mi | 2.3 mi | 0.6 mi | 1.9 mi | 2.0 mi | 3.0 mi | 2.2 mi | |
| $/Unit (1x1) | $1,251 | $998 | $724 | $1,104 | $1,023 | $1,099 | $1,033 | $919 |
| SF (1x1) | 707 | 812 | 548 | 711 | 650 | 729 | 693 | 568 |
| $/SF (1x1) | $1.77 | $1.23 | $1.32 | $1.55 | $1.57 | $1.51 | $1.49 | $1.62 |
| $/Unit (2x2) | $1,636 | $1,457 | $1,001 | $1,474 | $1,386 | $1,350 | $1,384 | $1,200 |
| SF (2x2) | 1,132 | 1,142 | 957 | 1,153 | 1,175 | 967 | 1,088 | 879 |
| $/SF (2x2) | $1.45 | $1.28 | $1.05 | $1.28 | $1.18 | $1.40 | $1.27 | $1.37 |
Sales Comparables
| Westchase Forest | Legacy at Westchase | Village at Westchase | Cambridge Place | Crosby at Westchase | Hudson at Westchase | Camden Oak Crest | Averages | Subject | |
| Date Sold | U/C | U/C | U/C | Dec-21 | Nov-21 | Nov-21 | Oct-21 | Apr-25 | |
| Year Built | 1999 | 1977 | 1980 | 1980 | 1981 | 1981 | 2003 | 1986 | 1983 |
| # of Units | 400 | 324 | 462 | 336 | 257 | 312 | 364 | 351 | 224 |
| Average Unit Size | 841 SF | 751 SF | 794 SF | 771 SF | 833 SF | 803 SF | 870 SF | 809 SF | 660 SF |
| Sale Price | $67,200,000 | $33,372,000 | $48,500,000 | $32,525,000 | $22,583,480 | $27,416,520 | $65,250,000 | $42,406,714 | $26,847,839 |
| $/Unit | $168,000 | $103,000 | $104,978 | $96,801 | $87,873 | $87,873 | $179,258 | $118,255 | $119,856 |
| $/SF | $200 | $137 | $132 | $126 | $106 | $109 | $206 | $145 | $182 |
| Building Size | 336,300 SF | 243,170 SF | 366,828 SF | 259,032 SF | 214,055 SF | 250,564 SF | 316,680 SF | 283,804 SF | 147,812 SF |
| Distance from Subject | 3.0 mi | 4.9 mi | 4.3 mi | 3.9 mi | 3.5 mi | 3.5 mi | 2.3 mi | 3.6 mi |

Total Capitalization
| Sources of Funds | $ Amount | $/Unit |
| Debt | $15,800,000 | $70,536 |
| GP Investor Equity | $511,982 | $2,286 |
| LP Investor Equity | $5,215,000 | $23,281 |
| Total Sources of Funds | $21,526,982 | $96,103 |
| Uses of Funds | $ Amount | $/Unit |
| Purchase Price Including Prepay estimate | $17,628,000 | $78,696 |
| Closing Costs(1) | $689,829 | $3,080 |
| CapEx Budget | $2,349,834 | $10,490 |
| Acquisition Fee | $299,676 | $1,338 |
| Reserves & Escrows | $275,343 | $1,229 |
| Loan Fee | $134,300 | $600 |
| Working Capital | $150,000 | $670 |
| Total Uses of Funds | $21,526,982 | $96,103 |
(1) RM Technologies, LLC, an affiliate of RealtyMogul, operates the RealtyMogul Platform. RM Technologies, LLC charges a fixed, non-percentage-based fee for real estate companies and their sponsors to use the Platform and for Platform-related services. Please see the Fees and Disclaimers sections below for additional information concerning fees paid to RM Technologies, LLC. The Sponsor’s equity contribution may consist of friends and family equity and equity from funds controlled by the Sponsor.
The expected terms of the debt financing are as follows:
- Lender: TBD
- Term: 2+1+1+1
- LTV / LTC: 59% / 73%
- Estimated Proceeds: $15,800,000
- Interest Type: Floating
- SOFR Rate Cap: 2.25%
- Interest-Only Period: Full-Term
- Prepayment Terms: 18 months minimum interest
- Extension Requirements:
- 1st: No Test
- 2nd: 7.00% (Debt Yield)
- 3rd: 7.15% (Debt Yield)
There can be no assurance that the Sponsor will secure debt on the rates and terms noted above, or at all. All of the Sponsor’s estimated rates and terms of the debt financing are subject to lender approval, including but not limited to possible increases in capital reserve requirements for funds to be held in a lender-controlled capital reserve account.
A substantial portion of the total acquisition for the Property will be paid with borrowed funds. The use of borrowed money to acquire real estate is referred to as leveraging. Leveraging increases the risk of loss. If the Sponsor were unable to pay the payments on the borrowed funds (called a "default"), the lender might foreclose, and the Sponsor could lose its investment in its property.
LXMI Capital intends to make distributions as follows:
- To the Investors, pari passu, all operating cash flows to an 8.0% IRR;
- 70% / 30% (70% to Investors / 30% to Promoted/Carried Interest) of excess cash flow to a 16.0% IRR;
- 50% / 50% (50% to Investors / 50% to Promoted/Carried Interest) of excess cash flow thereafter.
LXMI Capital intends to make distributions to investors after the payment of the company's liabilities (loan payments, operating expenses, and other fees as more specifically set forth in the LLC agreements, in addition to any member loans or returns due on member loan).
Distributions are expected to start in November 2022 and are projected to continue on a quarterly basis thereafter. Distributions are at the discretion of LXMI Capital, who may decide to delay distributions for any reason, including maintenance or capital reserves.
LXMI Capital will receive a promoted/carried interest as indicated above, and a portion of this promoted/carried interest may be received by RM Admin, LLC.
| Cash Flow Summary | ||||
| Year 1 | Year 2 | Year 3 | ||
| Effective Gross Revenue | $2,474,911 | $2,700,776 | $2,855,014 | |
| Total Operating Expenses | $1,437,677 | $1,500,037 | $1,563,070 | |
| Net Operating Income | $1,037,234 | $1,200,740 | $1,291,945 | |
| Project-Level Cash Flows | ||||
| Year 0 | Year 1 | Year 2 | Year 3 | |
| Net Cash Flow | ($5,726,982) | $157,845 | $259,628 | $11,217,625 |
| Investor-Level Cash Flows(1) | ||||
| Year 0 | Year 1 | Year 2 | Year 3 | |
| Net Cash Flow | ($5,215,000) | $91,584 | $184,268 | $8,624,098 |
| Investor-Level Cash Flows - Hypothetical $50,000 Investment(1) | ||||
| Year 0 | Year 1 | Year 2 | Year 3 | |
| Net Cash Flow | ($50,000) | $878 | $1,767 | $82,685 |
(1) Returns are net of all fees. Such Fees include fees paid to RM Admin, an affiliate of RealtyMogul, who charges an annual fixed administrative fee for providing certain ongoing administrative services to the Sponsor. Please see the Fees and Disclaimers sections and Disclaimers sections below for additional information concerning fees paid to RM Admin.
RM Technologies, LLC and its affiliates does not provide any assurance of returns. The content on this Page, including Sponsor’s pro forma projections, was provided by the Sponsor or an affiliate thereof. Although RM Technologies, LLC believes the Sponsor reliably produced this content, RM Technologies, LLC makes no representations or warranties as to the accuracy of such information and accepts no liability therefor. The assumptions and projections included in the content on this Page, including the Sponsor’s pro forma projections, are not reflective of the position of RM Technologies, LLC or any other person or entity other than the Sponsor or its affiliates. There can be no assurances that all or any of the Sponsor’s assumptions will be true, that actual performance will bear any relation to these hypothetical illustrations, or that the Sponsor’s investment objectives will be achieved. For additional information concerning the Sponsor’s assumptions and projections, and the significant risks involved in investing in real estate, please see the Disclaimers section below.
Certain fees and compensation will be paid over the life of the transaction; please refer to LXMI Capital's materials for details. The following fees and compensation will be paid(1)(2)(3)(4):
| Real Estate Company Fees: | ||||
| Type of Fee | Amount of Fee | Received By | Paid From | |
| Acquisition Fee | 1.7% of Purchase Price | Real Estate Company | Capitalized Cost | |
| Construction Management Fee | 7.0% of Development/Construction Costs | Real Estate Company | Capitalized Cost | |
| Recurring Fees: | ||||
| Type of Fee | Amount of Fee | Received By | Paid From | |
| Administrative Services Fee | 1.0% of Equity Invested(1) | RM Admin, LLC(4) | Cash Flow | |
| Asset Management Fee | 1.5% of Effective Gross Income | Real Estate Company | Cash Flow | |
(1) Only applies to equity raised through the RealtyMogul Platform
(2) Fees may be deferred to reduce impact to investor distributions.
(3) RM Technologies, LLC, an affiliate of RealtyMogul, operates the RealtyMogul Platform. RM Technologies, LLC charges a fixed, non-percentage-based fee for real estate companies and their sponsors to use the RM Technologies, LLC’s proprietary Platform and receive Platform-related services. An estimate of this fee is included in the Closing Costs above and is intended to be capitalized into the transaction at the discretion of the Sponsor. The Platform fees received by RM Technologies, LLC are disclosed in the relevant operating agreement(s). RM Technologies LLC’s receipt of Platform fees creates a conflict of interest between RealtyMogul and its affiliates, and investors or prospective investors.
(4) RM Admin, an affiliate of RealtyMogul, charges an annual fixed administrative fee for providing certain ongoing administrative services to the Sponsor. RM Admin’s administrative services and fees are disclosed in the relevant operating agreement(s). RM Admin’s receipt of administrative fees creates a conflict of interest between RealtyMogul and its affiliates, and investors or prospective investors.
The information on this Page is qualified in its entirety by reference to the more complete information about the offering contained in the Sponsor’s Investment Documents. The information on this Page is not complete and subject to change at the Sponsor’s discretion at any time up to the closing date. The Sponsor’s Investment Documents and supplements thereto contain important information about the Sponsor’s offering including relevant investment objectives, the business plan, risks, charges, expenses, and other information, which you should consider carefully before investing. The information on this Page should not be used as a basis for an investor’s decision to invest.
Risk of InvestmentThis investment is speculative, highly illiquid, and involves substantial risk. There can be no assurances that all or any of Sponsor’s assumptions, expectations, estimates, goals, hypothetical illustrations, or other aspects of Sponsor’s business plans (“Assumptions”) will be true or that actual performance will bear any relation to Sponsor’s Assumptions, and no guarantee or representation is made that Sponsor’s Assumptions will be achieved. If Sponsor does not achieve its Assumptions, your investment could be materially and adversely affected. A loss of part or all of the principal value of your investment may occur. You should not invest unless you can readily bear the consequences of such loss. Sponsor’s Assumptions should not be relied upon as the primary basis for your decision to invest.
No Reliance on Forward-Looking Statements; Sponsor AssumptionsSponsor is solely responsible for statements made concerning forward-looking statements and Assumptions, which apply only as of the date made, are preliminary and subject to change, and are expressly qualified in their entirety by the disclosures and cautionary statements included in Sponsor’s Investment Documents, which you should carefully review. Sponsor is obligated to update or revise such forward-looking statements or Assumptions to reflect events or circumstances that arise after the date made or to reflect the occurrence of unanticipated events. Sponsor’s forward-looking statements and Assumptions are hypothetical, not based on actual investment achievements or events, and are presented solely for purposes of providing insight into the Sponsor’s investment objectives, detailing Sponsor’s anticipated risk and reward characteristics, and establishing a benchmark for future evaluation of actual results; therefore, they are not a predictor, projection, or guarantee of future results. You should not rely on Sponsor’s forward-looking statements as a basis to invest.
Importantly, we do not adopt, endorse, or provide any assurance of returns or as to the accuracy or reasonableness of Sponsor’s Assumptions or forward-looking statements.
No Reliance on Past PerformanceAny description of past performance is not a reliable indicator of future performance and should not be relied upon as the primary basis to invest.
Sponsor’s Use of DebtA substantial portion of the total cost of the real estate asset acquired by the Sponsor with investor funds (“Property”) will be paid with borrowed funds, i.e., debt. Sponsor’s estimated rates and terms of the debt financing are subject to lender approval, and there is no assurance that the Sponsor will secure debt at the rates and terms presented on this Page or in the Sponsor’s Investment Documents, or at all. The use of borrowed money to acquire real estate is referred to as leveraging, which can amplify losses and could result in lender foreclosure. In addition, if the debt includes a variable (or “floating”) interest rate, the total amount of interest paid over the term of the debt will fluctuate and can increase. As a result, Sponsor’s use of debt can result in a loss of some or all of your investment.
Sponsor’s Offering is Not RegisteredSponsor’s securities offering will not be registered under the Securities Act of 1933, as amended (the “Securities Act”), in reliance upon the exemptions from registration pursuant to Rule 506(c) of Regulation D as promulgated under the Securities Act (“Private Placement”). In addition, the offering will not be registered under any state securities laws in reliance on exemptions from state registration. Such securities (your ownership interests) are subject to restrictions on transferability and resale and may not be transferred or resold except as permitted under applicable state and federal securities laws pursuant to registration or an available exemption. All Private Placements on the Platform are intended solely for “Accredited Investors,” as that term is defined in Rule 501(a) under the Securities Act.
No Investment AdviceNothing on this Page should be regarded as investment advice (either with respect to a particular security or regarding an overall investment strategy), a recommendation, an offer to sell, or a solicitation of or an offer to buy any security. Advice from a securities professional is strongly advised to understand and assess the risks associated with real estate or private placement investments.
1031 Exchange RiskInternal Revenue Code Section 1031 (“Section 1031”) contains complex tax concepts and certain tax consequences may vary depending on the individual circumstances of each investor. You should consult with and rely on your own tax advisor about the tax aspects with respect to your particular circumstances.