


Ballast Investments ("Ballast" or the "Sponsor") is a privately-held, San Francisco-based, vertically-integrated real estate platform that invests in residential properties across the western United States. Ballast has 173 employees in various roles within the company, including acquisitions, architecture and construction management, finance and accounting, and property management. Ballast employs a value-add strategy focused on buying smaller, undermanaged properties and driving returns through unit renovations/conversions and active leasing. The Company currently owns and operates a real estate portfolio of 140+ multi-family buildings consisting of approximately 2,300+ units, as well as a mid-sized portfolio of single-family homes across western states. Ballast maintains strategic equity and debt partnerships, as well as vendor relationships with local real estate professionals to execute on behalf of clients.
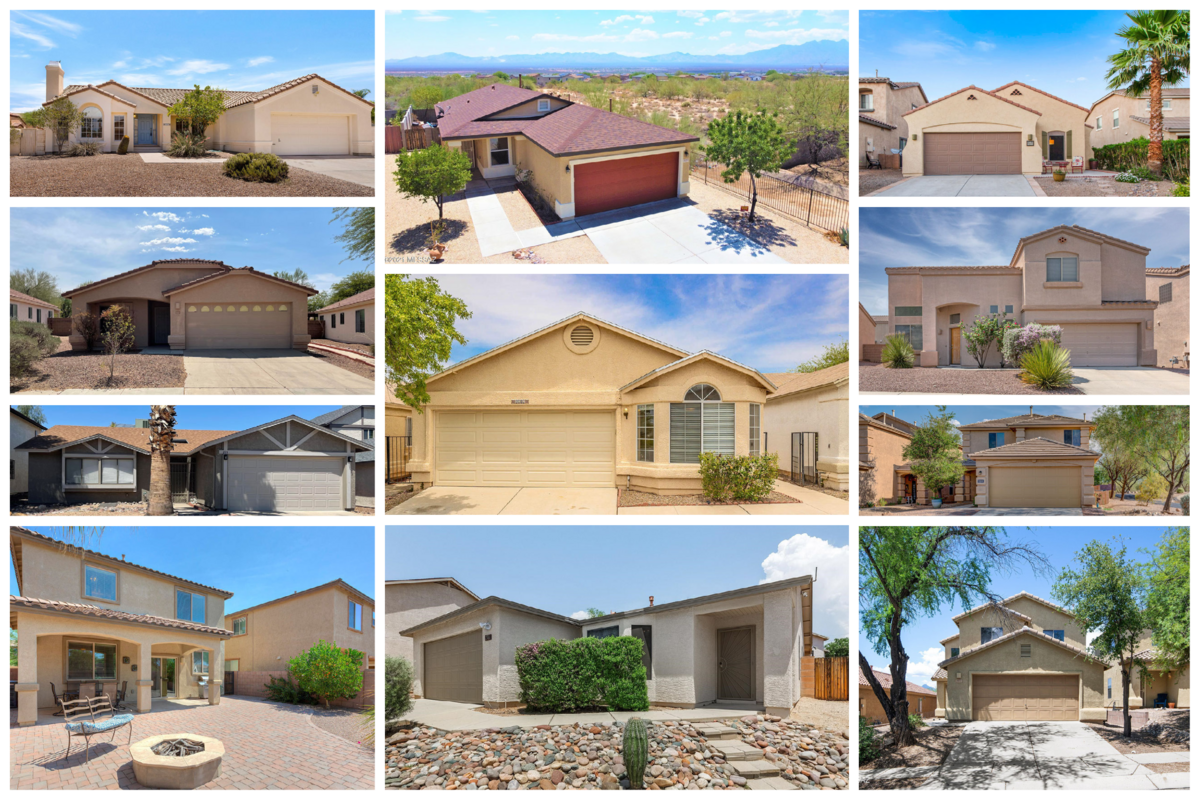
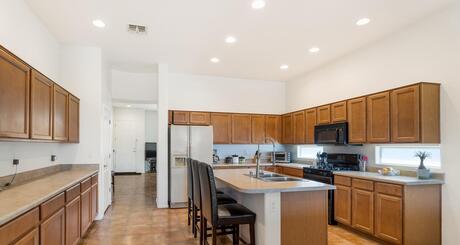
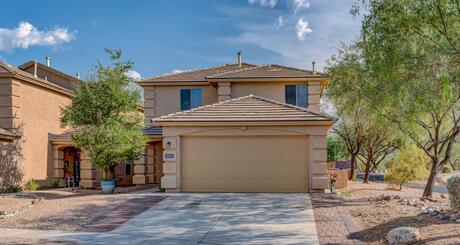
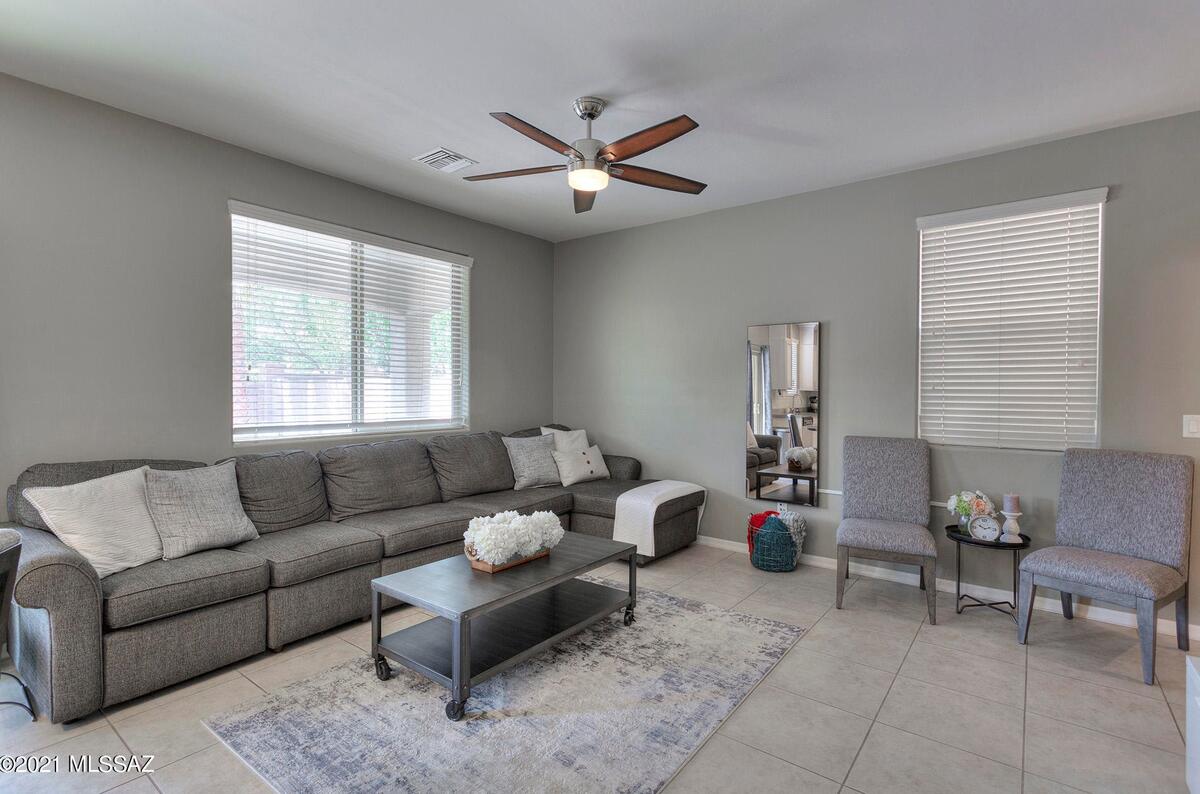
Over the last 1.5 months, Ballast has acquired 50 single-family rental homes at price points 12% below the median home sales price in Tucson, across some of the most highly sought after neighborhoods in the region. Household income within 1-mile of their average home exceeds $80,000, which is approximately 44% higher than the average income across the Tucson MSA. The average home in the portfolio is a 23-year old 3-bedroom, 2-bath with stucco exteriors and 1,792 SF of living space situated on a 5,500 SF lot. Over half of our homes have tile roofs, 80% have tile flooring in the common areas, and all have minimal landscaping expense due to drought tolerant plants which positions the portfolio to have minimal capital expenditures over the hold period.
| Market | # of Homes | Avg SF | Avg Rent (In-Place) |
Avg Rent (Stabilized) |
Rent per SF |
| Tucson, AZ | 50 | 1,792 | $1,872 | $2,057 | $1.15 |
| Total/Averages | 50 | 1,792 | $1,872 | $2,057 | $1.15 |
Lease Comparables
| 3696 W Sunglade Dr | 9670 E Mount Baldy Way | 10899 S Lake Gambusi Dr | 640 N Highlands Grove Ln | Averages | Subject | |||
| Year Built | 1994 | 2000 | 2004 | 2009 | 2001 | 1998 | ||
| Home Type | 4x3 | 4x2 | 4x2 | 4x3 | 3x2 | |||
| Rent Achieved | $2,000 | $2,000 | $2,000 | $1,950 | $1,988 | $1,872 | ||
| Unit Size | 1,859 SF | 1,907 SF | 1,812 SF | 1,877 SF | 1,864 SF | 1,792 SF | ||
| Average $/SF | $1.08 | $1.05 | $1.10 | $1.04 | $1.07 | $1.04 | ||
Acquisition Comparables
| 2531 W Camino De La Joya | 25 S London Station Rd | 10438 S Painted Mare Dr | 13864 S Camino Acelga | Averages | Subject | |||
| Submarket | North | East | Vail | Green Valley / Sahuarita | ||||
| Date Sold | Jul-21 | Jun-21 | Jul-21 | Jul-21 | ||||
| Year Built | 1988 | 1993 | 2011 | 2017 | 2002 | 1998 | ||
| Home Type | 3x2 | 3x2 | 3x2 | 3x2 | 3x2 | |||
| Unit Size | 1,703 SF | 1,844 SF | 1,717 SF | 1,791 SF | 1,764 SF | 1,792 SF | ||
| Sale Price | $305,000 | $330,300 | $317,000 | $295,000 | $311,825 | $299,076 | ||
| $/SF | $179 | $179 | $185 | $165 | $177 | $167 | ||
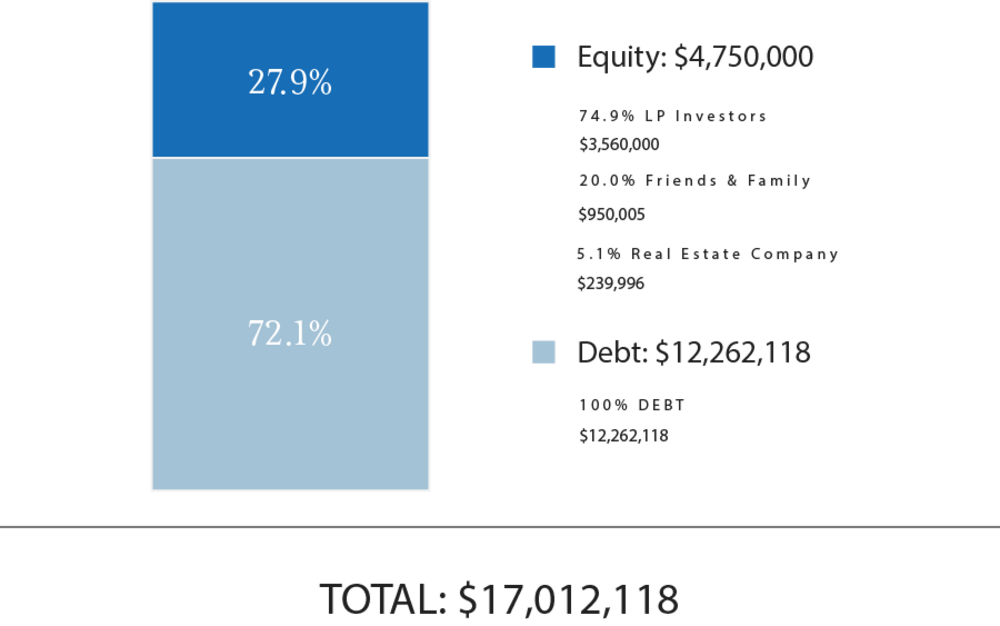
Total Capitalization
| Sources of Funds | $ Amount | $/Unit |
| Debt | $12,262,118 | $245,242 |
| GP Investor Equity | $239,996 | $4,800 |
| GP Investor F&F(3) | $950,005 | $19,000 |
| LP Investor Equity | $3,560,000 | $71,200 |
| Total Sources of Funds | $17,012,118 | $340,242 |
| Uses of Funds | $ Amount | $/Unit |
| Purchase Price | $14,953,802 | $299,076 |
| Acquisition Fee | $149,538 | $2,991 |
| Capital Improvements | $966,272 | $19,325 |
| Closing / Legal(1) | $382,282 | $7,646 |
| Loan Fee(2) | $429,174 | $8,583 |
| Other | $654,043 | $13,081 |
| Operating CF Offset | ($522,993) | ($10,460) |
| Total Uses of Funds | $17,012,118 | $340,242 |
The Sponsor’s equity contribution may consist of friends and family equity and equity from funds controlled by the Sponsor.
(1) RM Technologies, LLC, an affiliate of RealtyMogul, operates the RealtyMogul Platform. RM Technologies, LLC charges a fixed, non-percentage-based fee for real estate companies and their sponsors to use the Platform and for Platform-related services. Please see the Fees and Disclaimers sections below for additional information concerning fees paid to RM Technologies, LLC.
(2) Loan fees include 2 debt instruments - the acquisition financing and the permanent financing. Refinance is taking place early on in the hold period.
(3) Capital raised by friends and family of Ballast Investments' principals and employees.
The expected terms of the debt financing are as follows:
Acquisition Loan:
- Lender: LendingOne
- Term: 1 Year
- Loan-to-Value: 82.0%
- Estimated Proceeds: $12,262,118
- Interest Type: Fixed
- Annual Interest Rate: 6.0%
- Interest-Only Period: 1 Years
- Amortization: Interest Only
Permanent Loan:
- Lender: LendingOne
- Term: 3 Years
- Estimated Proceeds: $12,262,118
- Interest Type: Interest Only
- Annual Interest Rate: 4.45%
- Interest-Only Period: 3 Years
- Amortization: Interest Only
There can be no assurance that the Sponsor will secure debt on the rates and terms noted above, or at all. All of the Sponsor’s estimated rates and terms of the debt financing are subject to lender approval, including but not limited to possible increases in capital reserve requirements for funds to be held in a lender-controlled capital reserve account.
A substantial portion of the total acquisition for the Property will be paid with borrowed funds. The use of borrowed money to acquire real estate is referred to as leveraging. Leveraging increases the risk of loss. If the Sponsor were unable to pay the payments on the borrowed funds (called a "default"), the lender might foreclose, and the Sponsor could lose its investment in its property.
(1) The homes were acquired using mortgages for each individual property. The Sponsor has engaged a lender to refinance the portfolio into cheaper debt upon stabilization in month 8.
Ballast Investments intends to make distributions from KH Investor 2 LLC as follows:
- To the Investors, pari passu, all operating cash flows to an 8.0% return;
- 75% / 25% (75% to Investors / 25% to Promote) of excess cash flow to a 12% return;
- 65% / 35% (65% to Investors / 35% to Promote) of excess cash flow to a 15% return;
- 55% / 45% (55% to Investors / 45% to Promote) of excess cash flow thereafter.
Ballast Investments intends to make distributions to investors after the payment of both company's liabilities (loan payments, operating expenses, and other fees as more specifically set forth in the LLC agreements, in addition to any member loans or returns due on member loan).
Distributions are expected to start in November 2024 and are projected to continue on a quarterly basis thereafter. Distributions are at the discretion of Ballast Investments, who may decide to delay distributions for any reason, including maintenance or capital reserves. Ballast Investments will receive a promote as indicated above, and a portion of this promote may be received by RM Admin, LLC for administrative services.
| Cash Flow Summary | ||||||
| Year 1 | Year 2 | Year 3 | ||||
| Effective Gross Revenue | $1,158,939 | $1,249,606 | $1,309,902 | |||
| Total Operating Expenses | ($331,679) | ($342,748) | ($352,116) | |||
| Net Operating Income | $827,260 | $906,858 | $957,785 | |||
| Project-Level Cash Flows | ||||||
| Year 0 | Year 1 | Year 2 | Year 3 | |||
| Net Cash Flow | ($4,750,000) | $0 | $0 | $8,714,176 | ||
| Investor-Level Cash Flows(1) | ||||||
| Year 0 | Year 1 | Year 2 | Year 3 | |||
| Net Cash Flow | ($3,560,000) | $0 | $0 | $5,707,827 | ||
| Investor-Level Cash Flows - Hypothetical $50,000 Investment(1) | ||||||
| Year 0 | Year 1 | Year 2 | Year 3 | |||
| Net Cash Flow | ($50,000) | $0 | $0 | $80,166 | ||
(1) Returns are net of all fees. Such Fees include fees paid to RM Admin, an affiliate of RealtyMogul, who charges an annual fixed administrative fee for providing certain ongoing administrative services to the Sponsor. Please see the Fees and Disclaimers sections and Disclaimers sections below for additional information concerning fees paid to RM Admin.
RM Technologies, LLC and its affiliates does not provide any assurance of returns. The content on this Page, including Sponsor’s pro forma projections, was provided by the Sponsor or an affiliate thereof. Although RM Technologies, LLC believes the Sponsor reliably produced this content, RM Technologies, LLC makes no representations or warranties as to the accuracy of such information and accepts no liability therefor. The assumptions and projections included in the content on this Page, including the Sponsor’s pro forma projections, are not reflective of the position of RM Technologies, LLC or any other person or entity other than the Sponsor or its affiliates. There can be no assurances that all or any of the Sponsor’s assumptions will be true, that actual performance will bear any relation to these hypothetical illustrations, or that the Sponsor’s investment objectives will be achieved. For additional information concerning the Sponsor’s assumptions and projections, and the significant risks involved in investing in real estate, please see the Disclaimers section below.
Certain fees and compensation will be paid over the life of the transaction; please refer to Ballast Investments' materials for details. The following fees and compensation will be paid(1)(2)(3):
| One Time Fees: | |||||
| Type of Fee | Amount of Fee | Received By | Paid From | ||
| Acquisition Fee | 1.0% of Purchase Price | Ballast | Deal Capitalization | ||
| Recurring Fees: | |||||
| Type of Fee | Amount of Fee | Received By | Paid From | ||
| Asset Management Fee | 1.0% of Equity | Ballast | Cash Flow | ||
| Construction Management Fee | 7.0% of CapEx | Ballast | Deal Capitalization / Cash Flow | ||
| Administrative Services Fee | 1.0% of Equity* | RM Admin(3) | Cash Flow | ||
*Only applies to equity raised through the RealtyMogul Platform
(1) Fees may be deferred to reduce impact to investor distributions.
(2) RM Technologies, LLC, an affiliate of RealtyMogul, operates the RealtyMogul Platform. RM Technologies, LLC charges a fixed, non-percentage-based fee for real estate companies and their sponsors to use the RM Technologies, LLC’s proprietary Platform and receive Platform-related services. An estimate of this fee is included in the Closing Costs above and is intended to be capitalized into the transaction at the discretion of the Sponsor. The Platform fees received by RM Technologies, LLC are disclosed in the relevant operating agreement(s). RM Technologies LLC’s receipt of Platform fees creates a conflict of interest between RealtyMogul and its affiliates, and investors or prospective investors.
(3) RM Admin, an affiliate of RealtyMogul, charges an annual fixed administrative fee for providing certain ongoing administrative services to the Sponsor. RM Admin’s administrative services and fees are disclosed in the relevant operating agreement(s). RM Admin’s receipt of administrative fees creates a conflict of interest between RealtyMogul and its affiliates, and investors or prospective investors.
RM Securities, LLC, its registered representatives, affiliates, associated persons, and personnel of its affiliates who may also be associated with it, including our associated persons and personnel of our affiliates who are also be associated with RM Securities, LLC (it (“RM Securities,” “we,” “our,” or “us”) will receive fees, expense reimbursements, and other compensation (“Fees”) from the issuer of this investment offering, its sponsor, or an affiliate thereof (“Sponsor”), or otherwise in connection with Sponsor’s offering. The Fees paid to us are in addition to other fees you will pay to Sponsor or in connection with Sponsor’s investment offering. You will pay Fees to Sponsor, either directly or indirectly as an investor in the Sponsor’s offering. Sponsor will use the Fees you pay, as well as funds you invest in the relevant offering, to compensate us. The Fees paid to us will directly or indirectly be borne by you as the investor (typically, but not always, in the form of an expense of the Sponsor’s offering in which you invest) because such Fees will reduce the proceeds available for distribution to you and reduce the amount you earn over time.
For more information on the Fees paid to us, or any other Fees you will pay in connection with Sponsor’s offering, please carefully review the Sponsor’s Investment Documents. Please also carefully review RM Securities’ Form CRS, Regulation Best Interest Disclosures, and Limited Brokerage Services Agreement.
No Approval, Opinion or Representation, or Warranty by RM Securities, LLCSponsor has provided, approved, and is solely responsible in all aspects for the information on this webpage (“Page”), including Sponsor’s offering documentation, which may include without limitation the Private Placement Memorandum, Operating or Limited Partnership Agreement, Subscription Agreement, the Project Summary and all exhibits and other documents attached thereto or referenced therein (collectively, the “Investment Documents”). The Investment Documents linked on this page have been prepared and posted by Sponsor, and not by RM Securities. We did not assist in preparing, do not adopt or endorse, and we are not otherwise responsible for, the Sponsor’s Investment Documents. We make no representations or warranties as to the accuracy of information on this Page or in the Sponsor’s Investment Documents and we accept no liability therefor. No part of the information on this Page or in the Sponsor’s Investment Documents is intended to be binding on us.
Sponsor’s Information Qualified by Investment DocumentsThe information on this Page is qualified in its entirety by reference to the more complete information about the offering contained in the Sponsor’s Investment Documents. The information on this Page is not complete and subject to change at the Sponsor’s discretion at any time up to the closing date. The Sponsor’s Investment Documents and supplements thereto contain important information about the Sponsor’s offering including relevant investment objectives, the business plan, risks, charges, expenses, and other information, which you should consider carefully before investing. The information on this Page should not be used as a basis for an investor’s decision to invest.
Risk of InvestmentThis investment is speculative, highly illiquid, and involves substantial risk. There can be no assurances that all or any of Sponsor’s assumptions, expectations, estimates, goals, hypothetical illustrations, or other aspects of Sponsor’s business plans (“Assumptions”) will be true or that actual performance will bear any relation to Sponsor’s Assumptions, and no guarantee or representation is made that Sponsor’s Assumptions will be achieved. If Sponsor does not achieve its Assumptions, your investment could be materially and adversely affected. A loss of part or all of the principal value of your investment may occur. You should not invest unless you can readily bear the consequences of such loss. Sponsor’s Assumptions should not be relied upon as the primary basis for your decision to invest.
No Reliance on Forward-Looking Statements; Sponsor AssumptionsSponsor is solely responsible for statements made concerning forward-looking statements and Assumptions, which apply only as of the date made, are preliminary and subject to change, and are expressly qualified in their entirety by the disclosures and cautionary statements included in Sponsor’s Investment Documents, which you should carefully review. Neither RM Securities nor Sponsor are obligated to update or revise such forward-looking statements or Assumptions to reflect events or circumstances that arise after the date made or to reflect the occurrence of unanticipated events. Sponsor’s forward-looking statements and Assumptions are hypothetical, not based on actual investment achievements or events, and are presented solely for purposes of providing insight into the Sponsor’s investment objectives, detailing Sponsor’s anticipated risk and reward characteristics, and establishing a benchmark for future evaluation of actual results; therefore, they are not a predictor, projection, or guarantee of future results. You should not rely on Sponsor’s forward-looking statements as a basis to invest.
Importantly, we do not adopt, endorse, or provide any assurance of returns or as to the accuracy or reasonableness of Sponsor’s Assumptions or forward-looking statements.
No Reliance on Past PerformanceAny description of past performance is not a reliable indicator of future performance and should not be relied upon as the primary basis to invest.
Sponsor’s Use of DebtA substantial portion of the total cost of the real estate asset acquired by the Sponsor with investor funds (“Property”) will be paid with borrowed funds, i.e., debt. Sponsor’s estimated rates and terms of the debt financing are subject to lender approval, and there is no assurance that the Sponsor will secure debt at the rates and terms presented on this Page or in the Sponsor’s Investment Documents, or at all. The use of borrowed money to acquire real estate is referred to as leveraging, which can amplify losses and could result in lender foreclosure. In addition, if the debt includes a variable (or “floating”) interest rate, the total amount of interest paid over the term of the debt will fluctuate and can increase. As a result, Sponsor’s use of debt can result in a loss of some or all of your investment.
Sponsor’s Offering is Not RegisteredSponsor’s securities offering will not be registered under the Securities Act of 1933, as amended (the “Securities Act”), in reliance upon the exemptions from registration pursuant to Rule 506(c) of Regulation D as promulgated under the Securities Act (“Private Placement”). In addition, the offering will not be registered under any state securities laws in reliance on exemptions from state registration. Such securities (your ownership interests) are subject to restrictions on transferability and resale and may not be transferred or resold except as permitted under applicable state and federal securities laws pursuant to registration or an available exemption. All Private Placements on the Platform are intended solely for “Accredited Investors,” as that term is defined in Rule 501(a) under the Securities Act.
No Investment AdviceNothing on this Page should be regarded as investment advice (either with respect to a particular security or regarding an overall investment strategy), a recommendation, an offer to sell, or a solicitation of or an offer to buy any security. Advice from a securities professional is strongly advised to understand and assess the risks associated with real estate or private placement investments. For additional information on RM Securities’ involvement in this offering, please carefully review the Sponsor’s Investment Documents, and RM Securities’ Form CRS, Regulation Best Interest Disclosures, and Limited Brokerage Services Agreement.
1031 Exchange RiskInternal Revenue Code Section 1031 (“Section 1031”) contains complex tax concepts and certain tax consequences may vary depending on the individual circumstances of each investor. RM Securities and its affiliates make no representation or warranty of any kind with respect to the tax consequences of your investment or that the IRS will not challenge any such treatment. You should consult with and rely on your own tax advisor about the tax aspects with respect to your particular circumstances.