


ParaWest Group (PWG)(1) brings together the collective experience of Curtis Haines, Michael Salkeld, Delane Salkeld, and CRSC Residential, Inc. through its President and CEO, Bryan Krizek. These principals bring to the table decades of experience in multi-family investments and operations both individually and collectively resulting in in-depth knowledge and experience that is unsurpassed in the industry. PWG focuses solely on multi-family properties in select markets. As an investment arm of these principals, PWG is an investment platform that includes ParaWest Management(2), thus creating a fully integrated platform for multi-family investments. This platform extends from sourcing and acquisitions to financing and equity structuring, renovation and operations, and ultimately disposition. ParaWest Group, through its principals, has created a strategic advantage in sourcing, underwriting, and closing opportunistic value-add multi-family properties and since its inception in 2012, has participated in the acquisition and investment in twenty-three properties totaling more than 4,000 units.
As a repeat Sponsor on the RealtyMogul Platform, Bay Island at Lake Ray Hubbard will be ParaWest Group’s fifth transaction with Realty Mogul. The first two deals have now gone full cycle (i.e. through sale) with the first having closed in June 2022, and generated an IRR to Investors of 27%, and the second, currently in escrow and scheduled to close during the third quarter, generating a projected Investor IRR of 24%. Both deals had proforma returns of 15.9% each.
Notes:
1) ParaWest Group, LLC is a pass-through entity and its principals invest as individuals in single ownership entities on each transaction.
2) ParaWest Management has been in business since 2003 and is solely owned by Michael and Delane Salkeld.
Idlewood Park is a Class B property located in southwest Houston one mile west of Beltway 8 on the outskirts of the City of Sugarland, one of the fastest-growing and most desirable cities in the nation. The Property will be renovated to contemporize unit interiors, building exteriors, and common area amenities in order to reposition it as a submarket leader and achieve rent levels at the top of its market.
Unit Mix
| Unit Type | # of Units | Avg SF/Unit | Avg Rent (In-Place) | Avg Rent (Stabilized) | Post-reno rent per SF |
| 1x1 | 60 | 474 | $741 | $825 | $1.74 |
| 1x1 | 60 | 584 | $776 | $870 | $1.49 |
| 1x1 | 48 | 680 | $834 | $910 | $1.34 |
| 2x1 | 36 | 788 | $961 | $995 | $1.26 |
| 2x2 | 24 | 860 | $996 | $1,035 | $1.20 |
| 2x2 | 32 | 956 | $1,039 | $1,140 | $1.19 |
| 2x2 | 8 | 1,084 | $1,099 | $1,160 | $1.07 |
| Total/Averages | 268 | 688 | $864 | $940 | $1.41 |
Lease Comparables
| Property Name | Year Built | # of Units | Avg Unit SF | 1 Bed | 2 Bed | Rent/SF |
| Aria at Kirkwood | 2020 | 108 | 767 | $989 | $1,259 | $1.43 |
| Camden Sugar Grove | 1997 | 380 | 917 | $1,112 | $1,379 | $1.36 |
| Advenir at Milan | 2006 | 360 | 935 | $1,007 | $1,278 | $1.25 |
| Timbers of Keegans Bayou | 1982 | 152 | 739 | $824 | $1,009 | $1.19 |
| Resort Townhomes | 1982 | 294 | 1,092 | $1,071 | $1,341 | $1.15 |
| Windfield Townhomes | 1983 | 294 | 1,147 | $1,026 | $1,367 | $1.09 |
| Cambridge Crossing | 1977 | 132 | 1,225 | $1,059 | $0.91 | |
| Average | 975 | $1,005 | $1,242 | $1.20 | ||
| Idlewood Park (Subject) | 1981 | 268 | 688 | $794 | $1,032 | $1.28 |
Sales Comparables
| Property Name | Siena on Westheimer | Los Prados Apartments | Arlington Place Apartments | Cashel Springs | The Atrium at 5606 | Average | Subject (Going-in) |
| Location | Houston, TX | Houston, TX | Houston, TX | Houston, TX | Houston, TX | Houston, TX | |
| Land Size (Acres) | 15.31 | 7.68 | 8.91 | 9.89 | 4.13 | 9.18 | 10.51 |
| Rentable Area (SF) | 478,936 | 206,320 | 205,476 | 230,364 | 129,488 | 250,117 | 184,392 |
| Number of Units | 643 | 264 | 230 | 300 | 144 | 316 | 268 |
| Average Unit Size (SF) | 745 | 782 | 893 | 768 | 899 | 817 | 688 |
| Year Built | 1969 | 1977 | 1972 | 1982 | 1970 | 1974 | 1984 |
| Year Renovated | N/A | 2017 | N/A | 2019 | 2017 | N/A | |
| Occupancy | 90% | 90% | 91% | 92% | 98% | 92% | 96% |
| Condition | Average | Good | Average | Average | N/A | Average | |
| Price | $53,167,417 | $23,350,000 | $21,233,465 | $23,300,000 | $13,455,779 | $26,901,332 | $23,000,000 |
| Price per SF | $111.01 | $113.17 | 103.34 | $101.14 | $103.92 | $106.52 | $125 |
| Price per Unit | $82,686 | $88,447 | $92,319 | $77,667 | $93,443 | $86,912 | $85,821 |
| Cap Rate | 5.00% | 6.50% | 5.64% | 5.22% | 5.00% | 5.47% |
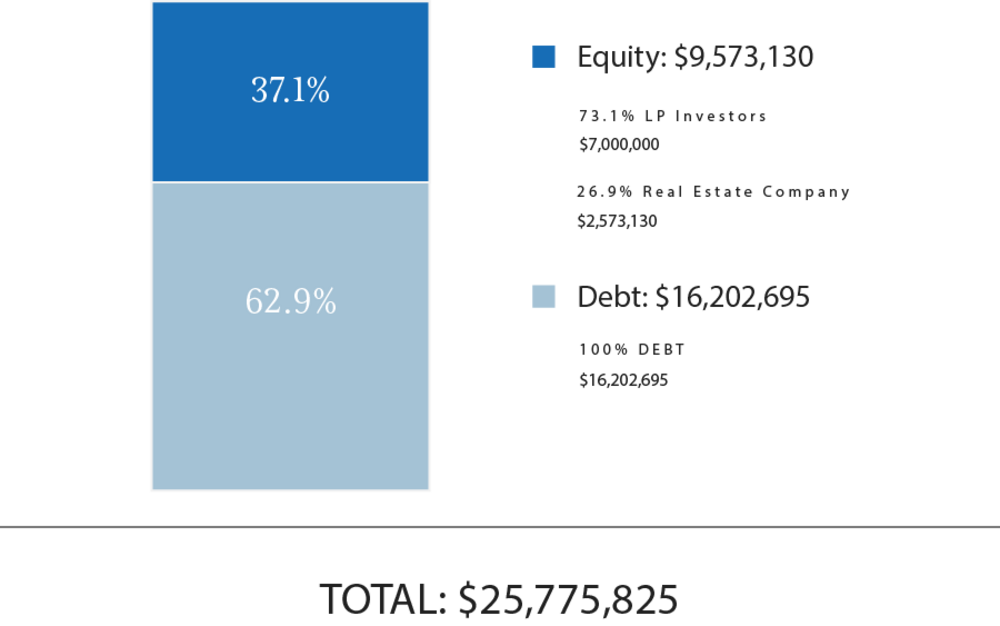
Total Capitalization
| Sources of Funds | $ Amount | $/Unit |
| Debt | $16,202,695 | $60,458 |
| GP Investor Equity | $2,573,130 | $9,601 |
| LP Investor Equity | $7,000,000 | $26,119 |
| Total Sources of Funds | $25,775,825 | $96,178 |
| Uses of Funds | $/Unit | |
| Purchase Price | $23,000,000 | $85,821 |
| Acquisition Fee | $345,000 | $1,287 |
| Loan Fee | $283,547 | $1,058 |
| Closing Costs(1) | $297,278 | $1,110 |
| CapEx | $1,750,000 | $6,530 |
| Working Capital | $100,000 | $373 |
| Total Uses of Funds | $25,775,825 | $96,178 |
The Sponsor’s equity contribution may consist of friends and family equity and equity from funds controlled by the Sponsor.
(1) RM Technologies, LLC, an affiliate of RealtyMogul, operates the RealtyMogul Platform. RM Technologies, LLC charges a fixed, non-percentage-based fee for real estate companies and their sponsors to use the Platform and for Platform-related services. Please see the Fees and Disclaimers sections below for additional information concerning fees paid to RM Technologies, LLC.
The expected terms of the debt financing are as follows:
- Lender: Fannie Mae (Berkeley Point Capital LLC)
- Term: 6 Years
- Loan-to-Value: 70.4%
- Estimated Proceeds: $16,202,695
- Interest Type: Fixed
- Annual Interest Rate: 4.44%
- Interest-Only Period: N/A
- Amortization: 30 Years
- Loan Fees: Estimated at 1% of existing loan balance
There can be no assurance that the Sponsor will secure debt on the rates and terms noted above, or at all. All of the Sponsor’s estimated rates and terms of the debt financing are subject to lender approval, including but not limited to possible increases in capital reserve requirements for funds to be held in a lender-controlled capital reserve account.
A substantial portion of the total acquisition for the Property will be paid with borrowed funds. The use of borrowed money to acquire real estate is referred to as leveraging. Leveraging increases the risk of loss. If the Sponsor were unable to pay the payments on the borrowed funds (called a "default"), the lender might foreclose, and the Sponsor could lose its investment in its property.
ParaWest Group intends to make distributions from Idlewood Investors LLC as follows:
- To the Investors, pari passu, all operating cash flows to a 10.0% IRR;
- 65% / 35% (65% to Investors / 35% to Promoted/Carried Interest) to a 14.0% IRR;
- 50% / 50% (50% to Investors / 50% to Promoted/Carried Interest)of excess cash flow thereafter.
ParaWest Group intends to make distributions to investors after the payment of both company's liabilities (loan payments, operating expenses, and other fees as more specifically set forth in the LLC agreements, in addition to any member loans or returns due on member loan).
Distributions are expected to start in May 2022 and are projected to continue on a quarterly basis thereafter. Distributions are at the discretion of ParaWest Group, who may decide to delay distributions for any reason, including maintenance or capital reserves. ParaWest Group will receive a promoted/carried interest as indicated above, and a portion of this promoted/carried interest may be received by RM Admin, LLC for administrative services.
| Cash Flow Summary | |||||||
| Year 1 | Year 2 | Year 3 | Year 4 | ||||
| Effective Gross Revenue | $2,923,470 | $3,233,231 | $3,412,536 | $3,535,031 | |||
| Total Operating Expenses | $1,525,619 | $1,564,554 | $1,649,057 | $1,693,160 | |||
| Net Operating Income | $1,397,851 | $1,668,677 | $1,763,479 | $1,841,871 | |||
| Project-Level Cash Flows | |||||||
| Year 0 | Year 1 | Year 2 | Year 3 | Year 4 | |||
| Net Cash Flow | ($9,573,130) | $390,836 | $658,565 | $751,574 | $18,743,718 | ||
| Investor-Level Cash Flows* | |||||||
| Year 0 | Year 1 | Year 2 | Year 3 | Year 4 | |||
| Net Cash Flow | ($7,000,000) | $215,785 | $411,551 | $479,561 | $12,385,152 | ||
| Investor-Level Cash Flows - Hypothetical $50,000 Investment* | |||||||
| Year 0 | Year 1 | Year 2 | Year 3 | Year 4 | |||
| Net Cash Flow | ($50,000) | $1,541 | $2,940 | $3,425 | $88,465 | ||
*Returns are net of all fees. Such Fees include fees paid to RM Admin, an affiliate of RealtyMogul, who charges an annual fixed administrative fee for providing certain ongoing administrative services to the Sponsor. Please see the Fees and Disclaimers sections and Disclaimers sections below for additional information concerning fees paid to RM Admin.
RM Technologies, LLC and its affiliates does not provide any assurance of returns. The content on this Page, including Sponsor’s pro forma projections, was provided by the Sponsor or an affiliate thereof. Although RM Technologies, LLC believes the Sponsor reliably produced this content, RM Technologies, LLC makes no representations or warranties as to the accuracy of such information and accepts no liability therefor. The assumptions and projections included in the content on this Page, including the Sponsor’s pro forma projections, are not reflective of the position of RM Technologies, LLC or any other person or entity other than the Sponsor or its affiliates. There can be no assurances that all or any of the Sponsor’s assumptions will be true, that actual performance will bear any relation to these hypothetical illustrations, or that the Sponsor’s investment objectives will be achieved. For additional information concerning the Sponsor’s assumptions and projections, and the significant risks involved in investing in real estate, please see the Disclaimers section below.
Certain fees and compensation will be paid over the life of the transaction; please refer to ParaWest Group's materials for details. The following fees and compensation will be paid(1)(2)(3):
| One-Time Fees: | |||||
| Type of Fee | Amount of Fee | Received By | Paid From | ||
| Transaction Fee | 1.5% of Recap Value | ParaWest | Capitalized Equity Contribution | ||
| Construction Management Fee | 5.0% of CapEx Budget | ParaWest | Capitalized Equity Contribution | ||
| Recurring Fees: | |||||
| Type of Fee | Amount of Fee | Received By | Paid From | ||
| Asset Management Fee | 1.0% of EGI | ParaWest | Distributable Cash | ||
| Property Management Fee | 3.5% of EGI | ParaWest | Distributable Cash | ||
| Administrative Services Fee | 1.0% of Equity* | RM Admin(3) | Distributable Cash | ||
*Only applies to equity raised through the RealtyMogul Platform
(1) Fees may be deferred to reduce impact to investor distributions.
(2) RM Technologies, LLC, an affiliate of RealtyMogul, operates the RealtyMogul Platform. RM Technologies, LLC charges a fixed, non-percentage-based fee for real estate companies and their sponsors to use the RM Technologies, LLC’s proprietary Platform and receive Platform-related services. An estimate of this fee is included in the Closing Costs above and is intended to be capitalized into the transaction at the discretion of the Sponsor. The Platform fees received by RM Technologies, LLC are disclosed in the relevant operating agreement(s). RM Technologies LLC’s receipt of Platform fees creates a conflict of interest between RealtyMogul and its affiliates, and investors or prospective investors.
(3) RM Admin, an affiliate of RealtyMogul, charges an annual fixed administrative fee for providing certain ongoing administrative services to the Sponsor. RM Admin’s administrative services and fees are disclosed in the relevant operating agreement(s). RM Admin’s receipt of administrative fees creates a conflict of interest between RealtyMogul and its affiliates, and investors or prospective investors.
The information on this Page is qualified in its entirety by reference to the more complete information about the offering contained in the Sponsor’s Investment Documents. The information on this Page is not complete and subject to change at the Sponsor’s discretion at any time up to the closing date. The Sponsor’s Investment Documents and supplements thereto contain important information about the Sponsor’s offering including relevant investment objectives, the business plan, risks, charges, expenses, and other information, which you should consider carefully before investing. The information on this Page should not be used as a basis for an investor’s decision to invest.
Risk of InvestmentThis investment is speculative, highly illiquid, and involves substantial risk. There can be no assurances that all or any of Sponsor’s assumptions, expectations, estimates, goals, hypothetical illustrations, or other aspects of Sponsor’s business plans (“Assumptions”) will be true or that actual performance will bear any relation to Sponsor’s Assumptions, and no guarantee or representation is made that Sponsor’s Assumptions will be achieved. If Sponsor does not achieve its Assumptions, your investment could be materially and adversely affected. A loss of part or all of the principal value of your investment may occur. You should not invest unless you can readily bear the consequences of such loss. Sponsor’s Assumptions should not be relied upon as the primary basis for your decision to invest.
No Reliance on Forward-Looking Statements; Sponsor AssumptionsSponsor is solely responsible for statements made concerning forward-looking statements and Assumptions, which apply only as of the date made, are preliminary and subject to change, and are expressly qualified in their entirety by the disclosures and cautionary statements included in Sponsor’s Investment Documents, which you should carefully review. Sponsor is obligated to update or revise such forward-looking statements or Assumptions to reflect events or circumstances that arise after the date made or to reflect the occurrence of unanticipated events. Sponsor’s forward-looking statements and Assumptions are hypothetical, not based on actual investment achievements or events, and are presented solely for purposes of providing insight into the Sponsor’s investment objectives, detailing Sponsor’s anticipated risk and reward characteristics, and establishing a benchmark for future evaluation of actual results; therefore, they are not a predictor, projection, or guarantee of future results. You should not rely on Sponsor’s forward-looking statements as a basis to invest.
Importantly, we do not adopt, endorse, or provide any assurance of returns or as to the accuracy or reasonableness of Sponsor’s Assumptions or forward-looking statements.
No Reliance on Past PerformanceAny description of past performance is not a reliable indicator of future performance and should not be relied upon as the primary basis to invest.
Sponsor’s Use of DebtA substantial portion of the total cost of the real estate asset acquired by the Sponsor with investor funds (“Property”) will be paid with borrowed funds, i.e., debt. Sponsor’s estimated rates and terms of the debt financing are subject to lender approval, and there is no assurance that the Sponsor will secure debt at the rates and terms presented on this Page or in the Sponsor’s Investment Documents, or at all. The use of borrowed money to acquire real estate is referred to as leveraging, which can amplify losses and could result in lender foreclosure. In addition, if the debt includes a variable (or “floating”) interest rate, the total amount of interest paid over the term of the debt will fluctuate and can increase. As a result, Sponsor’s use of debt can result in a loss of some or all of your investment.
Sponsor’s Offering is Not RegisteredSponsor’s securities offering will not be registered under the Securities Act of 1933, as amended (the “Securities Act”), in reliance upon the exemptions from registration pursuant to Rule 506(c) of Regulation D as promulgated under the Securities Act (“Private Placement”). In addition, the offering will not be registered under any state securities laws in reliance on exemptions from state registration. Such securities (your ownership interests) are subject to restrictions on transferability and resale and may not be transferred or resold except as permitted under applicable state and federal securities laws pursuant to registration or an available exemption. All Private Placements on the Platform are intended solely for “Accredited Investors,” as that term is defined in Rule 501(a) under the Securities Act.
No Investment AdviceNothing on this Page should be regarded as investment advice (either with respect to a particular security or regarding an overall investment strategy), a recommendation, an offer to sell, or a solicitation of or an offer to buy any security. Advice from a securities professional is strongly advised to understand and assess the risks associated with real estate or private placement investments.
1031 Exchange RiskInternal Revenue Code Section 1031 (“Section 1031”) contains complex tax concepts and certain tax consequences may vary depending on the individual circumstances of each investor. You should consult with and rely on your own tax advisor about the tax aspects with respect to your particular circumstances.