


Cooper Street Capital (the "Real Estate Company" or "CSC") is a private equity real estate company that applies targeted acquisition strategies and active asset management to provide consistent risk-adjusted returns for investors. By structuring each investment as an individual partnership, Cooper Street Capital allows partners to invest directly. The company is headquartered in Aspen, Colorado and also has an office in San Francisco, California.
CSC’s team is committed to sourcing commercial real estate investment opportunities from across the western United States that have demonstrated strong financial performance in the past or that exhibit the potential for gains in the future. In either case, potential acquisitions must be supported by strong market fundamentals. CSC currently oversees $665 million in assets under management throughout Texas, New Mexico, Colorado, and Oregon.
Cooper Street Capital is pleased to present a value-add investment opportunity for the Amber Hill Apartments in one of the fastest-growing US markets, San Antonio, TX. CSC has owned and operated the asset since March 2020 and is recapitalizing the project alongside a refinance of the in-place loan. Since the takeover, CSC has made fast work of its initial investment strategy to push up the asset's income through interior renovations and the implementation of a utility bill back program. By continuing the strategy going forward, CSC believes over a three-year investment horizon that it can capture an additional 7% rental upside and drive up the NOI by nearly $400,000.
In-Place/Stabilized Unit Mix:
| Unit Type | # of Units | Average SF/Unit | Avg Rent (In-Place) | Avg Rent (Post-Reno) | Post-Reno Rent per SF |
| 1x1 Small | 55 | 560 | $681 | $700 | $1.25 |
| 1x1 Large | 66 | 672 | $696 | $800 | $1.19 |
| 2x1 | 57 | 864 | $869 | $920 | $1.06 |
| 2x2 | 40 | 952 | $976 | $960 | $1.01 |
| 2x1.5 | 10 | 1,088 | $1,104 | $1,120 | $1.03 |
| 3x2 | 16 | 1,180 | $1,249 | $1,420 | $1.20 |
| Total/Averages | 244 | 788 | $832 | $885 | $1.14 |
Lease Comparables:
| The Connally | Diamond Ridge | Pearl Park | Latitude | Barcelo Apartments | Averages | Subject (Pro Forma) | |
| Year Built | 1973 | 1978 | 1974 | 1978 | 1972 | 1969 | |
| # of Units | 152 | 304 | 188 | 268 | 288 | 244 | |
| Levels | 2 | 3 | 2 | 2 | 2 | 2 | |
| Distance from subject | 0.3 mi | 0.5 mi | 0.6 mi | 0.7 mi | 3.2 mi | ||
| $/Unit (1x1) | $940 | $764 | $972 | $725 | $745 | $829 | $755 |
| SF (1x1) | 737 | 616 | 737 | 647 | 663 | 680 | 621 |
| $/SF (1x1) | $1.28 | $1.24 | $1.32 | $1.12 | $1.12 | $1.22 | $1.21 |
| $/Unit (2x1) | $950 | $984 | $924 | $909 | $915 | $936 | $920 |
| SF (2x1) | 949 | 864 | 949 | 838 | 866 | 893 | 864 |
| $/SF (2x1) | $1.00 | $1.14 | $0.97 | $1.08 | $1.06 | $1.05 | $1.06 |
| $/Unit (2x2) | $975 | $1,108 | $1,028 | $999 | $965 | $1,015 | $960 |
| SF (2x2) | 1,036 | 945 | 1,076 | 1,016 | 1,009 | 1,016 | 952 |
| $/SF (2x2) | $0.94 | $1.17 | $0.96 | $0.98 | $0.96 | $1.00 | $1.01 |
| $/Unit (3x2) | $1,240 | $1,144 | $1,401 | $1,359 | $1,155 | $1,260 | $1,420 |
| SF (3x2) | 1,267 | 1,180 | 1,267 | 1,418 | 1,202 | 1,267 | 1,180 |
| $/SF (3x2) | $0.98 | $0.97 | $1.11 | $0.96 | $0.96 | $0.99 | $1.20 |
Sales Comparables:
| The Connally | Vista del Rey | Diamond Ridge | Valencia on Four10 | Latitude | Averages | Subject (Going-in) | |||
| Date Sold | Oct-20 | Oct-19 | Dec-20 | Nov-19 | May-20 | ||||
| Year Built | 1973 | 1978 | 1978 | 1982 | 1978 | 1969 | |||
| # of Units | 152 | 453 | 304 | 346 | 268 | 244 | |||
| Average Unit Size | 1,098 SF | 835 SF | 825 SF | 908 SF | 1,010 SF | 935 SF | 788 SF | ||
| Sale Price | $15,000,000 | $38,333,333 | $27,000,000 | $31,000,000 | $23,659,362 | $26,998,539 | $20,700,000 | ||
| $/Unit | $98,684 | $84,621 | $88,816 | $89,595 | $88,281 | $90,000 | $84,836 | ||
| $/SF | $87 | $113 | $191 | $102 | $103 | $119 | $86 | ||
| Building Size | 173,035 SF | 340,651 SF | 141,451 SF | 302,825 SF | 229,904 SF | 237,573 SF | 240,926 SF | ||
| Distance from subject | 0.3 mi | 0.4 mi | 0.5 mi | 0.6 mi | 0.7 mi | ||||
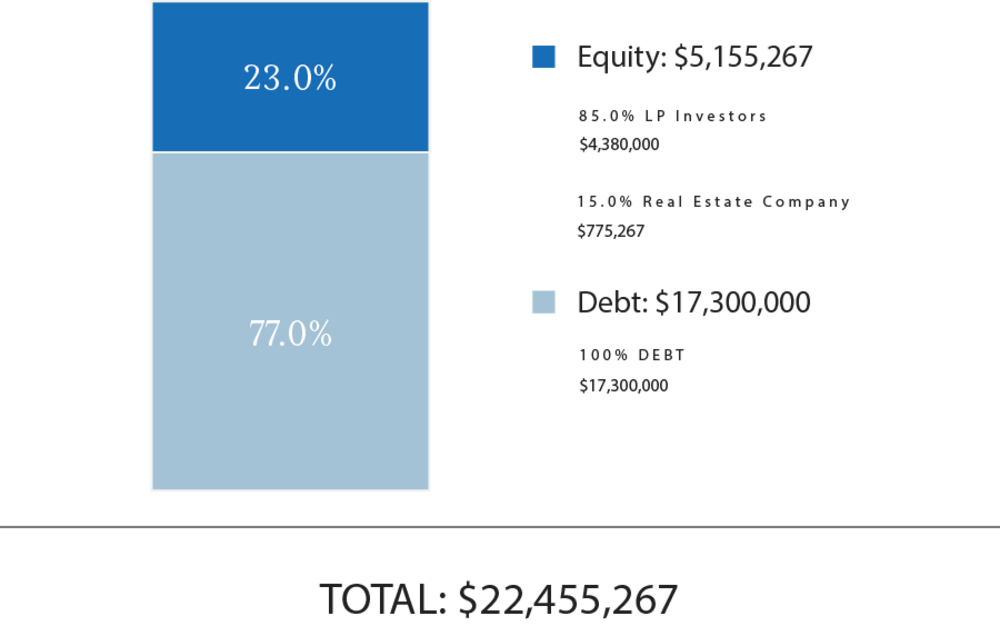
| Sources of Funds | Amount |
|---|---|
| Debt | $17,300,000 |
| Equity | $5,155,267 |
| Total Sources of Funds | $22,455,267 |
| Uses of Funds | Amount |
| Purchase Price | $20,700,000 |
| Acquisition Fee | $207,000 |
| Loan Fee | $173,000 |
| CapEx | $760,000 |
| Tax Escrow | $74,885 |
| Insurance Premium | $45,000 |
| Other Closing Costs(1) | $495,382 |
| Total Uses of Funds | $22,455,267 |
Please note that Cooper Street Capital's equity contribution may consist of friends and family equity and equity from funds controlled by Cooper Street Capital. Additionally, the numbers represented above can change prior to closing depending on final loan proceeds, property condition assessments, appraisals, final closing costs, and other lender-mandated expenses.
(1) RM Technologies operates the RealtyMogul platform. RM Technologies charges a fixed, non-percentage-based fee for real estate companies to use the marketplace. An estimate of this fee is included in the Closing Costs and is intended to be capitalized into the transaction at the discretion of the Manager.
The expected terms of the debt financing are as follows:
- Lender: Greystone Servicing Company LLC
- Base Term: 2 Years
- Extension: Two six-month extensions available in each instance with payment of a 0.25% fee
- Loan-to-Value: 83.6%
- Estimated Proceeds: $17,300,000
- Interest Type: Floating
- Spread: LIBOR + 350 bps with LIBOR floor of 0.25%
- Interest-Only Period: Full-term
- Prepayment Terms: Loan is open to prepayment, subject to any applicable exit fee, after the sixth month of the loan term
- Exit Fee: 1.0% exit fee, waived upon Greystone permanent loan refinance
There can be no assurance that a lender will provide debt on the rates and terms noted above, or at all. All rates and terms of the debt financing are subject to lender approval, including but not limited to possible increases in capital reserve requirements for funds to be held in a lender-controlled capital reserve account.
Cooper Street Capital intends to make distributions from CSC-RM Amber Hill Realty Capital, LLC as follows:
- To the Investors, pari passu, all operating cash flows to a 10.0% preferred return;
- 70% / 30% (70% to Investors / 30% to Promote) following return of capital.
Cooper Street Capital intends to make distributions to investors after the payment of both company's liabilities (loan payments, operating expenses, and other fees as more specifically set forth in the LLC agreements, in addition to any member loans or returns due on member loan).
Distributions are expected to start in November 2021 and are projected to continue on a quarterly basis thereafter. Distributions are at the discretion of Cooper Street Capital, who may decide to delay distributions for any reason, including maintenance or capital reserves.
| Year 1 | Year 2 | Year 3 | |
|---|---|---|---|
| Effective Gross Revenue | $2,688,683 | $2,911,839 | $2,980,924 |
| Total Operating Expenses | $1,579,220 | $1,619,386 | $1,655,705 |
| Net Operating Income | $1,109,462 | $1,292,453 | $1,325,220 |
| Year 0 | Year 1 | Year 2 | Year 3 | |
|---|---|---|---|---|
| Investor-Level Cash Flows | ($4,380,000) | $362,175 | $507,714 | $5,781,804 |
| Net Earnings to Investor - Hypothetical $50,000 Investment | ($50,000) | $4,134 | $5,796 | $66,002 |
Certain fees and compensation will be paid over the life of the transaction; please refer to Cooper Street Capital's materials for details. The following fees and compensation will be paid(1)(2)(3):
| One-Time Fees: | |||||
| Type of Fee | Amount of Fee | Received By | Paid From | ||
| Acquisition Fee | 1.0% of Purchase Price | Cooper Street Capital | Capitalized Equity Contribution | ||
| Construction Management Fee | 5.0% of Construction Costs | Cooper Street Capital | Capitalized Equity Contribution | ||
| Recurring Fees: | |||||
| Type of Fee | Amount of Fee | Received By | Paid From | ||
| Administrative Services Fee | 1.0% of Equity Invested* | RM Admin(3) | Distributable Cash | ||
| Property Management Fee | 3.0% of EGI | CSC Management | Distributable Cash | ||
*Only applies to equity raised through the RealtyMogul Platform
(1) Fees may be deferred to reduce impact to investor distributions
(2) RM Technologies operates the RealtyMogul platform. RM Technologies charges a fixed, non-percentage-based fee for real estate companies to use the marketplace. An estimate of this fee is included in the Closing Costs and is intended to be capitalized into the transaction at the discretion of the Manager.
(3) RM Admin will be providing the following services:(a) responding to inbound investor inquiries regarding how to subscribe to the Project, (b) distribution of all annual tax forms (after receipt of same from Project Sponsor), (c) processing distributions that are payable from CSC-RM Amber Hill Realty Capital, LLC to Investors, however, RM Admin will not be deemed to have custody of client funds, (d) distribution of all quarterly reports (after receipt of same from Project Sponsor) and (e) summarizing sponsor information on property performance, responding to investor inquiries regarding sponsor performance information as well as the real estate market generally.
The information on this Page is qualified in its entirety by reference to the more complete information about the offering contained in the Sponsor’s Investment Documents. The information on this Page is not complete and subject to change at the Sponsor’s discretion at any time up to the closing date. The Sponsor’s Investment Documents and supplements thereto contain important information about the Sponsor’s offering including relevant investment objectives, the business plan, risks, charges, expenses, and other information, which you should consider carefully before investing. The information on this Page should not be used as a basis for an investor’s decision to invest.
Risk of InvestmentThis investment is speculative, highly illiquid, and involves substantial risk. There can be no assurances that all or any of Sponsor’s assumptions, expectations, estimates, goals, hypothetical illustrations, or other aspects of Sponsor’s business plans (“Assumptions”) will be true or that actual performance will bear any relation to Sponsor’s Assumptions, and no guarantee or representation is made that Sponsor’s Assumptions will be achieved. If Sponsor does not achieve its Assumptions, your investment could be materially and adversely affected. A loss of part or all of the principal value of your investment may occur. You should not invest unless you can readily bear the consequences of such loss. Sponsor’s Assumptions should not be relied upon as the primary basis for your decision to invest.
No Reliance on Forward-Looking Statements; Sponsor AssumptionsSponsor is solely responsible for statements made concerning forward-looking statements and Assumptions, which apply only as of the date made, are preliminary and subject to change, and are expressly qualified in their entirety by the disclosures and cautionary statements included in Sponsor’s Investment Documents, which you should carefully review. Sponsor is obligated to update or revise such forward-looking statements or Assumptions to reflect events or circumstances that arise after the date made or to reflect the occurrence of unanticipated events. Sponsor’s forward-looking statements and Assumptions are hypothetical, not based on actual investment achievements or events, and are presented solely for purposes of providing insight into the Sponsor’s investment objectives, detailing Sponsor’s anticipated risk and reward characteristics, and establishing a benchmark for future evaluation of actual results; therefore, they are not a predictor, projection, or guarantee of future results. You should not rely on Sponsor’s forward-looking statements as a basis to invest.
Importantly, we do not adopt, endorse, or provide any assurance of returns or as to the accuracy or reasonableness of Sponsor’s Assumptions or forward-looking statements.
No Reliance on Past PerformanceAny description of past performance is not a reliable indicator of future performance and should not be relied upon as the primary basis to invest.
Sponsor’s Use of DebtA substantial portion of the total cost of the real estate asset acquired by the Sponsor with investor funds (“Property”) will be paid with borrowed funds, i.e., debt. Sponsor’s estimated rates and terms of the debt financing are subject to lender approval, and there is no assurance that the Sponsor will secure debt at the rates and terms presented on this Page or in the Sponsor’s Investment Documents, or at all. The use of borrowed money to acquire real estate is referred to as leveraging, which can amplify losses and could result in lender foreclosure. In addition, if the debt includes a variable (or “floating”) interest rate, the total amount of interest paid over the term of the debt will fluctuate and can increase. As a result, Sponsor’s use of debt can result in a loss of some or all of your investment.
Sponsor’s Offering is Not RegisteredSponsor’s securities offering will not be registered under the Securities Act of 1933, as amended (the “Securities Act”), in reliance upon the exemptions from registration pursuant to Rule 506(c) of Regulation D as promulgated under the Securities Act (“Private Placement”). In addition, the offering will not be registered under any state securities laws in reliance on exemptions from state registration. Such securities (your ownership interests) are subject to restrictions on transferability and resale and may not be transferred or resold except as permitted under applicable state and federal securities laws pursuant to registration or an available exemption. All Private Placements on the Platform are intended solely for “Accredited Investors,” as that term is defined in Rule 501(a) under the Securities Act.
No Investment AdviceNothing on this Page should be regarded as investment advice (either with respect to a particular security or regarding an overall investment strategy), a recommendation, an offer to sell, or a solicitation of or an offer to buy any security. Advice from a securities professional is strongly advised to understand and assess the risks associated with real estate or private placement investments.
1031 Exchange RiskInternal Revenue Code Section 1031 (“Section 1031”) contains complex tax concepts and certain tax consequences may vary depending on the individual circumstances of each investor. You should consult with and rely on your own tax advisor about the tax aspects with respect to your particular circumstances.