FORMALIZED DUE DILIGENCE PROCESS 
Sponsors

The team at our affiliated broker-dealer, RM Securities, conducts diligence on of the issuer, including detailed background checks, criminal checks, bad actor checks, and reference checks on sponsors. In addition to screening for any criminal background, we may also turn down sponsors due to poor reference checks, even if the background and criminal checks are satisfactory.

Escrow accounts

We require unaffiliated sponsors to use an unaffiliated third-party escrow agent.* When an investor makes an investment with such sponsors using the RealtyMogul platform, the investor’s money is transferred directly into a third-party escrow account. All closing conditions in connection with a sponsor’s contingency offering need to be met before the third-party escrow agent will approve releasing investor funds to the issuer or general partner. For example, if an issuer or general partner plans to use funds for a real estate acquisition that does not ultimately transact, the third-party escrow agent will not transfer investor funds to the issuer or general partner, and funds will be returned to investors.

Unless otherwise disclosed, escrow accounts are not required for some investments that accommodate 1031 investments where the property is already acquired.

Boots on the ground

Our processes typically includes visiting certain properties (or a subset of properties if it's a fund) to confirm the real estate is what and where the real estate is supposed to be. For certain properties that accommodate 1031 exchange investments, the team will review third-party prepared due diligence reports in lieu of a site visit.

Detailed Checklists

We have formalized processes and checklists for every private placement deal listed on the platform.

Confidentiality Agreement
To access the Sponsor’s private offering documents for this investment, you must first acknowledge and agree to the below.
By clicking the ‘I Agree’ button below:
Funded
Estimated Hold Period 5 Years
Estimated First Distribution 2/2022
FUNDED 100%
...
View Our Due Diligence Process
Investment Returns: Discerning investors don't rely on a single projected return metric as a basis to invest. Rather, when assessing a potential investment, we encourage you to evaluate all information provided by a sponsor including the business plan, assumptions, and risk factors which can be found in the relevant offering documents. This approach is consistent with our requirements as a broker-dealer, which prohibit us from communicating projected returns.
Offered By
Spartan Investment Group
Investment Strategy Value-Add
Investment Type Equity
Minimum Investment 35000
Overview
FreeUp Storage DFW Portfolio includes 18 locations of non-climate controlled (NCC) and climate-controlled (CC) storage spread over 5,046 units in Dallas-Fort Worth (DFW) and east Texas.
Cash Flow

The FreeUp Storage DFW Portfolio provides investors with projected day 1 cash flow and additional upside potential. Currently, the Portfolio is realizing an 87% physical occupancy, and 80% economic occupancy. Year to date performance has been strong but in-place rents are below market. Spartan Investment Group's current presence in various Dallas and East Texas markets offers the opportunity to achieve operational efficiencies and streamline the performance of the Portfolio while increasing occupancy through targeted marketing strategies.

Demographics

Over 1.3 million people have moved to DFW over the past 10 years fueling demand for storage. Texas, and specifically DFW, have seen extraordinarily high volumes of new population growth due in part to the suburbanization trends that have been playing out all across the country. The DFW area ranked 2nd in the country in 2020 for single-family construction permits and for the past twelve years, Texas has been the #1 destination for companies leaving California. 10 of the 14 properties are located in counties that are in the 90th percentile of highest net migration across the state of Texas.

Value-Add

While a total of 250,000+ square feet of expansion is possible, Spartan Investment Group conservatively underwrote a collective 160,000 square feet of expansion at five of the 18 sites based on feasibility analyses, projected new supply, and market fundamentals. 

Property at a glance
Current # of Storage Units 5,046
# of Units Post Expansion 6,120
Current Square Feet 742,285
Square Feet Post Expansion 902,285
Construction Completion Date August 2023
Acquisition Price $88,500,000
Current Physical Occupancy 87%
Investment Highlights
Spartan Investment Group or SIG (the "Real Estate Company") is under contract to purchase the Portfolio for $88,500,000, representing an acquisition cap rate of 5.00%.
Value-adding opportunities, not including the expansions, represent a 26.5% increase in NOI over the first 20 months of the hold period.
The 160,000 square feet of self-storage expansions will result in a 21.8% return-on-cost for the newly developed units, once stabilized.
The targeted annual cash flows are between 5.2% and 7.7%.
The Portfolio is located across eight counties, five of which are in the 90th percentile across the state of Texas for the highest net population migration.
Self-Storage has proved to be a recession-proof asset class needed during economic downturns as well as during an economic expansion. Its increased demand has resulted in continuous cap rate compression. Market guidance is that the Portfolio, when stabilized, would trade between 4.75%-5.25% and SIG has estimated a terminal valuation based on a 5.35% capitalization rate.
Management
Cumulative Distributions

Spartan Investment Group

Spartan Investment Group ("SIG") was founded in 2013 and is headquartered in Golden, CO. In 2021, SIG was named the 5th fastest-growing private real estate company by Inc. 500. SIG focuses on value-add and ground-up development primarily in the self-storage asset classes. The vertically integrated team of professionals handles all aspects of the business to include acquisition, construction, property management, and asset management. SIG's business plan typically includes rebranding the property, hiring and training staff, and building additional units to increase the facilities' value. SIG currently owns ~12,000 units across Texas, Georgia, Florida, Colorado, Tennessee, Arkansas, the pacific northwest, and the midwest.

https://spartan-investors.com/
  • Scott Lewis
    Chief Executive Officer
  • Ryan Gibson
    Chief Investment Officer
  • Ben Lapidus
    Chief Financial Officer
Scott Lewis
Chief Executive Officer

Scott Lewis is the co-founder and Chief Executive Officer of Spartan Investment Group, LLC (SIG). As the CEO, Scott is responsible for the strategic direction of the company and ensuring it aligns with SIG’s mission to Improve Lives Through Real Estate. Prior to Spartan, Scott held positions as a regional sales manager for a biotech firm, various positions in strategic and project management for the federal government culminating at the GS 15 level, and was on active duty in the US Army as an Infantry Officer. 
 
In addition to Spartan, Scott is active in the US Army Reserves and an Iraqi Freedom combat Vet. 
 
Scott graduated from Michigan State University with degrees in Chemistry and Marketing, from Catholic University with an MS in Management, and from Georgetown University with a Certificate in Project Management.

Ryan Gibson
Chief Investment Officer

Ryan Gibson is the Chief Investment Officer of Spartan Investment Group, LLC. As the Chief Investment Officer for Spartan Investment Group, Ryan is responsible for investor relations and capital raises for projects. Ryan has coordinated over $70M in private capital for SIG’s projects to date and oversees all of our marketing efforts, including our communication and outreach strategies. Ryan has previous experience in airline management overseeing the operation of 500 flights per day for the nation’s largest independently held airline. In this role, Ryan provided direct leadership to 200 pilots. In addition to holding the positions as Regional Chief Pilot, certified flight instructor, and Senior Aviation Analyst, Ryan was also directly involved with the FAA’s implementation of Public Law 111-216, which provided sweeping regulatory changes in the commercial aviation industry. Ryan graduated from Mercyhurst University with a bachelor’s degree in Business, with concentrations in Marketing, Management, and Advertising. In addition, Ryan attended Cornell’s Labor Relations certificate program.

Ben Lapidus
Chief Financial Officer

Ben Lapidus is the Chief Financial Officer for Spartan Investment Group LLC, where he has applied his finance and business development skills to construct from scratch a portfolio of over $100M assets under management, build the corporate finance backbone for the organization, and organize over $20M of debt capital. In addition to completing over 60 real estate transactions at and prior to Spartan, Ben is also the founder and host of the national Best Ever Real Estate Investing Conference and managing partner of Indigo Ownerships LLC. Before Spartan, Ben founded and sold a multi-million dollar study abroad company and worked with several start-ups through IPO or acquisition. He graduated from Rutgers University with dual degrees in Finance and Economics where he founded the Rutgers Entrepreneurial Society.

Track Record

Spartan Investment Group Track Record

Property City, State Asset Type Acq Date  Units or SF  Purchase Price Current Market Value Sale Price
Ridgmar Mall Storage Fort Worth, Texas Self-Storage Feb 2020 1,106 $10,000,000 $18,200,000 N/A
FreeUp Storage Madison Madison, WI Self-Storage July 2021 708 $12,200,000 $12,200,000 N/A
Mini-West Storage  Corsicana, Texas Self-Storage April 2019 979 $6,000,000 $14,500,000 N/A
FreeUp Storage Pea Ridge Pea Ridge, AR Self-Storage Dec 2020 531 $5,500,000 $8,800,000 N/A
FreeUp Storage Fort Oglethorpe  Fort Oglethorpe, GA Self-Storage July 2021 441 $4,625,000 $4,625,000 N/A
FreeUp Storage Tyler Shiloh Road  Tyler, Texas Self-Storage Sept 2020 571 $2,500,000 $2,500,000 N/A
FreeUp Storage Boat Club Road Fort Worth, Texas Self-Storage Sept 2019 219 $1,400,000 $3,850,000 N/A
FreeUp Storage Tyler SH-155 Tyler, Texas Self-Storage Sept 2020 395 $1,900,000 $1,900,000 N/A
FreeUp Storage Longview Gilmer Road  Longview, Texas Self-Storage Sept 2020 481 $1,800,000 $3,200,000 N/A
FreeUp Storage Longview Tyler Street Longview, Texas Self-Storage Sept 2020 390 $1,800,000 $3,200,000 N/A
FreeUp Storage Huntsville  Huntsville, Texas Self-Storage Mar 2021 321 $4,200,000 $5,600,000 N/A
FreeUp Storage Ocala  Ocala, FL Self-Storage July 2021 387 $4,375,000 $4,375,000 N/A
FreeUp Storage Hudson Hudson, FL Self-Storage July 2021 38 $3,940,000 $3,940,000 N/A
FreeUp Storage Palatka Palatka, FL Self-Storage July 2021 249 $4,540,000 $4,540,000 N/A
FreeUp Storage Columbus Columbus, GA Self-Storage July 2021 335 $3,095,000 $3,095,000 N/A
FreeUp Storage Lake Park  Lake Park, GA Self-Storage July 2021 432 $3,875,000 $3,875,000 N/A
FreeUp Storage Warner Robins Warner Robins, GA Self-Storage July 2021 443 $1,575,000 $1,575,000 N/A
FreeUp Storage Warner Robins Storaway Warner Robins, GA Self-Storage July 2021 239 $800,000 $800,000 N/A
FreeUp Storage Sharpsburg Sharpsburg, GA Self-Storage Dec 2020 252 $2,990,000 $5,450,000 N/A
FreeUp Storage Fortson Forston, GA Self-Storage July 2021 303 $2,250,000 $2,250,000 N/A
FreeUp Storage Centerville Centerville, TN Self-Storage July 2021 503 $1,725,000 $1,725,000 N/A
Free Up Storage Aspen Park Aspen Park, CO Self-Storage April 2020 190 $2,100,000 $2,100,000 N/A
FreeUp Storage Devonshire Denver, CO Self-Storage April 2020 280 $1,450,000 $1,765,000 N/A
FreeUp Storage Sandy Sandy, OR Self-Storage July 2021 351 $1,500,000 $1,500,000 N/A
FreeUp Storage Black Diamond Pea Ridge, AR Self-Storage Feb 2017 755 $550,000 $33,300,000 N/A
HWY 285 RV Park Pecos, TX RV Park Dec 2019 103 $2,300,000 $4,000,000 N/A
Goldenrod RV Park Gardendale, TX RV Park Feb 2018 116 $1,750,000 $2,900,000 N/A
Lavender Meadows Park Sequim, WA MHC Feb 2020 217 $3,540,000 $26,000,000 N/A
Aspen Park Self-Storage Aspen Park, CO Self-Storage Aug 2018 129 $1,516,500 $2,100,000 $2,100,000
Chateau@1308  Washington, DC Residential Dec 2015 4 $455,000 $2,541,800 $2,541,800
SI Investors Six Washington, DC Residential Aug 2017 2 $695,972 $1,292,500 $1,292,500
Elvans Road Lots Washington, DC Residential Dec 2016 11 $450,000 $850,000 $850,000
Levis Street  Washington, DC Residential July 2016 1 $425,000 $785,000 $785,000
Evarts Street Washington, DC Residential Mar 2015 1 $131,250 $750,000 $750,000
W Street Washington, DC Residential Aug 2015 1 $100,000 $477,000 $477,000
L Street - 1354 Washington, DC Residential Apr 2011 1 $315,000 $715,000 $715,000
L Street - 1352 Washington, DC Residential Feb 2014 1 $100,000 $549,500 $549,500
L Street - 1350 Washington, DC Residential Sept 2009 1 $340,000 $615,000 $615,000
Total       11,487 $98,808,722 $192,440,800 $10,675,800

The above bios and track record were provided by Spartan Investment Group and have not been independently verified by RealtyMogul.

The FreeUp Storage DFW Portfolio includes 14 properties with 4 satellite facilities representing 742,285 square feet of storage spread over 5,046 units. 

Capital Improvement Plan includes:
- Repair drive aisles and recoat for a refreshed look
- Repair all roofs to ensure units are leak-free
- Renovate offices to provide an enhanced experience and add storage retail goods
- Repaint/repair building damage
- Replace all security cameras with modern systems
- Enhance the signage at the facilities
- Develop an additional 160,000 sf of rentable space across five properties

The Operational Improvement Plan includes:
- Bring in-place rents to market as in-place leases are $0.13psf/month or $1.58psf/year below their competitive set
- Rebranding facilities to FreeUp Storage National Brand (affiliate Property Manager of SIG)
- Improve staff training to enhance the customer experience
- Develop community partnerships for cross-marketing purposes
- Target vendors to develop corporate business relationships
- Add ancillary revenue streams through tenant insurance and retail sales

Development Budget

Acquisition Cost $ Amount Per Unit Per SF
Purchase Price $88,500,000 $17,539 $119.23
Closing Costs $2,042,083 $405 $2.75
Mortgage Brokerage Fee $619,500 $123 $0.83
Acquisition Fee $1,770,225 $351 $2.38
Total Acquistion Costs $92,931,808 $18,417 $125.20
       
Renovation $ Amount Per Unit Per SF
Hard Costs (GC) $2,913,453 $577 $3.92
Soft Costs $291,345 $58 $0.39
Contingency $195,201 $39 $0.26
Total Hard Costs $3,400,000 $674 $4.58
       
Expansion $ Amount Per Unit Per SF
Hard Costs (GC) $8,738,502 $1,732 $11.77
Soft Costs $873,850 $173 $1.18
Contingency $147,648 $29 $0.20
Total Expansion Costs $9,760,000 $1,934 $13.15
       
Other $ Amount Per Unit Per SF
Developer Fee $789,600 $156 $1.06
Working Capital $1,905,400 $378 $2.57
Unallocated Expenses $25,192 $5 $0.03
Total Other $2,720,192 $59,135 $3.63
       
Grand Total $108,812,000 $80,160 $146.56


Summary

Property Information

The FreeUp Storage DFW Portfolio offering consists of a value-add portfolio with scale and significant upside through expanding sites, implementing revenue management, rate increases, and added management efficiencies. The Properties are strategically situated throughout Dallas-Fort Worth and East Texas where Spartan Investment Group/FreeUp Storage owns and operates numerous store locations.

Property City # of Units (1) Property SF (2) Avg Unit Rent PSF /month Occupancy Expansion SF Stabilized # Units
Post Expansion
Stabilized Avg  Rent PSF/month
Terrell Terrell 526 111,525  $0.84 93% 40,000 747  $0.98
Lockbox Terrell 380 62,905  $0.82 79% 0 380  $0.94
T80 Terrell 260 44,290  $0.75 77% 0 260  $0.88
Tyler Tyler 423 65,582  $0.66 90% 55,000 792  $0.89
Tyler (Indian Creek Satellite) Tyler 46 5,760  $0.66 90% 0 46  $0.89
Tyler (Smart Choice Satellite) Ben Wheeler 48 6,000  $0.66 90% 0 48  $0.89
Flint Flint 264 28,634  $0.74 92% 10,000 352  $1.17
Seagoville Seagoville 400 59,760  $0.86 79% 0 400  $0.94
Kimberly Drive Seagoville 173 21,361  $0.81 56% 0 173  $0.71
Ferris Rockwall 244 42,433  $0.81 84% 30,000 437  $0.98
Ferris (Satellite) Ferris 38 5,950  $0.81 84% 0 38  $0.98
Krugerville Aubrey 240 30,170  $0.99 95% 0 240  $1.22
North Richland Hills North Richland Hills 135 21,010  $0.89 83% 0 135  $0.99
Mabank Mabank 562 66,990  $0.68 87% 0 562  $0.69
Forest Hill Forest Hill 186 24,300  $0.97 89% 0 186  $1.02
Forest Hill (Satellite) Forest Hill 384 49,075  $0.97 89% 0 384  $1.02
Paris Paris 372 45,951  $1.00 98% 25,000 574  $1.20
Big Toy Waxahachie 365 50,589  $1.22 94% 0 365  $1.40
Total/Averages   5,046 742,285  $0.85 87% 160,000 6,120  $0.99

(1) Total units of traditional self-storage is 5,046. There are approximately 506 parking and warehouse/office units bringing the total to 5,552 rentable units.

(2)Total square footage of 742,285 includes 690,888 sf of traditional self-storage units and 51,397 sf of office and warehouse space. 

Comparables

Lease Comparables

  IN Self Storage Public Storage 10 Federal Advantage Self Storage BTA Self Storage Averages Subject Averages
Year Built 2006 1973 1986 1999 2003-2020 1998 1991
Net Rentable Square Feet 24,113 56,000 20,345 70,527 56,297 45,456 52,989
Occupancy 96.9% 98.6% 91.2% 99.3% 100.0% 97.20% 87.0%
Distance from subject 5.7 mi 1.4 mi 5.0 mi 3.9 mi 3.8 mi 4.0 mi  
                   
$/Unit (5x10) $74 $82 $69 $73 $81 $76 $65
SF (5x10) 50 50 50 50 50 50 50
$/SF (5x10) $1.48 $1.64 $1.38 $1.46 $1.62 $1.52 $1.29
                   
$/Unit (10x10) $110 $94 $119 $110 $109 $108 $91
SF (10x10) 100 100 100 100 100 100 100
$/SF (10x10) $1.10 $0.94 $1.19 $1.10 $1.09 $1.08 $0.91
                   
$/Unit (10x15) $145 $176 $149 $160 $129 $152 $129
SF (10x15) 150 150 150 150 150 150 150
$/SF (10x15) $0.97 $1.17 $0.99 $1.07 $0.86 $1.01 $0.86
                   
$/Unit (10x20) $179 $205 $213 $180 $169 $189 $151
SF (10x20) 200 200 200 200 200 200 200
$/SF (10x20) $0.90 $1.03 $1.07 $0.90 $0.85 $0.95 $0.76

*Please refer to the supplemental "Competitive Set Analysis" in the Documents section for more details.

Portfolio Sales Comparables

  Comp 1 Comp 2 Comp 3 Comp 4 Comp 5 Averages Subject
Date Jul-21 Aug-20 Jan-20 May-19 Jul-21    
Submarket Various Texas Texas California GA/FL/TN   Texas
SF 607,117 SF 597,609 SF 1,487,884 SF 335,616 SF 436,184 SF 595,497 SF 690,888 SF
Units 5,607 4,233 10,835 2,253 2,835 4,412 5,046(1)
Cap Rate 4.75% 4.66% 4.95% 4.74% 4.80% 4.89% 5.00%(2)

(1) Subject Property total square feet and unit count account for storage units only.

(2) The going-in cap rate is calculated using the annualized first month of proforma net operating income.

Location Information

Market Overview

The DFW area (Dallas, Fort Worth, and Arlington Metropolitan Statistical Area or MSA) covers 9,286 square miles as the 4th largest MSA in the United States with a population of 7.4 million, and the 12th largest MSA in the world. From 2010 to 2019 the Dallas Metro gained 1.3 million residents, ranking 1st among all U.S. MSA’s. 

From 2020 to 2029, the Dallas Metro is projected to add 1.4 million residents, and once again rank among the fastest-growing metro areas. The DFW MSA is the headquarters for 21 Fortune 1000 companies including AT&T, Dr Pepper Snapple Group, Exxon Mobil, Neiman Marcus Group LTD, Inc., and Texas Instruments, Inc. A 2019 report by the nonprofit Walton Family Foundation (of Walmart family fame) ranks Dallas-Fort Worth as the 27th most dynamic MSA and 6th among all major metro areas. There are more than 3 million jobs within Dallas-Fort Worth. In 2019, Inc. Magazine ranked Dallas in the top 10 hottest startup cities in America. The Dallas-Fort Worth area ranked 2nd in the country in 2020 for single-family construction permits. 

For the past twelve years, Texas has been the #1 destination for companies leaving California. Nearly 100 businesses have recently relocated their headquarters to the Dallas-Fort Worth Metro or are planning to relocate their headquarters to the Dallas Metro. These include Caterpillar, Wayfair, Google, Samsung, and Charles Schwab. Google’s massive $600 million data center, spread across 375-acres, is currently under construction. Samsung recently consolidated operations within the Dallas Metro, bringing 1,000 jobs to the area. Additionally, Charles Schwab’s new campus in the Dallas-Fort Worth Metro will cost $100 million and will cover 70 acres. From a macro perspective, Dallas ranks #1 in the country for total job growth and for percent job growth. In 2019, Forbes ranked the Dallas-Fort Worth Metro area the #2 fastest growing economy. Dallas is home to three global 25 companies, with only Beijing hosting more. No other global metro hosts more than one. The Dallas-Fort Worth Metro also hosts 23 Fortune 500 companies, 3rd in the nation among all metros. There is a 4% lower cost of doing business than the national average. 

Submarket Overview

Encompassing three MSAs - Longview, Texarkana, and Tyler - and the 12-county Texas Forest Country region, east Texas offers strong advantages for healthcare, manufacturing, distribution, and food processing operations. 

Fueling the region’s growth is a highly skilled and educated workforce that continues to grow thanks to a wealth of educational opportunities and superb lifestyle assets. World-class real estate also abounds from massive industrial sites to cutting-edge biomedical research parks. The region’s robust interstate infrastructure provides easy links along the NAFTA corridor, linking Mexico and Canada to East and West Coast destinations. Union Pacific Railroad, one of the nation’s largest railroads, has major nodes in the region offering businesses efficient access to key ports and distribution centers. In 2019, Express Employment Professionals conducted an east Texas Employment Survey in partnership with the Tyler Area Chamber of Commerce and the Tyler Economic Development Council. While this survey was conducted prior to the economic disruption caused by COVID-19, the results represent a positive trending sentiment based on responses from 400 businesses on 12 straightforward questions, as seen on page 17 of the OM. 

Cap Stack
Sources & Uses

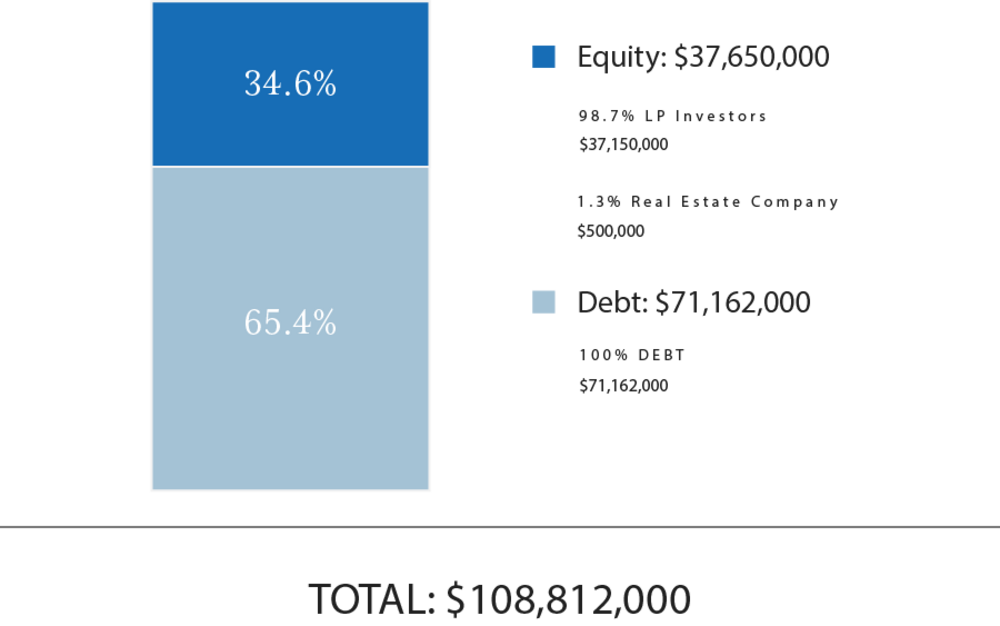
Total Capitalization

Sources of Funds $ Amount $/Unit
Debt $71,162,000 $14,103
GP Investor Equity $500,000 $99
LP Investor Equity(1) $37,150,000 $7,362
Total Sources of Funds $108,812,000 $21,564
     
Uses of Funds $ Amount $/Unit
Purchase Price $88,500,000 $17,539
Closing Costs(2) $2,661,583 $527
Construction $9,760,000 $1,934
Initial Improvements $3,400,000 $674
Working Capital $1,905,400 $378
Sponsorship Fee $1,770,225 $351
Developer Fee $789,600 $156
Other $25,192 $5
Total Uses of Funds $108,812,000 $21,564

The Sponsor’s equity contribution may consist of friends and family equity and equity from funds controlled by the Sponsor.

(1) Approximately $4M of LP Investor equity will be contributed by the GP's family members and close friends/relatives identified as like-kind family.

(2) RM Technologies, LLC, an affiliate of RealtyMogul, operates the RealtyMogul Platform.  RM Technologies, LLC charges a fixed, non-percentage-based fee for real estate companies and their sponsors to use the Platform and for Platform-related services.  Please see the Fees and Disclaimers sections below for additional information concerning fees paid to RM Technologies, LLC. 

Debt Assumptions

The expected terms of the debt financing are as follows:

  • Lender: TBD
  • Term: 60 Months
  • Loan to Value:  70.0%
  • Estimated Proceeds: $71,162,000
  • Interest Type: Fixed
  • Annual Interest Rate: 3.250%
  • Interest-Only Period: 36 Months
  • Amortization:  30 Years
  • Prepayment Terms: 24-month minimum interest and 1 point exit fee
  • Extension Requirements: 25 bps

There can be no assurance that the Sponsor will secure debt on the rates and terms noted above, or at all.  All of the Sponsor’s estimated rates and terms of the debt financing are subject to lender approval, including but not limited to possible increases in capital reserve requirements for funds to be held in a lender-controlled capital reserve account.

A substantial portion of the total acquisition for the Property will be paid with borrowed funds. The use of borrowed money to acquire real estate is referred to as leveraging.  Leveraging increases the risk of loss.  If the Sponsor were unable to pay the payments on the borrowed funds (called a "default"), the lender might foreclose, and the Sponsor could lose its investment in its property.

Distributions

Spartan Investment Group intends to make distributions from DFW Portfolio RM Offering, LLC as follows:

Operating Cash Flow

  1. 7.5% Preferred Return
  2. 65%/35% (65% to Members/35% to Promoted/Carried Interest) thereafter

Capital Event

  1. 7.5% Preferred Return
  2. Return of Capital
  3. 65%/35% (65% to Members/35% to Promoted/Carried Interest) thereafter

Spartan Investment Group intends to make distributions to investors after the payment of both company's liabilities (loan payments, operating expenses, and other fees as more specifically set forth in the LLC agreements, in addition to any member loans or returns due on member loan).

Distributions are expected to start in February 2022 and are projected to continue on a quarterly basis thereafter. Distributions are at the discretion of Spartan Investment Group, who may decide to delay distributions for any reason, including maintenance or capital reserves. Spartan Investment Group will receive a promoted/carried interest as indicated above, and a portion of this promoted/carried interest may be received by RM Admin, LLC for administrative services.

Cash Flow Summary
    Year 1 Year 2 Year 3 Year 4 Year 5
Effective Gross Revenue   $7,667,201 $8,832,061 $10,788,315 $11,290,521 $11,518,413
Total Operating Expenses   $2,600,106 $3,087,905 $3,506,627 $3,601,300 $3,673,990
Net Operating Income   $5,067,095 $5,744,157 $7,281,688 $7,689,221 $7,844,423
                 
Project-Level Cash Flows
  Year 0 Year 1 Year 2 Year 3 Year 4 Year 5
Net Cash Flow ($37,650,000) $1,949,574 $2,481,678 $3,600,553 $2,622,604 $60,592,021
                 
Investor-Level Cash Flows*
  Year 0 Year 1 Year 2 Year 3 Year 4 Year 5
Net Cash Flow ($5,000,000) $258,908 $329,572 $478,161 $348,287 $8,046,749
                 
Investor-Level Cash Flows - Hypothetical $50,000 Investment*
  Year 0 Year 1 Year 2 Year 3 Year 4 Year 5
Net Cash Flow ($50,000) $2,589 $3,296 $4,782 $3,483 $80,467

*Returns are net of all fees.  Such Fees include fees paid to RM Admin, an affiliate of RealtyMogul, who charges an annual fixed administrative fee for providing certain ongoing administrative services to the Sponsor.  Please see the Fees and Disclaimers sections and Disclaimers sections below for additional information concerning fees paid to RM Admin. 

RM Technologies, LLC and its affiliates does not provide any assurance of returns.  The content on this Page, including Sponsor’s pro forma projections, was provided by the Sponsor or an affiliate thereof.  Although RM Technologies, LLC believes the Sponsor reliably produced this content, RM Technologies, LLC makes no representations or warranties as to the accuracy of such information and accepts no liability therefor.  The assumptions and projections included in the content on this Page, including the Sponsor’s pro forma projections, are not reflective of the position of RM Technologies, LLC or any other person or entity other than the Sponsor or its affiliates.  There can be no assurances that all or any of the Sponsor’s assumptions will be true, that actual performance will bear any relation to these hypothetical illustrations, or that the Sponsor’s investment objectives will be achieved.  For additional information concerning the Sponsor’s assumptions and projections, and the significant risks involved in investing in real estate, please see the Disclaimers section below. 


Fees

Certain fees and compensation will be paid over the life of the transaction; please refer to Spartan Investment Group materials for details. The following fees and compensation will be paid(1)(2)(3)(4)(5)(6):

One-Time Fees:
Type of Fee Amount of Fee Received By Paid From
Acquisition Fee 2.0% of Acquisition Price Spartan Investment Group Project Capitalization
Construction Management Fee 10.0% of Hard and Soft Costs Spartan GC (Sponsor Affiliate) Total Capex Budget
Developer Fee 6.0% of Hard and Soft Costs Spartan Investment Group Total Capex Budget
Financing Fee(5)(6) 1.0% of Loan Amount Spartan Investment Group Loan Proceeds
Seller Brokerage Fee(4)(6) 2.0% of Sale Price Affiliate Sales Broker Sales Proceeds
         
Recurring Fees:
Type of Fee Amount of Fee Received By Paid From
Administrative Services Fee 1.0% of Equity Invested* RM Admin, LLC(3) Cash Flow
Property Management Fee 6.0% of Gross Operating Income FreeUp Storage (Sponsor Affiliate) Cash Flow
Asset Management Fee 0.25% of Total Costs (up to $262,639 per annum) Spartan Investment Group Cash Flow
Tenant Reinsurance 50% of Tenant Insurance, net of expenses Spartan Investment Group Cash Flow

*Only applies to equity raised through the RealtyMogul Platform

(1) Fees may be deferred to reduce impact to investor distributions.

(2) RM Technologies, LLC, an affiliate of RealtyMogul, operates the RealtyMogul Platform.  RM Technologies, LLC charges a fixed, non-percentage-based fee for real estate companies and their sponsors to use the RM Technologies, LLC’s proprietary Platform and receive Platform-related services.  An estimate of this fee is included in the Closing Costs above and is intended to be capitalized into the transaction at the discretion of the Sponsor.  The Platform fees received by RM Technologies, LLC are disclosed in the relevant operating agreement(s).  RM Technologies LLC’s receipt of Platform fees creates a conflict of interest between RealtyMogul and its affiliates, and investors or prospective investors.

(3) RM Admin, an affiliate of RealtyMogul, charges an annual fixed administrative fee for providing certain ongoing administrative services to the Sponsor.  RM Admin’s administrative services and fees are disclosed in the relevant operating agreement(s). RM Admin’s receipt of administrative fees creates a conflict of interest between RealtyMogul and its affiliates, and investors or prospective investors.

(4) In no event will a "Seller Brokerage Fee" be paid to an affiliate of the Sponsor when "Seller Brokerage Fees" have been or will be paid to an unaffiliated third-parter sales broker

(5) In no event will a "Financing Fee" be paid to an affiliate of the Sponsor when the "Financing Fees" have been or will be paid to an unaffiliated third-party debt broker

(6) At this time, Spartan does not anticipate earning either the Financing Fee or the Seller Brokerage Fee. The current primary course of action is to work with 3rd parties and award both of these fees to those 3rd parties

The following offering documents have been prepared and are being delivered by the Sponsor of this investment opportunity, and not by RM Securities, LLC. RM Securities, LLC and its associated persons did not assist in preparing, do not explicitly or implicitly adopt or endorse, and are not otherwise responsible for, the Sponsors offering documents posted below or any content therein.
RM Securities, LLC and its Affiliates Compensation

RM Securities, LLC, its registered representatives, affiliates, associated persons, and personnel of its affiliates who may also be associated with it, including our associated persons and personnel of our affiliates who are also be associated with RM Securities, LLC (it (“RM Securities,” “we,” “our,” or “us”) will receive fees, expense reimbursements, and other compensation (“Fees”) from the issuer of this investment offering, its sponsor, or an affiliate thereof (“Sponsor”), or otherwise in connection with Sponsor’s offering. The Fees paid to us are in addition to other fees you will pay to Sponsor or in connection with Sponsor’s investment offering. You will pay Fees to Sponsor, either directly or indirectly as an investor in the Sponsor’s offering. Sponsor will use the Fees you pay, as well as funds you invest in the relevant offering, to compensate us. The Fees paid to us will directly or indirectly be borne by you as the investor (typically, but not always, in the form of an expense of the Sponsor’s offering in which you invest) because such Fees will reduce the proceeds available for distribution to you and reduce the amount you earn over time.

For more information on the Fees paid to us, or any other Fees you will pay in connection with Sponsor’s offering, please carefully review the Sponsor’s Investment Documents. Please also carefully review RM Securities’ Form CRS, Regulation Best Interest Disclosures, and Limited Brokerage Services Agreement.

No Approval, Opinion or Representation, or Warranty by RM Securities, LLC

Sponsor has provided, approved, and is solely responsible in all aspects for the information on this webpage (“Page”), including Sponsor’s offering documentation, which may include without limitation the Private Placement Memorandum, Operating or Limited Partnership Agreement, Subscription Agreement, the Project Summary and all exhibits and other documents attached thereto or referenced therein (collectively, the “Investment Documents”). The Investment Documents linked on this page have been prepared and posted by Sponsor, and not by RM Securities. We did not assist in preparing, do not adopt or endorse, and we are not otherwise responsible for, the Sponsor’s Investment Documents. We make no representations or warranties as to the accuracy of information on this Page or in the Sponsor’s Investment Documents and we accept no liability therefor. No part of the information on this Page or in the Sponsor’s Investment Documents is intended to be binding on us.

Sponsor’s Information Qualified by Investment Documents

The information on this Page is qualified in its entirety by reference to the more complete information about the offering contained in the Sponsor’s Investment Documents. The information on this Page is not complete and subject to change at the Sponsor’s discretion at any time up to the closing date. The Sponsor’s Investment Documents and supplements thereto contain important information about the Sponsor’s offering including relevant investment objectives, the business plan, risks, charges, expenses, and other information, which you should consider carefully before investing. The information on this Page should not be used as a basis for an investor’s decision to invest.

Risk of Investment

This investment is speculative, highly illiquid, and involves substantial risk. There can be no assurances that all or any of Sponsor’s assumptions, expectations, estimates, goals, hypothetical illustrations, or other aspects of Sponsor’s business plans (“Assumptions”) will be true or that actual performance will bear any relation to Sponsor’s Assumptions, and no guarantee or representation is made that Sponsor’s Assumptions will be achieved. If Sponsor does not achieve its Assumptions, your investment could be materially and adversely affected. A loss of part or all of the principal value of your investment may occur. You should not invest unless you can readily bear the consequences of such loss. Sponsor’s Assumptions should not be relied upon as the primary basis for your decision to invest.

No Reliance on Forward-Looking Statements; Sponsor Assumptions

Sponsor is solely responsible for statements made concerning forward-looking statements and Assumptions, which apply only as of the date made, are preliminary and subject to change, and are expressly qualified in their entirety by the disclosures and cautionary statements included in Sponsor’s Investment Documents, which you should carefully review. Neither RM Securities nor Sponsor are obligated to update or revise such forward-looking statements or Assumptions to reflect events or circumstances that arise after the date made or to reflect the occurrence of unanticipated events. Sponsor’s forward-looking statements and Assumptions are hypothetical, not based on actual investment achievements or events, and are presented solely for purposes of providing insight into the Sponsor’s investment objectives, detailing Sponsor’s anticipated risk and reward characteristics, and establishing a benchmark for future evaluation of actual results; therefore, they are not a predictor, projection, or guarantee of future results. You should not rely on Sponsor’s forward-looking statements as a basis to invest.

Importantly, we do not adopt, endorse, or provide any assurance of returns or as to the accuracy or reasonableness of Sponsor’s Assumptions or forward-looking statements.

No Reliance on Past Performance

Any description of past performance is not a reliable indicator of future performance and should not be relied upon as the primary basis to invest.

Sponsor’s Use of Debt

A substantial portion of the total cost of the real estate asset acquired by the Sponsor with investor funds (“Property”) will be paid with borrowed funds, i.e., debt. Sponsor’s estimated rates and terms of the debt financing are subject to lender approval, and there is no assurance that the Sponsor will secure debt at the rates and terms presented on this Page or in the Sponsor’s Investment Documents, or at all. The use of borrowed money to acquire real estate is referred to as leveraging, which can amplify losses and could result in lender foreclosure. In addition, if the debt includes a variable (or “floating”) interest rate, the total amount of interest paid over the term of the debt will fluctuate and can increase. As a result, Sponsor’s use of debt can result in a loss of some or all of your investment.

Sponsor’s Offering is Not Registered

Sponsor’s securities offering will not be registered under the Securities Act of 1933, as amended (the “Securities Act”), in reliance upon the exemptions from registration pursuant to Rule 506(c) of Regulation D as promulgated under the Securities Act (“Private Placement”). In addition, the offering will not be registered under any state securities laws in reliance on exemptions from state registration. Such securities (your ownership interests) are subject to restrictions on transferability and resale and may not be transferred or resold except as permitted under applicable state and federal securities laws pursuant to registration or an available exemption. All Private Placements on the Platform are intended solely for “Accredited Investors,” as that term is defined in Rule 501(a) under the Securities Act.

No Investment Advice

Nothing on this Page should be regarded as investment advice (either with respect to a particular security or regarding an overall investment strategy), a recommendation, an offer to sell, or a solicitation of or an offer to buy any security. Advice from a securities professional is strongly advised to understand and assess the risks associated with real estate or private placement investments. For additional information on RM Securities’ involvement in this offering, please carefully review the Sponsor’s Investment Documents, and RM Securities’ Form CRS, Regulation Best Interest Disclosures, and Limited Brokerage Services Agreement.

1031 Exchange Risk

Internal Revenue Code Section 1031 (“Section 1031”) contains complex tax concepts and certain tax consequences may vary depending on the individual circumstances of each investor. RM Securities and its affiliates make no representation or warranty of any kind with respect to the tax consequences of your investment or that the IRS will not challenge any such treatment. You should consult with and rely on your own tax advisor about the tax aspects with respect to your particular circumstances.

INVEST TODAY

...

Questions?

(877) 781-7062

Contact Investor Relations
Staff Menu (IO ID#: 1549148):
EDIT IO DOCUMENTS
Staff Menu (IO ID#: 1549148):
EDIT IO DOCUMENTS
JOIN REALTYMOGUL
Create an account or sign in.
Are you an Accredited Investor?
Must be 8 characters or more with an uppercase and lowercase character, a number, and a symbol.
By clicking "JOIN REALTYMOGUL" you are agreeing to our Terms of Service and Privacy Policy, and that you've had an opportunity to review RM Securities, LLC's Form Customer Relationship Summary.
SIGN IN
Don’t have an account yet? Join RealtyMogul.
Forgot Password?
Questions? Our Investor Relations team is available to help 8 AM - 6 PM PST Monday to Friday. Contact us at (877) 977-2776.
Forgot Password
Enter your email address to receive a code to reset your password.
Enter the code sent to your email address below and your new password.

Resend Code

WELCOME
Welcome,

Welcome to RealtyMogul! We need to ask a few additional questions to get to know you.

Your Net Worth
Are you interested in 1031 exchanges?
Thank you!

We’ve received your information and updated your Investor Profile.

Welcome to RealtyMogul

As part of RealtyMogul's commitment to transparency, we want to inform you that you have been directed to our website from an unaffiliated third-party marketing company who is compensated up to $250 for each investor who registers on our site. RealtyMogul and its affiliates have no relationship with the marketing company other than this compensation arrangement. RealtyMogul and its affiliates are not responsible for the preparation or accuracy of, and do not explicitly or implicitly adopt or endorse, any content provided by the unaffiliated marketing company.