


Next Wave Investors, LLC (“Next Wave”) is a Southern California-based private equity investment firm with a specialized focus in value-add multifamily investments throughout the Western United States. With more than $400 million in acquisitions to date, Next Wave is exceptionally skilled in identifying well-located, underappreciated properties where they can create value through professional operations and capital improvements. Drawing upon an 18-year track record and hands-on experience in the ownership, operation, and enhancement of multifamily properties, the firm consistently delivers value on behalf of individual and institutional investors throughout the globe.
Serrano North and South (the "Property") is an adjacent two property Class C+, garden style multifamily portfolio located in the Nevada Lidgerwood submarket of Spokane, Washington. 119 Units (Serrano South Apartments) were built in 1981 and 180 units (Serrano North Apartments) were built in 1984 bringing the total unit count to 299. The unit mix is comprised of studio, one-, two-, and three-bedroom floorplans and all units maintain their original 1980’s finishes. All units are equipped with ample closet space, air conditioning, and private patios or balconies. Top floor units enjoy vaulted ceilings and wood burning fireplaces as well. Community amenities include a pool, a playground, BBQ and picnic areas, a community center, five laundry facilities, and central courtyards for tenants to enjoy. Occupancy at the Property is currently 97.7%.
Unit Mix
| Unit Type | # Units | Avg SF/Unit | Avg Rent (In-Place) |
Avg Rent (Stabilized Yr 1) |
| Studio | 1 | 480 | $500 | $674 |
| 1 Bed x 1 Bath | 30 | 680 | $719 | $948 |
| 2 Bed x 1 Bath A | 87 | 780 | $779 | $1,009 |
| 2 Bed x 1 Bath B | 45 | 845 | $821 | $1,049 |
| 2 Bed x 1 Bath C | 46 | 902 | $825 | $1,075 |
| 2 Bed x 1 Bath D | 48 | 931 | $836 | $1,140 |
| 3 Bed x 1 Bath | 1 | 980 | $965 | $1,181 |
| 3 Bed x 1.5 Bath | 41 | 987 | $965 | $1,267 |
| Total | 299 | 851 | $819 | $1,075 |
Lease Comps
| Rosewood Club* | Gogo Heights** | Rock Creek on Nevada | Center Court Apartments | Comp Averages | Serrano North & South (Subject) | |
| Year Built | 1977 | 1989 | 1996 | 1979 | 1985 | 1984 |
| Units | 155 | 138 | 132 | 153 | 145 | 299 |
| Distance to Subject | 1.2 Miles | 0.2 Miles | 0.6 Miles | 0.6 Miles | 0.7 Miles | |
| $/Unit (1x1) | $1,025 | $1,100 | $770 | $991 | $939 | |
| SF (1x1) | 680 | 750 | 611 | 684 | 674 | |
| $/SF (1x1) | $1.51 | $1.47 | $1.26 | $1.45 | $1.39 | |
| $/Unit (2x1) | $975 | $1,350 | $1,075 | $1,020 | $1,117 | $1,058 |
| SF (2x1) | 780 | 1,025 | 1,010 | 714 | 878 | 850 |
| $/SF (2x1) | $1.25 | $1.32 | $1.06 | $1.43 | $1.27 | $1.25 |
| $/Unit (3x1.5) | $1,550 | $1,490 | $1,491 | $1,265 | ||
| SF (3x1.5) | 1,360 | 1,250 | 1,252 | 987 | ||
| $/SF (3x1.5) | $1.14 | $1.19 | $1.19 | $1.28 |
*Rosewood Club and Gogo Heights are professionally managed.
**Gogo Heights is the only lease comp that is currently renovating.
Sales Comps
| Northern Heights | Willowbrook Apartments | Northstar Lodge | Total/Averages | Subject | |
| Date | Nov '19 | Dec '19 | Dec '19 | Mar '21 | |
| Submarket | West Spokane | Opportunity | Town and Center | Nevada Lidgerwood | |
| Total SF | 191,011 | 94,062 | 116,563 | 133,879 | 270,788 |
| Units | 232 | 110 | 114 | 152 | 299 |
| Year Built | 2018 | 1991 | 2008 | 2006 | 1981/1984 |
| Average SF | 823 | 855 | 1,022 | 900 | 906 |
| Purchase Price | $34,000,000 | $15,850,000 | $19,683,500 | $23,177,833 | $35,000,000 |
| $/Unit | $146,552 | $144,091 | $172,662 | $154,435 | $117,057 |
| Distance from Subject (mi.) | 9.7 Miles | 8.2 Miles | 1.2 Miles | 6.4 Miles |
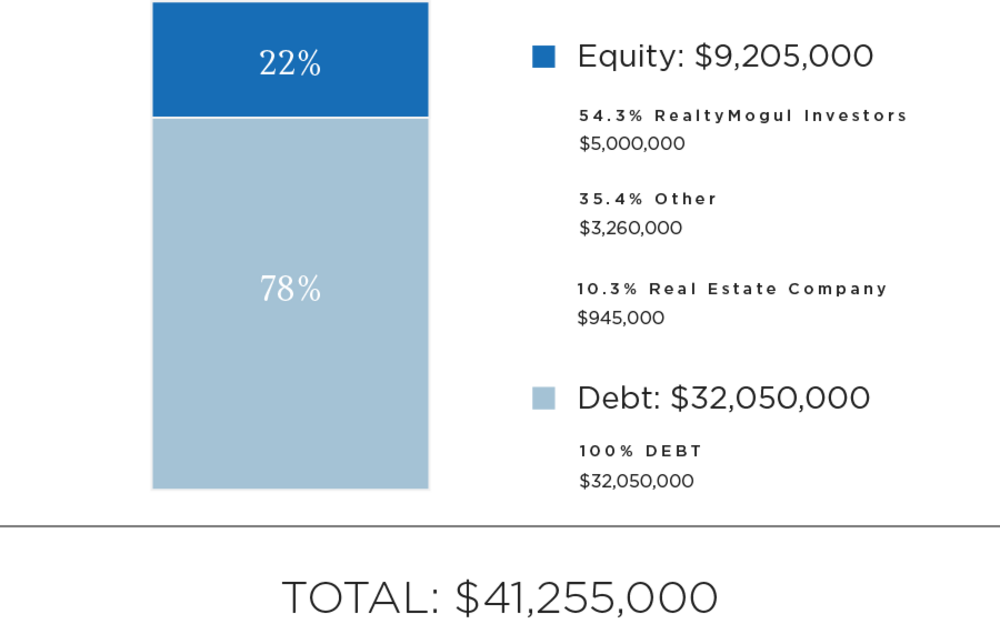
| Sources of Funds | $ Amount | $/Unit |
| Debt | $32,050,000 | $107,191 |
| GP Investor Equity | $945,000 | $3,161 |
| RM Investor Equity | $5,000,000 | $16,722 |
| Other LP Investor Equity | $3,260,000 | $10,903 |
| Total Sources of Funds | $41,255,000 | $137,977 |
| Uses of Funds | $ Amount | $/Unit |
| Purchase Price | $34,400,000 | $115,050 |
| Acquisition Fee | $344,000 | $1,151 |
| Closing Costs (1) | $545,702 | $1,825 |
| CapEx, TI, LC | $5,000,000 | $16,722 |
| Working Capital | $25,000 | $84 |
| Loan Placement Reserve | $496,775 | $1,661 |
| Prepaid/Expense Reserve | $341,346 | $1,142 |
| Rate Cap Cost | $102,177 | $342 |
| Total Uses of Funds | $41,255,000 | $137,977 |
Please note that the NextWave's equity contribution may consist of friends and family equity and equity from funds controlled by NextWave. Additionally, the numbers represented above can change prior to closing depending on final loan proceeds, property condition assessments, appraisals, final closing costs, and other lender-mandated expenses.
(1) RM Technologies operates the RealtyMogul platform. RM Technologies charges a fixed, non-percentage-based fee for real estate companies to use the marketplace. An estimate of this fee is included in the Closing Costs and is intended to be capitalized into the transaction at the discretion of the Manager.
The expected terms of the debt financing are as follows:
- Total Estimated Proceeds: $32,050,000
- Estimated Rate (Floating): 3.45% + LIBOR (with a 0.25% LIBOR Floor)
- Amortization: 30 years
- Term: 5 years
- Interest Only: 3 Year + Two 1 Year Extensions
There can be no assurance that a lender will provide debt on the rates and terms noted above, or at all. All rates and terms of the debt financing are subject to lender approval, including but not limited to possible increases in capital reserve requirements for funds to be held in a lender-controlled capital reserve account.
A substantial portion of the total acquisition for the Property will be paid with borrowed funds. The use of borrowed money to acquire real estate is referred to as leveraging. Leveraging increases the funds available for investment or development purposes, on the one hand, but also increases the risk of loss on the other. If the Company were unable to pay the payments on the borrowed funds (called a "default"), the lender might foreclose, and the Company could lose its investment in its property.
Next Wave intends to make distributions from NWI Serrano, LLC to Investors as follows:
1. Pari Passu to 10.0% IRR
2. 67.5%/32.5% (67.5% to Investors/32.5% to The Real Estate Company) to 15% IRR
3. 50%/50% (50.0% to Investors/50.0% to The Real Estate Company) thereafter
Note: These distributions will occur after the payment of the Company's liabilities (loan payments, operating expenses and other fees as set forth in the LLC agreement, in addition to any member loans or returns due on member loans). Distributions are expected to start in October 2021 and are projected to continue on a quarterly basis thereafter. These distributions are at the discretion of NextWave, who may decide to delay distributions for any reason, including maintenance or capital reserves. The Real Estate Company will receive a promote as indicated above, and a portion of this promote may be received by RM Admin for administrative services.
Cash Flow Summary
| Year 1 | Year 2 | Year 3 | Year 4 | Year 5 | |||
| Effective Gross Revenue | $3,123,214 | $3,708,208 | $3,984,321 | $4,316,710 | $4,559,801 | ||
| Total Operating Expenses | $1,533,116 | $1,618,093 | $1,686,514 | $1,737,779 | $1,787,517 | ||
| Net Operating Income | $1,590,098 | $2,090,115 | $2,297,808 | $2,578,932 | $2,772,284 | ||
Project-Level Cash Flows
| Year 0 | Year 1 | Year 2 | Year 3 | Year 4* | Year 5 | |||
| Net Cash Flow | -$9,205,000 | $272,386 | $763,628 | $940,221 | $593,121 | $19,358,154 | ||
*Debt I/O expiration
Investor-Level Cash Flows
| Year 0 | Year 1 | Year 2 | Year 3 | Year 4 | Year 5 | |||
| Net Cash Flow | -$8,260,000 | $158,197 | $602,632 | $761,096 | $449,630 | $14,924,303 | ||
Investor-Level Cash Flows - Hypothetical $50,000 Investment*
| Year 0 | Year 1 | Year 2 | Year 3 | Year 4 | Year 5 | |||
| Net Cash Flow | -$50,000 | $958 | $3,648 | $4,607 | $2,722 | $90,341 | ||
*Returns are net of all fees including RealtyMogul's 1.0% annual administrative services fee.
NO ASSURANCE OF RETURN: The Company's pro-forma projections are based on assumptions regarding future events, such as the timing and extent of the recovery of the residential market and the stabilization of the debt markets. While the Manager believes that these assumptions are reasonable and achievable, the likelihood of its occurrence is subject to many factors that are not within the control of the Company or its Manager and that could impair the ability of the Company to meet its projections.
Certain fees and compensation will be paid over the life of the transaction; please refer to NextWave's materials for details. The following fees and compensation will be paid(1)(2)(3):
| One Time Fees: | |||||
| Type of Fee | Amount of Fee | Received By | Paid From | ||
| Acquisition Fee | 1% of Gross Acquisition Price | Next Wave | Capitalization | ||
| Construction Management Fee | 7.5% of Total Construction Costs | Next Wave | Capitalization | ||
| Disposition Fee* | 1.0% of Gross Sales Price | Next Wave | Sales Proceeds | ||
| Recurring Fees: | |||||
| Type of Fee | Amount of Fee | Received By | Paid From | ||
| Property Management Fee | 3.0% of EGI | Next Wave | Property Cashflow | ||
| Asset Management Fee | 1.5% of EGI | Next Wave | Property Cashflow | ||
| Administrative Services Fee | 1.0% of amount invested | RM Admin (3) | Distributable Cash | ||
*Disposition Fee – 1% of the gross sales price of the Project, contingent on both (A) return to Investors of initial invested capital and (B) Investors realizing 10% IRR on initial invested capital.
The above table is a summary and there may be additional fees and expenses associated with this offering. Please refer to the Private Placement Memorandum for further details.
(1) Fees may be deferred to reduce impact to investor distributions
(2) RM Technologies operates the RealtyMogul platform. RM Technologies charges a fixed, non-percentage-based fee for real estate companies to use the marketplace. An estimate of this fee is included in the Closing Costs and is intended to be capitalized into the transaction at the discretion of the Manager.
(3) RM Admin will be providing the following services:(a) responding to inbound investor inquiries regarding how to subscribe to the Project, (b) distribution of all annual tax forms (after receipt of same from Project Sponsor), (c) processing distributions that are payable from RM Investors to Investors, however, RM Admin will not be deemed to have custody of client funds, (d) distribution of all quarterly reports (after receipt of same from Project Sponsor) and (e) summarizing sponsor information on property performance, responding to investor inquiries regarding sponsor performance information as well as the real estate market generally.
The information on this Page is qualified in its entirety by reference to the more complete information about the offering contained in the Sponsor’s Investment Documents. The information on this Page is not complete and subject to change at the Sponsor’s discretion at any time up to the closing date. The Sponsor’s Investment Documents and supplements thereto contain important information about the Sponsor’s offering including relevant investment objectives, the business plan, risks, charges, expenses, and other information, which you should consider carefully before investing. The information on this Page should not be used as a basis for an investor’s decision to invest.
Risk of InvestmentThis investment is speculative, highly illiquid, and involves substantial risk. There can be no assurances that all or any of Sponsor’s assumptions, expectations, estimates, goals, hypothetical illustrations, or other aspects of Sponsor’s business plans (“Assumptions”) will be true or that actual performance will bear any relation to Sponsor’s Assumptions, and no guarantee or representation is made that Sponsor’s Assumptions will be achieved. If Sponsor does not achieve its Assumptions, your investment could be materially and adversely affected. A loss of part or all of the principal value of your investment may occur. You should not invest unless you can readily bear the consequences of such loss. Sponsor’s Assumptions should not be relied upon as the primary basis for your decision to invest.
No Reliance on Forward-Looking Statements; Sponsor AssumptionsSponsor is solely responsible for statements made concerning forward-looking statements and Assumptions, which apply only as of the date made, are preliminary and subject to change, and are expressly qualified in their entirety by the disclosures and cautionary statements included in Sponsor’s Investment Documents, which you should carefully review. Sponsor is obligated to update or revise such forward-looking statements or Assumptions to reflect events or circumstances that arise after the date made or to reflect the occurrence of unanticipated events. Sponsor’s forward-looking statements and Assumptions are hypothetical, not based on actual investment achievements or events, and are presented solely for purposes of providing insight into the Sponsor’s investment objectives, detailing Sponsor’s anticipated risk and reward characteristics, and establishing a benchmark for future evaluation of actual results; therefore, they are not a predictor, projection, or guarantee of future results. You should not rely on Sponsor’s forward-looking statements as a basis to invest.
Importantly, we do not adopt, endorse, or provide any assurance of returns or as to the accuracy or reasonableness of Sponsor’s Assumptions or forward-looking statements.
No Reliance on Past PerformanceAny description of past performance is not a reliable indicator of future performance and should not be relied upon as the primary basis to invest.
Sponsor’s Use of DebtA substantial portion of the total cost of the real estate asset acquired by the Sponsor with investor funds (“Property”) will be paid with borrowed funds, i.e., debt. Sponsor’s estimated rates and terms of the debt financing are subject to lender approval, and there is no assurance that the Sponsor will secure debt at the rates and terms presented on this Page or in the Sponsor’s Investment Documents, or at all. The use of borrowed money to acquire real estate is referred to as leveraging, which can amplify losses and could result in lender foreclosure. In addition, if the debt includes a variable (or “floating”) interest rate, the total amount of interest paid over the term of the debt will fluctuate and can increase. As a result, Sponsor’s use of debt can result in a loss of some or all of your investment.
Sponsor’s Offering is Not RegisteredSponsor’s securities offering will not be registered under the Securities Act of 1933, as amended (the “Securities Act”), in reliance upon the exemptions from registration pursuant to Rule 506(c) of Regulation D as promulgated under the Securities Act (“Private Placement”). In addition, the offering will not be registered under any state securities laws in reliance on exemptions from state registration. Such securities (your ownership interests) are subject to restrictions on transferability and resale and may not be transferred or resold except as permitted under applicable state and federal securities laws pursuant to registration or an available exemption. All Private Placements on the Platform are intended solely for “Accredited Investors,” as that term is defined in Rule 501(a) under the Securities Act.
No Investment AdviceNothing on this Page should be regarded as investment advice (either with respect to a particular security or regarding an overall investment strategy), a recommendation, an offer to sell, or a solicitation of or an offer to buy any security. Advice from a securities professional is strongly advised to understand and assess the risks associated with real estate or private placement investments.
1031 Exchange RiskInternal Revenue Code Section 1031 (“Section 1031”) contains complex tax concepts and certain tax consequences may vary depending on the individual circumstances of each investor. You should consult with and rely on your own tax advisor about the tax aspects with respect to your particular circumstances.