Risk and Quality Controls
Steps we take to mitigate risk on the Platform
Sponsors

We run extensive background checks, criminal checks, bad actor checks, and reference checks on sponsors. In addition to never allowing a sponsor with a criminal history / any securities related issue to use the platform, we may also turn down sponsors due to poor reference checks even if background and criminal checks come back clear.

Escrow accounts

We require unaffiliated sponsors to use an unaffiliated third-party escrow agent. When an investor makes an investment with unaffiliated sponsors using the RealtyMogul platform, the investor’s money is transferred directly into a third-party escrow account. All closing conditions in connection with a sponsor’s offering need to be met before the third-party escrow agent will approve releasing investor funds to the issuer or general partner. For example, if an issuer or general partner plans to use funds for a real estate acquisition that does not ultimately transact, the third-party escrow agent will not transfer investor funds to the issuer or general partner, and funds will be returned to investors.

Boots on the ground

Our controls include visiting every property (or a subset of properties if it’s a fund) to confirm the real estate is what and where the real estate is supposed to be.

Detailed Checklists

We have robust quality controls with detailed checklists and a review of third-party reports.

Funded
Target IRR  16.4%-18.4% *
17.4%
Target Avg. Cash on Cash* 11.0%
Target Equity Multiple* 2.0x
Estimated Hold Period* 5 years
FUNDED 100%
...
View our Risk and Quality Controls.
*Please carefully review the Disclaimers section below, including regarding Sponsor’s assumptions and target returns
Offered By
Manzo Freeman Development
Investment Strategy Value-Add
Investment Type Equity
Estimated First Distribution 11/2021
Minimum Investment 25000
Overview
Value-add acquisition of a 508,200 SF historic industrial and office mill in the Boston MSA alongside a locally experienced Real Estate Company.
Cash Flow

The Property is being acquired off-market at a 11.4% cap rate based on Year 1 proforma NOI. The Real Estate Company's business plan calls for a 11% average cash-on-cash return, including a 10.4% Year 1 cash-on-cash return.

Partner

The principals of the Real Estate Company have acquired $1.75 billion of real estate in the Market over their careers and have extensive experience in owning and managing multi-tenant value add flex industrial and office assets, including repositioning of New England mill properties.

Location

The Property is a transit oriented property that is strategically well-located and positioned to leverage its locational attributes catering to local, regional and national businesses seeking cost efficient office and industrial/flex space as well as the ability to draw on large and diverse labor pool and customer base within Massachusetts and New Hampshire

Property at a glance
Year Built 1909
Rentable SF 430,051
Number of Tenants 67
Current Occupancy 80.3% as of January 2021
Parking Ratio 1.55 per 1,000 SF
Acquisition Price $7,050,000
Investment Highlights
Manzo Freeman Development is under contract to purchase the Property for $16/SF at a going-in cap rate of 11.4%.
The Property is located in Lawrence, MA and is part of the Boston MSA. The submarket has enjoyed recent economic revitalization which has translated into a healthy and growing commercial real estate market.
Manzo Freeman Development has budgeted $3,250,000 ($7.62/SF) for capital improvements, including a 10% contingency.
The exit strategy is to sell the Property in five years at an exit cap rate of 8.75%.
Management
Cumulative Distributions

Manzo Freeman Development

Manzo Freeman Development (the "Real Estate Company” or "MFD") is a privately owned real estate development firm with offices in Burlington and Hudson, MA. The Real Estate Company is a vertically integrated real estate acquisition development and management company with a full suite of services. The MFD team is highly experienced in acquisitions, due diligence, permitting, redevelopment, construction management, property management, asset management, accounting, and leasing. The Real Estate Company leverages 40+ years of direct real estate acquisition and development experience, in depth local market knowledge, strong reputation, and track record of success. MFD believes in the true power of community building. It is the heart and soul of everything they do.

https://www.manzofreeman.com/
  • Michael A. Manzo
    Chairman and Director of Acquisitions
  • Joseph Freeman
    CEO and Director of Business Development
  • Michael K. Manzo
    Managing Partner and President
  • Alexandra Freeman
    Managing Partner and Director of Leasing
  • Ali Freeman
    Chief Financial Officer
Michael A. Manzo
Chairman and Director of Acquisitions

Michael A. Manzo is the Chairman and Director of Acquisitions for Manzo Freeman Development. Mr. Manzo was formerly a Partner, Senior Vice President and member of the Senior Executive Team at The Beal Companies, a Boston-based real estate investment company (now Related Beal).

In his role as Partner, he directed the firm’s investment and development activities, focusing on commercial, industrial, life science, healthcare, multi-family real estate development and investment opportunities. As a senior executive and Partner, Mr. Manzo played an integral part in directing the strategic direction of the Company as well as sourcing deals, reviewing development and investment opportunities, and managing projects. He retains an ownership position in a number of Beal projects.

In his career, Mr. Manzo has originated, arranged, and managed real estate investments, including, discretionary investment funds, and joint ventures with a broad range of institutional partners. Through his various partnerships, Mr. Manzo has directed more than $250 million of equity, with an aggregate property value in excess of $1.75 billion. 

​Mr. Manzo is a former President of the Greater Boston Real Estate Board and a Director and past Secretary of the National Association of Industrial and Office Parks (New England Chapter). He is also a Member of the invitation-only American Society of Real Estate Counselors. Mr. Manzo received his M.B.A. and B.S. from The Pennsylvania State University.

Joseph Freeman
CEO and Director of Business Development

Joe Freeman is the CEO and Director of Business Development for Manzo Freeman Development. Prior to founding Manzo Freeman Development, Mr. Freeman was General Counsel and member of the senior executive team at Saracen Properties. As a senior executive and General Counsel, Mr. Freeman played an integral role in directing the strategic direction of the Company as well as sourcing deals, reviewing development and investment opportunities, and managing projects. During his time at Saracen Properties, the company developed over 2M SF of class A office and hotel space along the 128 corridor from Westwood, MA to Waltham, MA. 

​Prior to his role at Saracen Properties, Mr. Freeman founded The Freeman Firm, P.C. in 1992, where he represented a variety of commercial real estate clients including South Shore Hospital, Cresset Partners, NAI Hunneman and Saracen Properties. Mr. Freeman has investments in a number of operating businesses and real estate partnerships. He is passionate about real estate conservation and owns significant land holdings in Georgia timber property. Mr. Freeman received his JD from Boston College Law School and also attended University of Notre Dame Law School. Mr. Freeman received a BS in finance from University of Colorado Business School.

Michael K. Manzo
Managing Partner and President

Michael K. Manzo is the Managing Partner and President of Manzo Freeman Development. Mr. Manzo's responsibilities include assessing new acquisition and development projects, sourcing deals and capital and overseeing underwriting, asset management and leasing activities.

Mr. Manzo spent the first 10+ years of his professional career in commercial banking, real estate finance and land development. Mr. Manzo formerly co-founded Entegra Development & Investment, based in Andover, MA, a green building consulting and LEED Certification firm servicing a wide range of commercial and residential clients. Mr. Manzo also worked as a Portfolio Manager and commercial lending Analyst for FleetBoston Financial (now Bank of America) in downtown Boston, where he worked with a wide range of clients in the commercial transportation industries, including railroads, marine freight shippers and affiliated freight container manufacturers and leasing companies. 

Additionally, as a Financial Analyst for the A.D. Makepeace Company based in Wareham, MA, the world’s largest cranberry grower and largest private landowner in eastern Massachusetts, Mr. Manzo worked primarily on the launch of several new residential developments on company owned land. His experience there includes working on a 12-year master planned development of over 1,000 acres of land in Plymouth, MA that incorporated residential, retail, office and public services uses plus the permanent protection of hundreds of acres of pristine conservation land. 

Mr. Manzo holds an MBA from Babson College and a BA from Brown University.

Alexandra Freeman
Managing Partner and Director of Leasing

Alexandra (Alex) Freeman is the Managing Partner and Director of Leasing for Manzo Freeman Development. Prior to joining MFD in 2019, Ms. Freeman spent four years consulting for Pricewaterhouse Coopers (“PwC”) within their Advisory practice. Ms. Freeman consulted for large financial services clients including US global banks, professional services firms, private market clients specializing in real estate investment, and global paper and water chemical companies. She focused on developing strategies to enhance current business processes to improve clients’ overall performance which she now leverages in her work as a real estate developer at MFD.

During her time at PwC, Ms. Freeman supported the carve out and merger of a $1B paper and water chemicals business playing a key role in the deal’s management office managing nine workstreams including VP and C-suite level personnel. Ms. Freeman primarily specializes in tenant relations, leasing and property management, using the skills, expertise, and network she acquired during her time at PwC. Ms. Freeman also has venture capital, portfolio management and customer experience while working at General Catalyst Partners, Warby Parker and Rough Draft Ventures. Ms. Freeman holds a BS in Business from Babson College.

Ali Freeman
Chief Financial Officer

Ali Freeman is the Chief Financial Officer for Manzo Freeman Development. Prior to joining the Manzo Freeman Development team, Ms. Freeman worked as an accountant for Laventhol & Horwath in Portland, OR and Donald Engleman, CPA in Framingham, MA. For the past 20 years, she has maintained her own accounting and bookkeeping practice for various lawyers, doctors, restaurants, and real estate investment and development companies across the country. Ms. Freeman currently does the accounting and bookkeeping for MFD's properties at The Landing at Hudson Mills and The Landing at One Chestnut. Ms. Freeman received her BS at Northeastern University.


Michael A. Manzo Track Record

Transaction Location Year Property Type
177 Milk Street Boston, MA 1978 Office
Southern New Hampshire Executive Park Manchester, NH 1980 Industrial, Office & Land
Life Science Square East Cambridge, MA 1981 Life Science & Light Manufacturing
89 Broad Street Boston, MA 1983 Office
Park Square Building Boston, MA 1984 Office & Retail
200 Q. Parkway Wakefield, MA 1984 Office
Ferrofludics Nashua, NH 1985 Industrial, Office & Manufacturing
Sahara Corp. Weymouth, MA 1985 Office & Manufacturing
1 Ledgemont Center Lexington, MA 1985 Office & Life Science
2 Ledgemont Center Lexington, MA 1985 Office & Land
52,40 & 10 Second Ave. Waltham, MA 1986 Light Industrial & R&D
Portland Street Boston, MA 1986 Office & Life Science
Boatman’s Bank Center St. Louis, MO 1987 Office & Retail
Green Springs Shopping Center Baltimore, MD 1987 Retail
East Stream Portfolio Billerica, MA 1988 Industrial, Office & R&D
Redeveloped Amer. Mutual Wakefield, MA 1989 Office
100 Q. Parkway Wakefield, MA 1989 Office
133 State Street Boston, MA 1990 Office & Retail
Custom House Hotel Boston, MA 1992 Hospitality
Waltham Corporate Center Waltham, MA 2000 Office & Retail
300 Third Street East Cambridge, MA 2002 Office, R&D, Life Science, Retail & Parking
50 Comm. Ave Boston, MA 2003 Condo
128 Beacon Street Boston, MA 2005 Condo
One Kendall Square Complex East Cambridge, MA 2006 Office, Life Science, Retail & Parking
Seaport Center Boston, MA 2006 Office, Life Science & Retail
800 Huntington Ave. Redevelop. Boston, MA 2006 Health care
The Clarendon Boston, MA 2006 Multifamily, Condo & Retail
800 Huntington Boston, MA 2010 Life Science

Post-Beal Companies Track Record

Property City, State Asset Type Acq Date SF Total Capitalization Company Name
Walpole Station Business Center Walpole, MA Commercial mill flex property 2011 315,000 $8,500,000 Manzo Company
656 Joseph Warner Blvd Taunton, MA Industrial property acquisition 2011 242,000 $8,000,000 Manzo Company
761 Joseph Warner Blvd Taunton, MA Industrial property acquisition 2011 128,000 $4,500,000 Manzo Company
15 Dix Street Condos Winchester, MA 12 unit luxury condo development 2014 33,000 $14,000,000 Manzo Company
Landing at Hudson Mills Hudson, MA Commercial mill flex property 2018 212,000 $9,500,000 Manzo Freeman Development
Landing at One Chestnut Nashua, NH Commercial mill flex property 2019 432,000 $10,500,000 Manzo Freeman Development
Total       1,362,000 $55,000,000  

The above bios and track records were provided by Manzo Freeman Development and have not been independently verified by RealtyMogul or its affiliates.

Business Plan

The Real Estate Company is acquiring the Property at a $7,050,000 purchase price ($16/rsf), with the investment objective to maximize the Property’s intrinsic value by unlocking its strategic market position and functional potential as an institutional-grade mixed-use office and industrial flex property. 

The Property is currently 80.3% occupied with strong cash flows. The business plan includes the acquisition, rehab, and repositioning of the Property. The Real Estate Company will spend $3.3 million on building renovations and capital improvement costs (including a 10% contingency), $3.6 million on tenant improvement and leasing costs, and $1.4 million in soft costs.

Per the Real Estate Company, the current owner is the second generation of family ownership and has not maximized occupancy, increased rents to true market potential, or improved the overall building in a broad manner as an institutional owner would. The Real Estate Company is highly experienced at institutional leasing, asset and property management and plans to bump occupancy from the current 80.3% to a stabilized 89.5% during the hold period. The Real Estate Company plans to renew most leases to three to five year terms, vacate weaker tenants, and increase rents for tenants whose rents are under market during the first few years, through a tried and true program of partnering with tenants, building a true sense of “community” and investing in tenant spaces, common areas, and systems. The Real Estate Company's Year 1 base rent assumes rental income mostly from in-place tenants and assumes nominal rent from leasing of vacant space. The Real Estate Company has underwritten rents as follows: $12-14/SF for office (compared to market at $19-20/SF), $7.25/SF for industrial (compared to market at $8.50-9.50/SF), and $15/SF for retail.

The business plan calls for a five-year hold, at which point the Real Estate Company has underwritten the Property to be sold for approximately $18.5 million ($43/SF) at an 8.75% exit cap rate.

Note: an integral component of the deal was the bifurcation of the subject asset, Everett Mill, from the adjacent historic Stone Mill, also owned by the current owner. The Stone Mill is an approximately 100,000 square foot iconic mill property on the National Historic Register that has fallen into disrepair. The Real Estate Company was strategically able to procure a buyer and negotiate and structure a favorable deal to re-sell Stone Mill, simultaneously with the closing of Everett Mill, to one of the largest, most respected housing developers in the country. The developer plans to invest upwards of $40 million to transform Stone Mill into 90 +/- mixed-income housing units that will greatly enhance the overall mixed-use campus feel of the combined properties. The post-closing business plan and financial assumptions exclude the Stone Mill component.

Capital Improvements Budget Summary: 
Renovations Total Amount
Elevator Replacement and Upgrades (5 total) $1,060,000
Mechanical and Electrical Upgrades $400,000
Window Replacements $300,000
Building Entrance and Lobby Upgrades $240,000
Main Corridor, Stairwell, and Restroom Upgrades $185,000
Dock Upgrades $155,000
Parking Lot Repair $150,700
Roof Repair $150,000
Building Signage (Exterior and Interior) $100,000
Miscellaneous $93,700
Construction Management Fee $142,857
Contingency $297,743
Grand Total $3,275,000

These amounts are subject to change at the discretion of the Real Estate Company.

Property

Everett Mill (the "Property") is a 508,200 gross square feet, seven-story historical mill building comprised of flex office, industrial, and ground floor retail spaces. The Property has history dating back to the early 1900s with the first known true labor strike in America starting at its front steps; the strike set off positive changes in labor laws and wages across the United States. 

The Property features a diverse tenant mix with 67 tenants ranging in size from 500 square feet to over 34,000 square feet. The Property features high ceilings, large windows, original refinished wood floors, natural brick, and exposed beams. The Property is located within a 0.5 mile walk to the Lawrence MBTA, with one-hour commute to Downtown Boston. The Property's main entrance is the gateway to the main street in downtown Lawrence that features a wide variety of restaurants, bars, and retail amenities. The Everett Mill enjoys proximity to major employers such as Lawrence General Hospital, New Balance, Amazon and Mass Hire, as well as major educational institutions such as Cambridge College, Suffolk University, Regis College, and Lawrence Public Schools. The Property is one of the last commercial and industrial mills of scale available in the Market, as most have been re-developed into multifamily apartments. The historic appeal of the Property within the developing neighborhood location allows it to be an unique asset in the market.

Per the Real Estate Company, the Property's functional versatility is highly appealing to a variety of tenants affording the Property multiple options to maximize operating income and value. The rent roll is durable with the largest tenants showing an average lease tenure of 10 years, some of which have been at the Property for 20-25 years.

Rent Roll Summary as of January 1, 2021:

Tenant Square Feet % of Total Rent ($/SF) Lease Start Lease Expiration
National Fiber Technology 34,280 8.0% $4.12 9/1/2012 8/31/2024
Phoenix Charter Academy Lawrence 28,000 6.5% $13.12 8/1/2013 7/31/2023
Vineyard Vines 20,000 4.7% $2.77 1/1/2016 12/31/2023
Affordable Computer Tech 17,658 4.1% $4.00 1/1/1995 12/31/2021
Valentine & Kebartas 17,000 4.0% $10.00 7/1/2001 8/31/2021
Inventory Management 16,800 3.9% $5.30 5/1/2005 11/30/2023
Canal Street Antiques 16,684 3.9% $6.50 5/1/2016 4/30/2022
Southwick Social Ventures 12,000 2.8% $8.50 9/1/2020 8/31/2023
Youth Development Org 11,070 2.6% $5.79 7/1/2013 6/30/2021
Onyx Spectrum 10,140 2.4% $6.50 12/1/2015 11/30/2021
New Balance Warehouse 10,000 2.3% $4.30 1/1/2013 12/31/2022
Mid Size Tenants (2k-10k SF) 121,089 28.2% $7.90 Varies Varies
Small Tenants (<2k SF) 30,592 7.1% $7.42 Varies Varies
Vacant 84,738 19.7% N/A N/A N/A
Total/Averages 430,051 100% $7.13    

The rent roll was provided by Manzo Freeman Development and has not been independently audited by RealtyMogul or its affiliates. Please refer to Manzo Freeman Development's materials to see the full rent roll details.


Lease Comparables

  250 Merrimack St. 360 Merrimack St. 60 Island St. One Canal St. 290 Merrimack St. 599 Canal St. Averages Subject (Post-Reno Rents)
Rentable Sq. Ft. 400,000 478,250 147,000 112,000 55,540 89,000 213,632 430,051
Comp Type Office Office Office Office Retail Industrial   Flex
Market Rent ($/SF) $20 $17-18 $20 $15 $16 (NNN) $8.40-$8.76   $12-14 Office, $7.25 Industrial, $15 Retail
Occupancy 100% 99% 97% 92% 93% 87% 94.7% 80.3% (89.5% stabilized)
Location Lawrence, MA Lawrence, MA Lawrence, MA Lawrence, MA Lawrence, MA Lawrence, MA   Lawrence, MA

Mill Building Sale Comparables

  55 S Commercial St. 200 Homer Ave. 970 Fellsway 480 Pleasant St. 86 Joy St. Averages Subject
Date Sold 12/2017 Pending 03/2019 10/2018 06/2020    
Sale Price $8 million $14 million $25 million $63.8 million $25.5 million $27.3 million $7,050,000
Building Size (SF) 190,772 292,400 287,570 201,417 81,000 210,632 430,051
$/SF $42 $47 $87 $317 $315 $162 $16
Occupancy 100% 86.5% 79.8% 99% 100% 93.1% 80.3%
Location Manchester, NH Ashland, MA Medford, MA Watertown, MA Somerville, MA   Lawrence, MA

Sale and lease comps were obtained from Manzo Freeman Development.
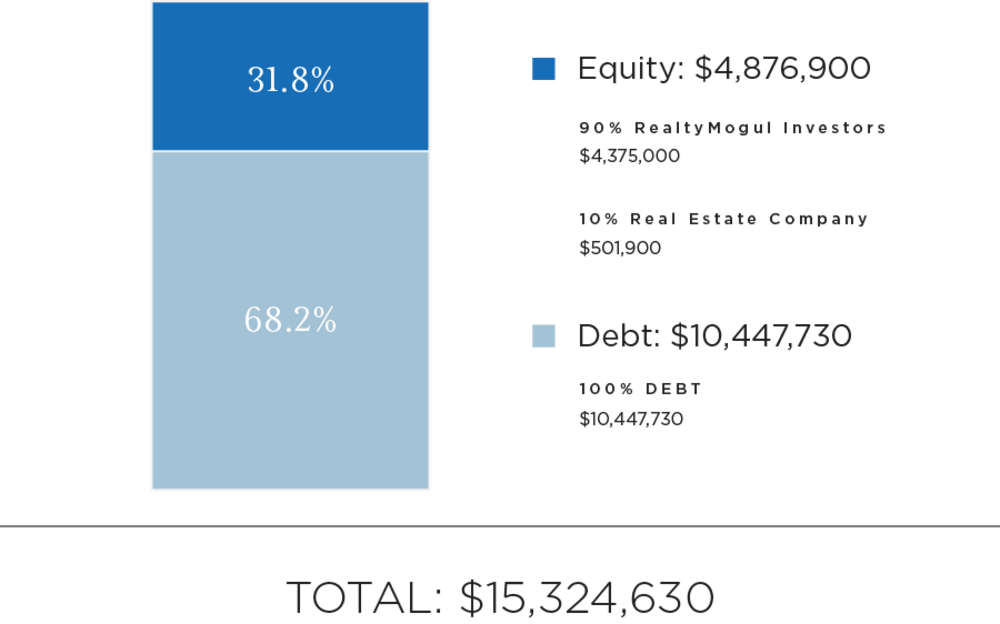
Market Overview

The Boston industrial market entered the coronavirus pandemic with sound fundamentals. The market was experiencing some of the lowest vacancies in history, coupled with steady demand and rent growth. Leasing velocity slightly declined throughout 2020 when compared to recent years, but several industrial users have continued to take space.

One of them is Amazon, which continues to lease at a historic pace in Boston and across the country. While consumer spending is on a gradual climb back to pre-pandemic levels, many have shifted to online shopping, which has steadily increased the need for distribution and warehouse space. Amazon leased nearly 600,000 square feet in the Boston metro and close to 2 million across the state in 2020. As online sales rise, Amazon is likely to sign on for even more space in the near-term and Boston will continue to be a landing spot for e-commerce occupiers.

Boston's industrial market has also benefited from the heightened growth of the life sciences industry. Even as the pandemic has halted activity in the office market, biotech companies continue to lease up space, driving the need for pharmaceutical manufacturing. And as tensions with China persist, many manufacturing jobs within the industry may return to the United States and Boston alike, which would provide further industrial demand in the long run.

Overall construction remains limited in Boston, as the market has nearly 3.2 million SF underway, 60% of which remains available for lease. Boston has notably diminished its industrial inventory over the past decade as many buildings have either been demolished or converted for multifamily use. This could prevent further vacancy expansion as new industrial product delivers over the course of the coming year.

Healthy fundamentals have paved the way for increased investor interest in recent years. The industrial market continued to make headlines with roughly $4.1 billion trading hands in 2020. However, similar to the office and retail sectors, volume significantly dropped off in the third quarter.

Submarket Overview

Lawrence/Andover is a very large submarket, containing roughly 29.5 million square feet of industrial space.

The recent instability hasn't made a huge impact on the vacancy rate, although vacancies (4.5%) have ticked up slightly over the past twelve months. Annual net absorption came in at a decrease of 330,000 SF over the past year. The story improves over a longer timeframe: Over the past five years, the submarket has posted net absorption of about 280,000 SF per year, on average.

Rents grew at a strong clip of 5.1% over the past year. While undoubtedly a solid result, this does represent the weakest rent growth observed in Lawrence/Andover in several years.

There are no supply-side pressures on vacancy or rent in the near-term, as nothing is underway. Moreover, the inventory has actually contracted over the past 10 years, as demolition activity has outpaced new construction.

Industrial properties traded with regularity last year, consistent with the generally high level of activity over the past three years.

Downtown Lawrence, MA Area Attributes

Centrally located north of Boston, Lawrence, MA is highly accessible to major cities in the area as well as Downtown Boston via immediate access to I-495/93 and commuter rail.

The Everett Mill is a transit-oriented property that is strategically well-located and positioned to leverage its locational attributes catering to local, regional and national businesses seeking cost-efficient office and industrial/flex space as well as the ability to draw on large and diverse labor pool and customer base within Massachusetts and New Hampshire.

Lawrence’s locational attributes are presently driving its position as an attractive urban center that is witnessing strong growth in both commercial as well as residential uses with the revitalization of its mill buildings. Continued strong demand for housing is driving conversion of mill buildings to new residential construction with thousands of additional units, which is further enhancing the City's economic strength and employment base while also reducing the availability of mill building space for industrial and office use, ultimately pushing office and flex rents higher and vacancy rates lower. Riverwalk (a mill building complex across the river from the Property) represents a “proof of concept” example that is demonstrating high occupancy and rents from an impressive array of commercial and residential tenants. 

The appeal of Lawrence, and the surrounding area, has attracted major real estate investors/owners including Seyon Capital, Lupoli Companies, KS Partners, Spear Street Capital, Contrarian Capital Management, Oaktree Capital Management, W.P Carey, Carter Validus, Atlantic Management Corporation, Malcolm Brawn, Sun Life Assurance Company, and Menlo Equities.

Sources: Manzo Freeman Development and CoStar

Financials
Total Capitalization
Sources of Funds Amount
Debt $10,447,730
Equity $4,876,900
Total Sources of Funds $15,324,630
Uses of Funds Amount
Purchase Price $7,050,000
Acquisition Fee $180,000
Loan Costs $230,000
CapEx (Including Contingency) $3,275,000
Brokerage and Disposition Fees $145,000
Legal and Closing Costs(1) $674,400
Working Capital and Pre-Paid Expenses $200,000
Tenant Improvement and Leasing Commission Reserves $3,570,230
Total Uses of Funds $15,324,630

Please note that Manzo Freeman Development's equity contribution may consist of friends and family equity and equity from funds controlled by Manzo Freeman Development. Additionally, the numbers represented above can change prior to closing depending on final loan proceeds, property condition assessments, appraisals, final closing costs, and other lender-mandated expenses.

(1) RM Technologies operates the RealtyMogul platform. RM Technologies charges a fixed, non-percentage-based fee for real estate companies to use the marketplace. An estimate of this fee is included in the Closing Costs and is intended to be capitalized into the transaction at the discretion of the Manager.

The expected terms of the debt financing are as follows:

  • Initial Loan Amount: $3,877,500
  • Future Funded Loan Amount: $6,570,230
  • Total Estimated Proceeds: $10,447,730
  • Estimated Annual Interest Rate (Fixed): 4.05%
  • Term: 5 years
  • Interest Only: 2 years

There can be no assurance that a lender will provide debt on the rates and terms noted above, or at all. All rates and terms of the debt financing are subject to lender approval, including but not limited to possible increases in capital reserve requirements for funds to be held in a lender-controlled capital reserve account.

Manzo Freeman Development intends to make distributions from EM Union Realty, LLC to EM Union Member, LLC as follows:

Operating Cash Flows:

  1. To the Members, pari passu, all operating cash flows to a 10.0% preferred return;
  2. 75% / 25% (75% to Members / 25% to Promote) of excess operating cash flows. 

Capital Events:

  1. To the Members, pari passu, to a return of capital and a 10.0% IRR;
  2. 75% / 25% (75% to Members / 25% to Promote) of excess cash flows to a 16.0% IRR; 
  3. 55% / 45% (55% to Members / 45% to Promote) of excess cash flows and appreciation thereafter.  

EM Union Realty, LLC intends to make distributions to investors. Note that all distributions will occur after the payment of both company's liabilities (loan payments, operating expenses, and other fees as set forth in the LLC agreements, in addition to any member loans or returns due on member loan).

Distributions are expected to start in November 2021 and are projected to continue on a quarterly basis thereafter. These distributions are at the discretion of Manzo Freeman Development, who may decide to delay distributions for any reason, including maintenance or capital reserves. Manzo Freeman Development will receive a promote as indicated above, and a portion of this promote may be received by RM Admin, LLC for administrative services.

CASH FLOW SUMMARY
  Year 1 Year 2 Year 3 Year 4 Year 5
Effective Gross Revenue $2,563,638 $2,497,844 $3,178,241 $3,467,588 $3,487,549
Total Operating Expenses $1,760,796 $1,836,014 $1,915,472 $1,979,967 $2,034,381
Net Operating Income $802,842 $661,830 $1,262,769 $1,487,621 $1,453,168

EM Union Member, LLC (ASSUMING A $4,375,000 TOTAL INVESTMENT)

  Year 0 Year 1 Year 2 Year 3 Year 4 Year 5
Investor-Level Cash Flows ($4,375,000) $455,044 $334,487 $444,981 $608,171 $7,037,808
Net Earnings to Investor - Hypothetical $50,000 Investment ($50,000) $5,201 $3,823 $5,085 $6,951 $80,432

Certain fees and compensation will be paid over the life of the transaction; please refer to Manzo Freeman Development's materials for details. The following fees and compensation will be paid(1)(2)(3):

One-Time Fees
Type of Fee Amount of Fee Received By Paid From Notes
Acquisition Fee $180,000 Manzo Freeman Development Capitalized Equity Contribution 2.05% of the purchase price of Everett + Stone Mills
Disposition Fee (Sale Brokerage Fee) $70,000 Manzo Freeman Development Capitalized Equity Contribution 4.0% of sale price of Stone Mill
Construction Management Fee $142,857 Manzo Freeman Development Total Capitalized Contribution 5.0% of capital improvements budget
Leasing Commissions $0.75 to $1.25/SF leased Manzo Freeman Development Total Capitalized Contribution and Distributable Cash Earned as new leases are signed and future funded by debt
  Recurring Fees
Type of Fee Amount of Fee Received By Paid From
Administrative Services Fee 1.0% of amount invested into EM Union Member, LLC RM Admin(3) Distributable Cash
Asset Management Fee 1.0% of amount invested into EM Union Member, LLC Manzo Freeman Development Distributable Cash
Property Management Fee 4.0% of Effective Gross Income Manzo Freeman Development Distributable Cash

(1) Fees may be deferred to reduce impact to investor distributions

(2) RM Technologies operates the RealtyMogul platform. RM Technologies charges a fixed, non-percentage-based fee for real estate companies to use the marketplace. An estimate of this fee is included in the Closing Costs and is intended to be capitalized into the transaction at the discretion of the Manager.

(3) RM Admin will be providing the following services:(a) responding to inbound investor inquiries regarding how to subscribe to the Project, (b) distribution of all annual tax forms (after receipt of same from Project Sponsor), (c) processing distributions that are payable from EM Union Member, LLC to Investors, however, RM Admin will not be deemed to have custody of client funds, (d) distribution of all quarterly reports (after receipt of same from Project Sponsor) and (e) summarizing sponsor information on property performance, responding to investor inquiries regarding sponsor performance information as well as the real estate market generally.

Disclaimers

The content on this detail page was provided by the Sponsor or an affiliate thereof. The Sponsor is under no obligation to update this detail page. None of the opinions expressed on this detail page are the opinions of RealtyMogul and they are not endorsed by RealtyMogul. Assumptions and projections included in this detail page are not reflective of the position of RealtyMogul or any other person or entity other than the Sponsor’s investment vehicle (“Investment Entity”) or its affiliates.

The preceding summary of principal terms of the offering is qualified in its entirety by reference to the more complete information about the offering contained in the offering documents, including, without limitation, the Private Placement Memorandum, Operating Agreement, Subscription Agreement and all exhibits and other documents attached thereto or referenced therein (collectively, the "Investment Documents"). This summary is not complete, and each prospective investor should carefully read all of the Investment Documents and any supplements thereto, copies of which are available by clicking the links above or upon request, before deciding whether to make an investment. In the event of an inconsistency between the preceding summary and the Investment Documents, investors should rely on the content of the Investment Documents.

There can be no assurance that the methodology used for calculating targeted IRR is appropriate or adequate. Target IRR is presented solely for the purpose of providing insight into the Investment Entity’s investment objectives, detailing its anticipated risk and reward characteristics and for establishing a benchmark for future evaluation of the Investment Entity’s performance. Targeted IRR is not a predictor, projection or guarantee of future performance. There can be no assurance that the Investment Entity’s targets will be met or that the Investment Entity will be successful in identifying and investing in investment opportunities that would allow the Investment Entity to meet these return parameters. Target returns should not be used as a primary basis for an investor’s decision to invest in the Investment Entity. Please see the applicable Investment Documents for disclosure relating to forward-looking statements.

All forward–looking statements attributable to the Sponsor or persons acting on its behalf apply only as of the date of the offering and are expressly qualified in their entirety by the cautionary statements included elsewhere in this summary and the Investment Documents. Any financial projections are preliminary and subject to change; the Sponsor undertakes no obligation to update or revise these forward–looking statements to reflect events or circumstances that arise after the date made or to reflect the occurrence of unanticipated events. Inevitably, some assumptions will not materialize, and unanticipated events and circumstances may affect the ultimate financial results. Projections are inherently subject to substantial and numerous uncertainties and to a wide variety of significant business, economic and competitive risks, and the assumptions underlying the projections may be inaccurate in any material respect. Therefore, the actual results achieved may vary significantly from the forecasts, and the variations may be material.

The interests in the Investment Entity will not be registered under the Securities Act of 1933, as amended (the “Securities Act”) in reliance upon exemptions contained in Rule 506(b) or 506(c) of Regulation D as promulgated under the Securities Act. In addition, the interests will not be registered under any state securities laws in reliance on exemptions from registration. Such interests are subject to restrictions on transferability and resale and may not be transferred or resold except as permitted under applicable state and federal securities laws pursuant to registration or an available exemption.

All investing activities risk the loss of capital. There can be no assurance that investors will not suffer significant losses. No guarantee or representation is made that investment objectives of the Investment Entity will be achieved. You should not subscribe to purchase interests in the Investment Entity unless you can readily bear the consequences of such loss.

Interests in the Investment Entity are listed on the RealtyMogul Platform. RealtyMogul receives fees from the Sponsor or the Investment Entity partially based on the number of investors investing in such Investment Entity through the RealtyMogul Platform. This arrangement could create a conflict of interest between RealtyMogul and investors.

INVEST TODAY

...

Questions?

(877) 781-7062

Contact Investor Relations
Staff Menu (IO ID#: 1492486):
EDIT IO DOCUMENTS
Staff Menu (IO ID#: 1492486):
EDIT IO DOCUMENTS
JOIN REALTYMOGUL
Create an account or sign in.
Are you an Accredited Investor?
Password should be at least 8 characters, contain an uppercase character, a lowercase character, a number and a symbol.
By clicking "JOIN REALTYMOGUL" you are agreeing to our Terms of Service and Privacy Policy.
SIGN IN
Don’t have an account yet? Join RealtyMogul.
Forgot Password?
Questions? Our Investor Relations team is available to help 8 AM - 6 PM PST Monday to Friday. Contact us at (877) 977-2776.
Forgot Password
Enter your email address to receive a code to reset your password.
Enter the code sent to your email address below and your new password.

Resend Code

WELCOME
Welcome,

Welcome to RealtyMogul. Please answer the questions below to help us complete your Investor Profile.

Your Net Worth
$2,250,000
$0
$10M+
Thank you!

We’ve received your Net Worth information and updated your Investor Profile.