


Spirit Bascom Ventures is a co-sponsorship joint venture between The Bascom Group and Spirit Investment Partners that invests in opportunistic and value-add multifamily throughout the eastern half of the United States.
Spirit Investment Partners (www.spiritinvestors.com) is a Connecticut-based real estate investment and development company, owned and operated by principals David Nachman, Scott Zwilling, and Ian Hafner. The company owns and operates a portfolio of multifamily assets ranging from New England to Florida, the Midwest and California. Spirit has closed over $350 million in transactions since inception, with over $40 million in renovations currently in process.
The Bascom Group (www.bascomgroup.com) is one of the most active and seasoned buyers and operators of apartment communities in the United States. Formed in 1996 by Jerome Fink, Derek Chen, and David Kim, The Bascom Group is a private equity firm that specializes in multifamily, commercial, non-performing loans, and real estate related investments and operating companies. The company has owned over 196 multifamily properties and 52,000 units (as of November 2015). In 2016, Bascom was awarded the prestigious Ernst & Young Entrepreneur Of The Year award.
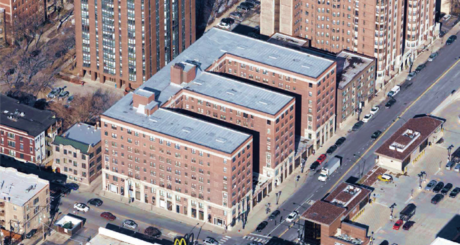
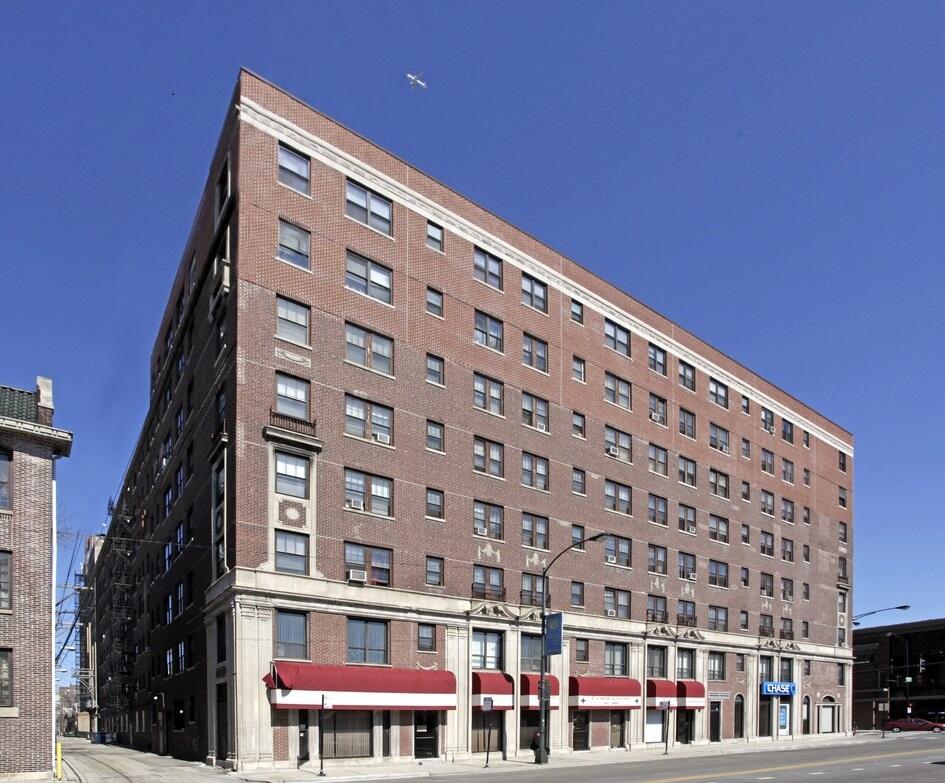
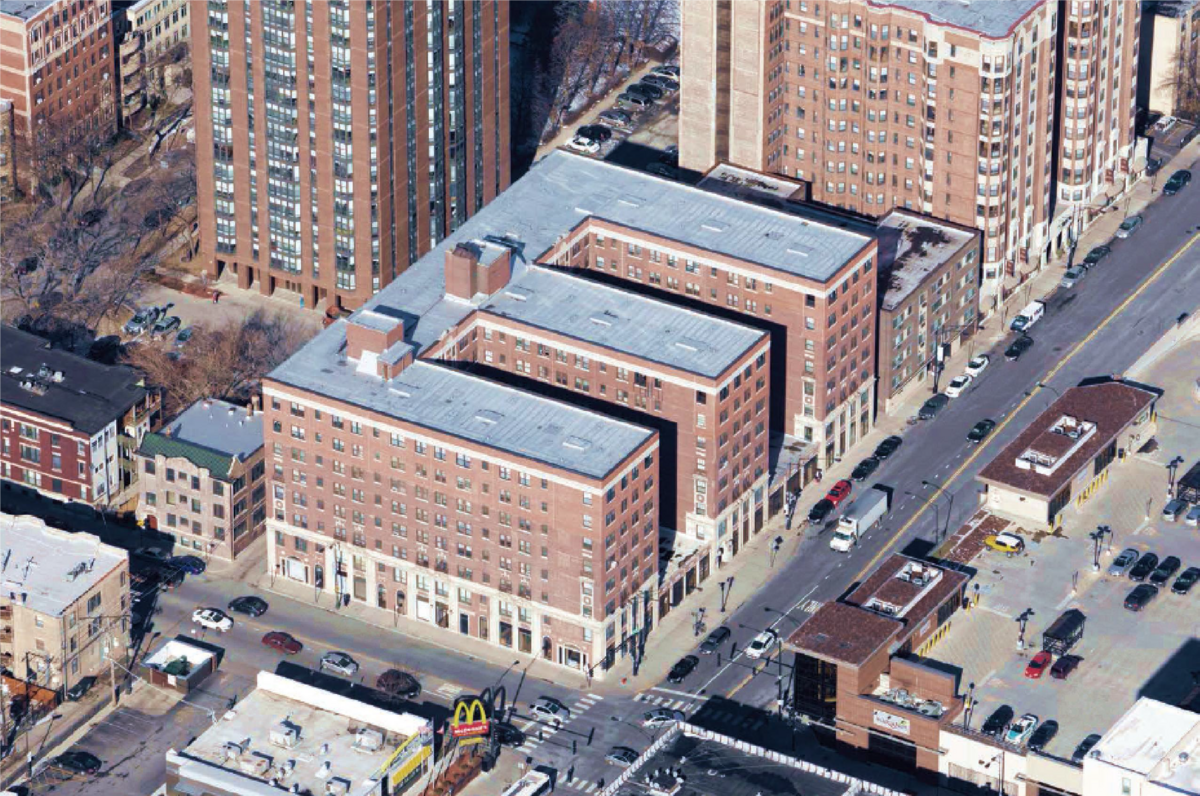
Sheridan-Edgewater Apartments is a 223-unit mid-rise apartment building with approximately 25,000 square feet of ground-floor retail space. Currently 97% occupied, the nine foot ceiling apartments are a mix of studio (49%), one-bedroom (49%), and two-bedroom (2%) units. Approximately 40% of the units have unobstructed and protected views of Lake Michigan. The first floor commercial space has been strategically vacated by the previous owners so that new ownership can re-purpose the space for new specialty commercial tenancy, parking, or additional amenities.
Originally built as an Art Deco luxury hotel in the 1920s, the eight-story building features classic design elements such as detailed exterior limestone ornamentation, terracotta tiled flooring, arched and Moorish style doorways with Solomonic columns, thick crown moldings and coffered ceilings. Although the units and current amenities are dated, some capital improvements have been performed at the property over the last six years including roof replacement, eighth floor window replacement, tuck-pointing and partial reconstruction of the façade.
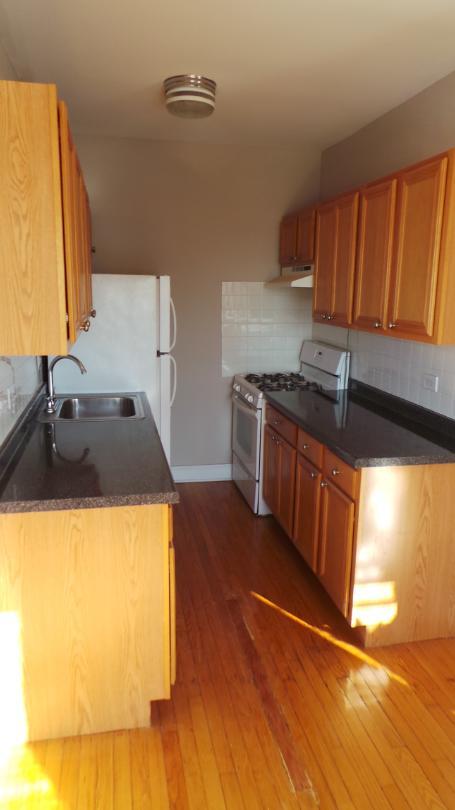
Current community amenities include a common area laundry room, a fitness center, and a doorman. Unit finishes are typical of a Class B/B- property including linoleum countertops, oak cabinetry, and lower cost appliances and hardware. More marketable features of the current units are nine foot ceilings, real hardwood floors, and good natural light through large windows.
| Rent Comparables | ||||||||||
| Studio | 1 x 1 | 2 x 1 | 2 x 2 | |||||||
| Property | Dist. From Subj. | Built | Rents | PSF | Rents | PSF | Rents | PSF | Rents | PSF |
| Renovated | ||||||||||
| Somerset Place | 0.22 | 1920 | $1,350 | $2.74 | $2,100 | $2.51 | - | - | $2,170 | $2.20 |
| Uptown Regency | 0.14 | 1924 | - | - | $1,275 | $2.04 | $1,573 | $2.17 | - | - |
| Pensacola Place | 1.08 | 1982 | $1,288 | $2.30 | $1,560 | $1.86 | $1,870 | $1.82 | - | - |
| The Belmont by Reside | 2.90 | 1967 | $1,489 | $3.88 | $1,809 | $2.47 | $2,230 | $2.09 | $2,810 | $2.27 |
| Average | 1958 | $1,355 | $2.81 | $1,650 | $2.24 | $1,916 | $1.90 | $2,635 | $2.25 | |
| Subject - Post Reno | 1920 | $1,042 | $2.70 | $1,625 | $2.41 | $1,850 | $2.06 | $1,995 | $1.48 | |
| Variance | -23% | -4% | -2% | 7% | -3% | 8% | -24% | -34% | ||
| Unrenovated | ||||||||||
| The Wyndham | 0.10 | 1927 | $987 | $2.02 | $1,087 | $1.58 | - | - | - | - |
| Sheridan Towers | 0.60 | 1962 | $998 | $1.65 | $1,295 | $1.62 | - | - | $1,575 | $1.58 |
| The Sovereign | 1.30 | 1920 | $755 | $1.51 | $1,050 | $1.53 | $1,205 | $1.26 | - | - |
| Average | 1936 | $906 | $1.69 | $1,094 | $1.56 | $1,205 | $1.26 | $1,575 | $1.58 | |
| Subject - Un-reno | 1920 | $714 | $1.85 | $892 | $1.32 | $1,040 | $1.16 | $1,180 | $0.87 | |
| Variance | -21% | 10% | -18% | -15% | -14% | -8% | -25% | -45% | ||
| Sales Comparables | ||||||||
| Property | Dist. From Subj. | Built | Renovated | Stories | Units | Sale Date | Sale Price | Price / Unit |
| Elaine Place | 2.31 | 1924 | 2012 | 3 | 174 | Jun-15 | $50,500,000 | $290,230 |
| Pensacola Place | 1.08 | 1981 | 2008 | 18 | 264 | Apr-15 | $65,750,000 | $249,053 |
| 5731-5733 N Winthrop | 0.68 | 1887 | 1906 | 4 | 35 | Apr-15 | $10,500,000 | $300,000 |
| 4641 N Paulina | 1.05 | 1930 | - | 3 | 48 | Feb-15 | $5,800,000 | $120,833 |
| Atrium Village | 5.17 | 1978 | - | 9 | 309 | Jun-14 | $50,000,000 | $161,812 |
| Andersonville Apts | 0.61 | 1916 | - | 3 | 30 | Mar-14 | $5,225,000 | $174,167 |
| Park Lincoln | 3.48 | 1969 | 2000 | 15 | 139 | Jan-14 | $15,500,100 | $111,512 |
| 4739 N Hermitage Ave | 1.05 | 1932 | 2013 | 4 | 38 | Jan-14 | $5,375,000 | $141,447 |
| Total / Average | 1940 | 130 | $26,081,263 | $201,205 | ||||
| Subject | 1920 | 8 | 223 | Nov-15 | $21,600,000 | $96,861 | ||
| Subject Total Cost Basis | $39,030,613 | $175,025 | ||||||
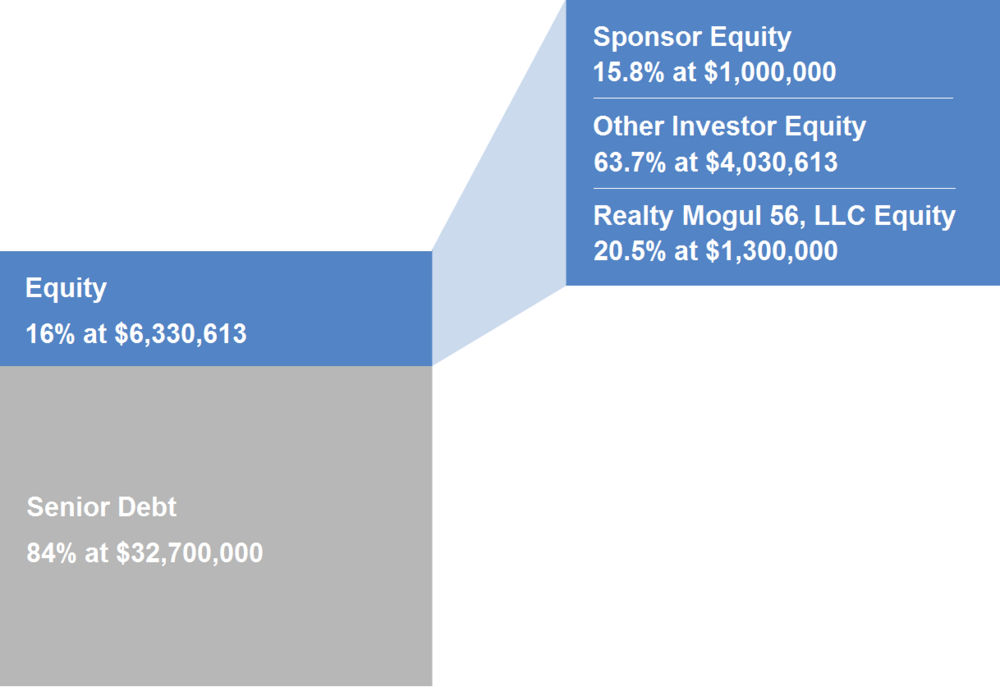
| Total Capitalization | ||
| Senior Loan | $32,700,000 | |
| Equity | 6,330,613 | |
| Total Sources of Funds | $39,030,613 | |
| Purchase Price | $21,600,000 | |
| CapEx | 14,014,435 | |
| Closing Costs | 692,784 | |
| Working Capital | 613,000 | |
| Interest Reserve | 1,182,000 | |
| Acquisition Fee | 356,144 | |
| Loan Broker Fees | 245,250 | |
| Senior Loan Fees | 327,000 | |
| Total Uses of Funds | $39,030,613 | |
- Lender: MidCap Financial
- Principal Balance: $32,700,000
- Term: 48 Months, with a 12 month extension option
- Rate: Floating, 525 basis points over 30-day LIBOR. Borrower has purchased 2.25% interest rate cap for the 4 yr term
- Amortization: Interest only for term of loan. Extension option is amortized over 30 years
- Prepayment Penalty: The loan can be paid off any time subject to the Lender earning 24 months of interest
- Recourse: Non-recourse except a completion guaranty provided by the Managing Member of the Borrower.
North Sheridan Property Investor, LLC will make distributions to Realty Mogul 56, LLC per the priority order below. Realty Mogul 56, LLC will distribute 100% of its share of excess cash flow (after expenses) to the members of Realty Mogul 56, LLC (the RealtyMogul.com investors). The manager of Realty Mogul 56, LLC will receive a portion (up to 10%) of the Sponsor's promoted interest.
Order of Distributions to Realty Mogul 56, LLC (Operating Cash Flow)
- First, to the Members to pay a 10% cumulative non-compounded annual return;
- Second, 70% to the Members pro-rata and 30% to the Managing Member until cumulative distributions to each Member equal a 15% cumulative non-compounded annual return; and
- Thereafter, 60% to the Members pro rata and 40% to the Managing Member.
Order of Distributions to Realty Mogul 56, LLC (Refinance, and Sales Proceeds)
- First, to the Members to pay a 10% cumulative non-compounded annual return;
- Second, to the Members pro rata until all capital contributions have been returned
- Third, 70% to the Members pro-rata and 30% to the Managing Member until cumulative distributions to each Member equal a 15% cumulative non-compounded annual return; and
- Thereafter, 60% to the Members pro rata and 40% to the Managing Member.
Distributions are projected to start in March of 2018 and are projected to continue on a quarterly basis thereafter. These distributions are at the discretion of the Sponsor, who may decide to delay distributions for any reason, including maintenance or capital reserves.
| Year 1 | Year 2 | Year 3 | |
|---|---|---|---|
| Effective Gross Revenue | $1,678,666 | $2,772,593 | $3,782,015 |
| Total Operating Expenses | ($1,245,376) | ($1,297,811) | ($1,552,329) |
| Interest Reserve Release | $741,835 | $180,091 | $0 |
| Net Operating Income (including Interest Reserve) | $1,175,125 | $1,654,873 | $2,229,686 |
| Distributions to Realty Mogul 56, LLC Investors | $0 | $0 | $2,333,432 |
Certain fees and compensation will be paid over the life of the transaction. The following fees and compensation will be paid:
| Type of Fee | Amount of Fee | Received By | Paid From | Notes |
| One-Time Fees: | ||||
|---|---|---|---|---|
| Acquisition Fee | 1.0% | Sponsor | Capitalized Equity Contribution (Already Paid) | 1.0% purchase price plus hard costs |
| Broker-Dealer Fee | 4.0% | North Capital(1) | Capitalized Equity Contribution | 4.0% based on the amount of equity invested by Realty Mogul 56, LLC |
| Construction Management Fee | 5.0% | Sponsor |
Capitalized Equity Contribution |
5.0% of total hard costs |
| Recurring Fees: | ||||
| Property Management Fee | 2.75% | Third Party Property Manager | Operating Cash Flow | 2.75% of Effective Gross Income |
| Asset Management Fee | 0.5% | Sponsor | Operating Cash Flow | 0.5% of Effective Gross Income |
| Management and Administrative Fee | 2.0% |
RM Manager, LLC | Distributable Cash |
2.0% of amount invested in Realty Mogul 56, LLC. RM Manager, LLC is the Manager of Realty Mogul 56, LLC and a wholly-owned subsidiary of Realty Mogul, Co.(2) |
Notes:
(1) Certain employees of Realty Mogul, Co. are registered representatives of, and are paid commissions by, North Capital Private Securities Corp., a Delaware corporation ("North Capital"). In addition, North Capital pays a technology provider services fee to Realty Mogul, Co. for licensing and access to certain technology, reporting, communications, branding, entity formation and administrative services performed from time to time by Realty Mogul, Co., and North Capital and Realty Mogul, Co. are parties to a profit sharing arrangement.
(2) Fees may be deferred to reduce impact to investor distributions
The above presentation is based upon information supplied by the Sponsor or others. Realty Mogul, Co., RM Manager, LLC, and Realty Mogul 56, LLC, along with their respective affiliates, officers, directors or representatives (the "RM Parties") hereby advise you that none of them has independently confirmed or verified any of the information contained herein. The RM Parties further make no representations as to the accuracy or completeness of any such information and undertake no obligation now or in the future to update or correct this presentation or any information contained herein.
The information on this Page is qualified in its entirety by reference to the more complete information about the offering contained in the Sponsor’s Investment Documents. The information on this Page is not complete and subject to change at the Sponsor’s discretion at any time up to the closing date. The Sponsor’s Investment Documents and supplements thereto contain important information about the Sponsor’s offering including relevant investment objectives, the business plan, risks, charges, expenses, and other information, which you should consider carefully before investing. The information on this Page should not be used as a basis for an investor’s decision to invest.
Risk of InvestmentThis investment is speculative, highly illiquid, and involves substantial risk. There can be no assurances that all or any of Sponsor’s assumptions, expectations, estimates, goals, hypothetical illustrations, or other aspects of Sponsor’s business plans (“Assumptions”) will be true or that actual performance will bear any relation to Sponsor’s Assumptions, and no guarantee or representation is made that Sponsor’s Assumptions will be achieved. If Sponsor does not achieve its Assumptions, your investment could be materially and adversely affected. A loss of part or all of the principal value of your investment may occur. You should not invest unless you can readily bear the consequences of such loss. Sponsor’s Assumptions should not be relied upon as the primary basis for your decision to invest.
No Reliance on Forward-Looking Statements; Sponsor AssumptionsSponsor is solely responsible for statements made concerning forward-looking statements and Assumptions, which apply only as of the date made, are preliminary and subject to change, and are expressly qualified in their entirety by the disclosures and cautionary statements included in Sponsor’s Investment Documents, which you should carefully review. Sponsor is obligated to update or revise such forward-looking statements or Assumptions to reflect events or circumstances that arise after the date made or to reflect the occurrence of unanticipated events. Sponsor’s forward-looking statements and Assumptions are hypothetical, not based on actual investment achievements or events, and are presented solely for purposes of providing insight into the Sponsor’s investment objectives, detailing Sponsor’s anticipated risk and reward characteristics, and establishing a benchmark for future evaluation of actual results; therefore, they are not a predictor, projection, or guarantee of future results. You should not rely on Sponsor’s forward-looking statements as a basis to invest.
Importantly, we do not adopt, endorse, or provide any assurance of returns or as to the accuracy or reasonableness of Sponsor’s Assumptions or forward-looking statements.
No Reliance on Past PerformanceAny description of past performance is not a reliable indicator of future performance and should not be relied upon as the primary basis to invest.
Sponsor’s Use of DebtA substantial portion of the total cost of the real estate asset acquired by the Sponsor with investor funds (“Property”) will be paid with borrowed funds, i.e., debt. Sponsor’s estimated rates and terms of the debt financing are subject to lender approval, and there is no assurance that the Sponsor will secure debt at the rates and terms presented on this Page or in the Sponsor’s Investment Documents, or at all. The use of borrowed money to acquire real estate is referred to as leveraging, which can amplify losses and could result in lender foreclosure. In addition, if the debt includes a variable (or “floating”) interest rate, the total amount of interest paid over the term of the debt will fluctuate and can increase. As a result, Sponsor’s use of debt can result in a loss of some or all of your investment.
Sponsor’s Offering is Not RegisteredSponsor’s securities offering will not be registered under the Securities Act of 1933, as amended (the “Securities Act”), in reliance upon the exemptions from registration pursuant to Rule 506(c) of Regulation D as promulgated under the Securities Act (“Private Placement”). In addition, the offering will not be registered under any state securities laws in reliance on exemptions from state registration. Such securities (your ownership interests) are subject to restrictions on transferability and resale and may not be transferred or resold except as permitted under applicable state and federal securities laws pursuant to registration or an available exemption. All Private Placements on the Platform are intended solely for “Accredited Investors,” as that term is defined in Rule 501(a) under the Securities Act.
No Investment AdviceNothing on this Page should be regarded as investment advice (either with respect to a particular security or regarding an overall investment strategy), a recommendation, an offer to sell, or a solicitation of or an offer to buy any security. Advice from a securities professional is strongly advised to understand and assess the risks associated with real estate or private placement investments.
1031 Exchange RiskInternal Revenue Code Section 1031 (“Section 1031”) contains complex tax concepts and certain tax consequences may vary depending on the individual circumstances of each investor. You should consult with and rely on your own tax advisor about the tax aspects with respect to your particular circumstances.