


Founded in 2017, SB Real Estate Partners (“SBREP”) is a multifamily investment firm committed to acquiring and asset managing value add investments throughout the Western United States. With an extensive track record in the institutional multifamily space, SBREP consistently sources compelling investment opportunities with the goal of maximizing value and risk adjusted returns for their partners.
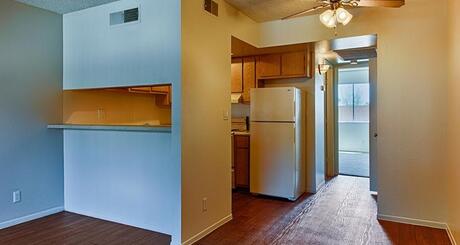
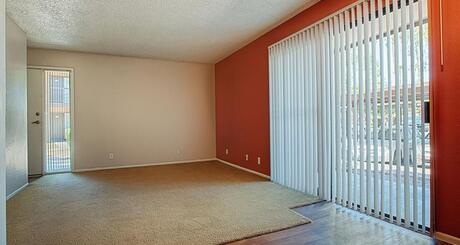
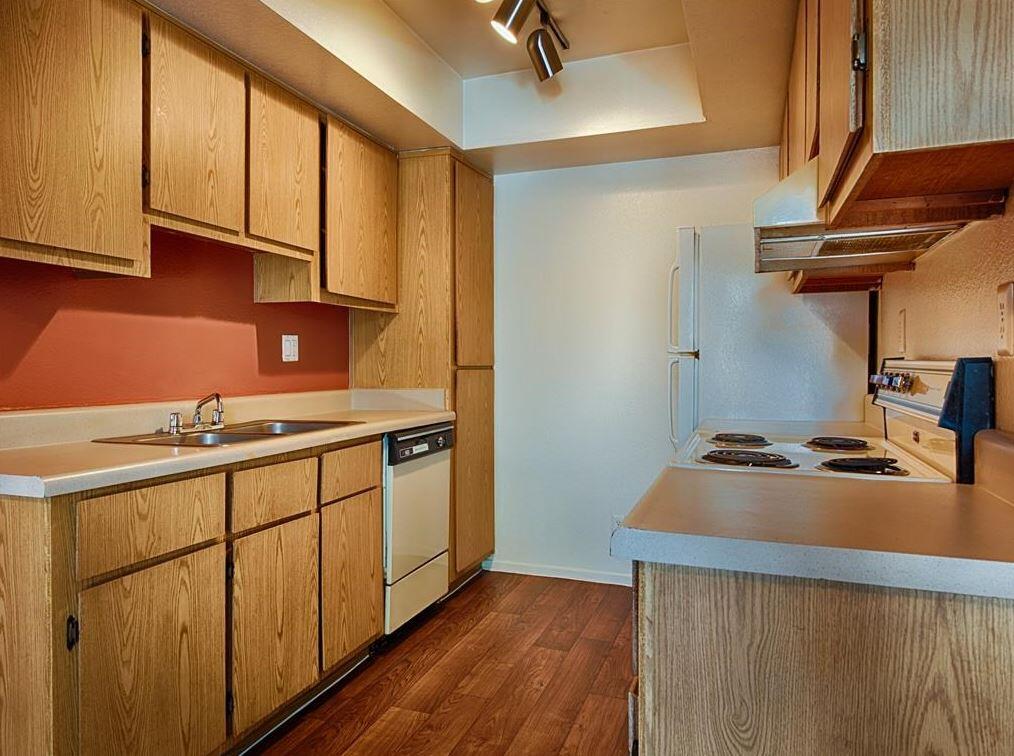
SB Real Estate Partners (“SBREP”) is currently under contract to purchase Casa Anita Apartments for $35.3 million and is underwriting to investor level returns of 15.8% IRR / 1.7x equity multiple over a four-year hold, with average cash-on-cash returns of 5.9%. The seller is an out-of-state family that has owned the property for almost twenty years and has maintained a conservative leasing strategy. The unit mix consists primarily of 2x2 floor plans averaging 980 SF. SBREP currently owns Cordova Apartments, which is located one mile east of Casa Anita, and is leasing smaller 2x2 floor plans of equivalent condition/finishes at over $1,150/unit (more than $300 above Casa Anita). As a result, there is an opportunity to substantially renovate, rebrand, and reposition the property in order to bring rents closer to surrounding comparable properties.
In-Place/Stabilized Unit Mix:
| Unit Type | # of Units | % of Total | Average SF/Unit | Avg Rent (In-Place) | Avg Rent (Post-Reno) | Post-Reno Rent per SF |
| 1x1 | 72 | 32% | 709 | $779 | $1,010 | $1.42 |
| 2x2 | 152 | 68% | 978 | $864 | $1,265 | $1.29 |
| Total/Averages | 224 | 100% | 892 | $837 | $1,183 | $1.34 |
| Del Mar Apartments | Broadstone Desert Sky | Sunpointe Apartments | Ventana Palms | Cordova Apartments | Morada West | Marble Creek | Averages | Subject (Post-Reno Rents) | |
|---|---|---|---|---|---|---|---|---|---|
| Year Built | 2008 | 2007 | 1984 | 1989 | 1985 | 1998 | 1985 | 1994 | 1986 |
| # of Units | 144 | 288 | 152 | 160 | 320 | 428 | 244 | 248 | 224 |
| Class | B | B | C | B | C | B | B | B | |
| $/Unit (1x1) | $1,115 | $1,147 | $1,038 | $948 | $857 | $1,065 | $953 | $1,018 | $1,010 |
| SF (1x1) | 819 SF | 799 SF | 649 SF | 740 SF | 625 SF | 717 SF | 720 SF | 724 SF | 709 SF |
| $/SF (1x1) | $1.36 | $1.44 | $1.60 | $1.28 | $1.37 | $1.49 | $1.32 | $1.41 | $1.42 |
| $/Unit (2x2) | $1,315 | $1,462 | $1,313 | $1,226 | $1,148 | $1,265 | $1,215 | $1,278 | $1,265 |
| SF (2x2) | 1,127 SF | 1,118 SF | 917 SF | 950 SF | 880 SF | 952 SF | 1,000 SF | 992 SF | 978 SF |
| $/SF (2x2) | $1.17 | $1.31 | $1.43 | $1.29 | $1.30 | $1.33 | $1.22 | $1.29 | $1.29 |
| Distance from subject | 0.5 mi | 0.8 mi | 1.8 mi | 1.8 mi | 2.8 mi | 3.2 mi | 3.6 mi |
| Del Mar Apartments | Sunpointe Apartments1 | Cordova Apartments | Averages | Subject | |
|---|---|---|---|---|---|
| Date Sold | Feb 2020 | Under LOI | Oct 2020 | ||
| Year Built | 2008 | 1984 | 1985 | 1992 | 1986 |
| Class | B | C | C | B | |
| # of Units | 144 | 152 | 320 | 205 | 224 |
| Average Unit Size | 1,073 SF | 804 SF | 709 SF | 862 SF | 892 SF |
| Sale Price | $27,000,000 | $26,600,000 | $51,200,000 | $34,933,333 | $35,300,000 |
| $/Unit | $187,500 | $175,000 | $160,000 | $174,167 | $157,589 |
| $/SF | $185 | $218 | $215 | $206 | $177 |
| Building Size | 145,848 SF | 122,232 SF | 238,410 SF | ||
| Distance from subject | 0.5 mi | 1.8 mi | 2.8 mi |
Sale and lease comps were obtained from SB Real Estate Partners.
1 Reflects expected terms under LOI.
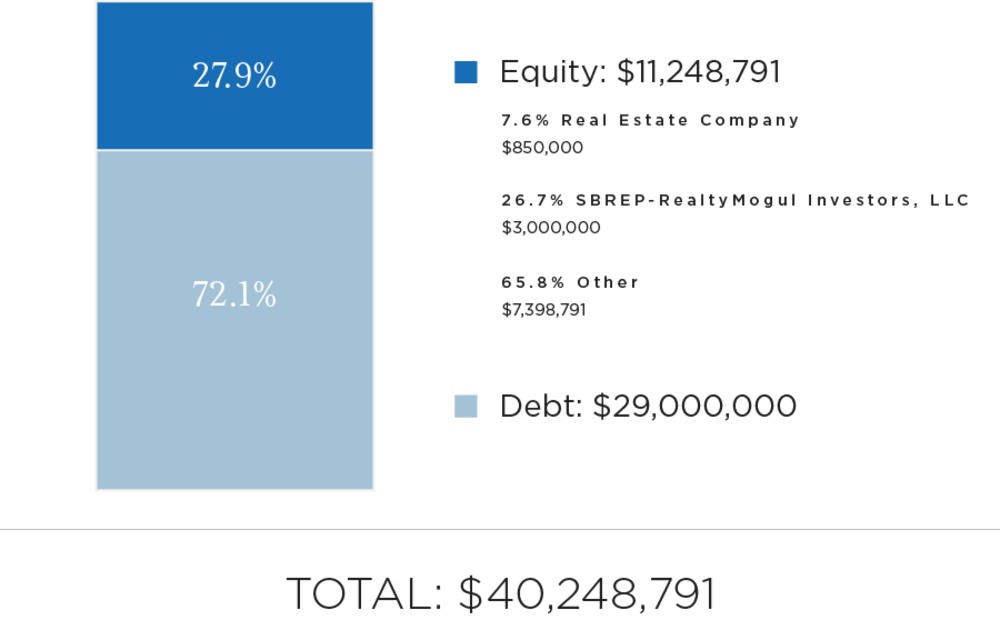
| Sources of Funds | Amount |
|---|---|
| Debt - Initial Proceeds | $25,245,309 |
| Debt - CapEx Proceeds | $3,754,691 |
| Equity | $11,248,791 |
| Total Sources of Funds | $40,248,791 |
| Uses of Funds | Amount |
| Purchase Price | $35,300,000 |
| Acquisition Fee | $244,667 |
| Loan Fee | $290,000 |
| CapEx | $3,754,691 |
| Closing Costs(1) | $534,433 |
| Working Capital | $125,000 |
| Total Uses of Funds | $40,248,791 |
Please note that the SB Real Estate Partners' equity contribution may consist of friends and family equity and equity from funds controlled by SB Real Estate Partners. Additionally, the numbers represented above can change prior to closing depending on final loan proceeds, property condition assessments, appraisals, final closing costs, and other lender-mandated expenses.
(1) RM Technologies operates the RealtyMogul platform. RM Technologies charges a fixed, non-percentage-based fee for real estate companies to use the marketplace. An estimate of this fee is included in the Closing Costs and is intented to be capitalized into the transaction at the discretion of the Manager.
The terms of the bridge loan are as follows:
- Estimated Proceeds: $29,000,000
- Interest Rate (Floating): SOFR plus 4.00%
- Term: 3 years
- Interest Only: 3 years
- Extension Options: Two (2) one-year extension options
The expected terms of the senior loan refinance are as follows:
- Estimated Proceeds: $31,200,000
- Origination Date: December 2022
- Estimated Rate (Floating): SOFR plus 3.00%
- Term: 10 years
- Interest Only: 5 years
There can be no assurance that a lender will provide debt on the rates and terms noted above, or at all. All rates and terms of the debt financing are subject to lender approval, including but not limited to possible increases in capital reserve requirements for funds to be held in a lender-controlled capital reserve account.
SB Real Estate Group intends to make distributions from SBREP-Casa Anita Owner, LLC to SBREP-RealtyMogul Investors, LLC as follows:
- To the Members, pari passu, all excess operating cash flows to an 8.0% preferred return.
- 70.0% / 30.0% (70.0% to Members / 30.0% to Promote) of excess cash flow and appreciation thereafter.
SBREP-Casa Anita Owner, LLC intends to make distributions to investors. Note that all distributions will occur after the payment of both company's liabilities (loan payments, operating expenses, and other fees as set forth in the LLC agreements, in addition to any member loans or returns due on member loan).
Distributions are expected to start in April 2021 and are projected to continue on a quarterly basis thereafter. These distributions are at the discretion of SB Real Estate Partners, who may decide to delay distributions for any reason, including maintenance or capital reserves.
| Year 1 | Year 2 | Year 3 | Year 4 | |
|---|---|---|---|---|
| Effective Gross Revenue | $2,427,115 | $2,768,459 | $3,213,88 | $3,756,427 |
| Total Operating Expenses | $1,072,668 | $1,109,846 | $1,151,000 | $1,196,043 |
| Net Operating Income | $1,354,447 | $1,658,614 | $2,062,881 | $2,563,374 |
| Year 0 | Year 1 | Year 2 | Year 3 | Year 4 | |
|---|---|---|---|---|---|
| Investor-Level Cash Flows | ($3,000,000) | $27,369 | $940,666 | $6,062 | $4,068,324 |
| Net Earnings to Investor - Hypothetical $50,000 Investment | ($50,000) | $456 | $15,678 | $101 | $67,805 |
Certain fees and compensation will be paid over the life of the transaction; please refer to SB Real Estate Partners' materials for details. The following fees and compensation will be paid(1)(2)(3):
| Type of Fee | Amount of Fee | Received By | Paid From | Notes |
|---|---|---|---|---|
| Acquisition Fee | $244,667 | SB Real Estate Partners | Capitalized Equity Contribution | |
| Construction Management Fee | 5.0% of CapEx drawn to date | SB Real Estate Partners | Capitalized Equity Contribution |
| Type of Fee | Amount of Fee | Received By | Paid From |
|---|---|---|---|
| Administrative Services Fee | 1.0% of amount invested into SBREP-RealtyMogul Investors, LLC | RM Admin(3) | Distributable Cash |
| Asset Management Fee | 1.0% of Effective Gross Income | SB Real Estate Partners | Distributable Cash |
(1) Fees may be deferred to reduce impact to investor distributions
(2) RM Technologies operates the RealtyMogul platform. RM Technologies charges a fixed, non-percentage-based fee for real estate companies to use the marketplace. An estimate of this fee is included in the Closing Costs and is intented to be capitalized into the transaction at the discretion of the Manager.
(3) RM Admin will be providing the following services:(a) responding to inbound investor inquiries regarding how to subscribe to the Project, (b) distribution of all annual tax forms (after receipt of same from Project Sponsor), (c) processing distributions that are payable from SBREP-RealtyMogul Investors, LLC to Investors, however, RM Admin will not be deemed to have custody of client funds, (d) distribution of all quarterly reports (after receipt of same from Project Sponsor) and (e) summarizing sponsor information on property performance, responding to investor inquiries regarding sponsor performance information as well as the real estate market generally.
The information on this Page is qualified in its entirety by reference to the more complete information about the offering contained in the Sponsor’s Investment Documents. The information on this Page is not complete and subject to change at the Sponsor’s discretion at any time up to the closing date. The Sponsor’s Investment Documents and supplements thereto contain important information about the Sponsor’s offering including relevant investment objectives, the business plan, risks, charges, expenses, and other information, which you should consider carefully before investing. The information on this Page should not be used as a basis for an investor’s decision to invest.
Risk of InvestmentThis investment is speculative, highly illiquid, and involves substantial risk. There can be no assurances that all or any of Sponsor’s assumptions, expectations, estimates, goals, hypothetical illustrations, or other aspects of Sponsor’s business plans (“Assumptions”) will be true or that actual performance will bear any relation to Sponsor’s Assumptions, and no guarantee or representation is made that Sponsor’s Assumptions will be achieved. If Sponsor does not achieve its Assumptions, your investment could be materially and adversely affected. A loss of part or all of the principal value of your investment may occur. You should not invest unless you can readily bear the consequences of such loss. Sponsor’s Assumptions should not be relied upon as the primary basis for your decision to invest.
No Reliance on Forward-Looking Statements; Sponsor AssumptionsSponsor is solely responsible for statements made concerning forward-looking statements and Assumptions, which apply only as of the date made, are preliminary and subject to change, and are expressly qualified in their entirety by the disclosures and cautionary statements included in Sponsor’s Investment Documents, which you should carefully review. Sponsor is obligated to update or revise such forward-looking statements or Assumptions to reflect events or circumstances that arise after the date made or to reflect the occurrence of unanticipated events. Sponsor’s forward-looking statements and Assumptions are hypothetical, not based on actual investment achievements or events, and are presented solely for purposes of providing insight into the Sponsor’s investment objectives, detailing Sponsor’s anticipated risk and reward characteristics, and establishing a benchmark for future evaluation of actual results; therefore, they are not a predictor, projection, or guarantee of future results. You should not rely on Sponsor’s forward-looking statements as a basis to invest.
Importantly, we do not adopt, endorse, or provide any assurance of returns or as to the accuracy or reasonableness of Sponsor’s Assumptions or forward-looking statements.
No Reliance on Past PerformanceAny description of past performance is not a reliable indicator of future performance and should not be relied upon as the primary basis to invest.
Sponsor’s Use of DebtA substantial portion of the total cost of the real estate asset acquired by the Sponsor with investor funds (“Property”) will be paid with borrowed funds, i.e., debt. Sponsor’s estimated rates and terms of the debt financing are subject to lender approval, and there is no assurance that the Sponsor will secure debt at the rates and terms presented on this Page or in the Sponsor’s Investment Documents, or at all. The use of borrowed money to acquire real estate is referred to as leveraging, which can amplify losses and could result in lender foreclosure. In addition, if the debt includes a variable (or “floating”) interest rate, the total amount of interest paid over the term of the debt will fluctuate and can increase. As a result, Sponsor’s use of debt can result in a loss of some or all of your investment.
Sponsor’s Offering is Not RegisteredSponsor’s securities offering will not be registered under the Securities Act of 1933, as amended (the “Securities Act”), in reliance upon the exemptions from registration pursuant to Rule 506(c) of Regulation D as promulgated under the Securities Act (“Private Placement”). In addition, the offering will not be registered under any state securities laws in reliance on exemptions from state registration. Such securities (your ownership interests) are subject to restrictions on transferability and resale and may not be transferred or resold except as permitted under applicable state and federal securities laws pursuant to registration or an available exemption. All Private Placements on the Platform are intended solely for “Accredited Investors,” as that term is defined in Rule 501(a) under the Securities Act.
No Investment AdviceNothing on this Page should be regarded as investment advice (either with respect to a particular security or regarding an overall investment strategy), a recommendation, an offer to sell, or a solicitation of or an offer to buy any security. Advice from a securities professional is strongly advised to understand and assess the risks associated with real estate or private placement investments.
1031 Exchange RiskInternal Revenue Code Section 1031 (“Section 1031”) contains complex tax concepts and certain tax consequences may vary depending on the individual circumstances of each investor. You should consult with and rely on your own tax advisor about the tax aspects with respect to your particular circumstances.