


Founded in 1997, Moonwater Capital (the "Real Estate Company") is a Las Vegas-based real estate investment firm. In the past 10 years, Moonwater has exclusively focused on the acquisition of office, retail, and multifamily assets in the Las Vegas MSA. In this period, the company has purchased a number of large office assets, in addition to multifamily and mixed-use assets. During the Great Recession, Moonwater Capital did not experience a single foreclosure or loss of principal. The company was founded by Ofir Hagay, who serves as President and CEO. Mr. Hagay has over 25 years of real estate experience in development, executive management, and business consulting. This would be the first transaction between Moonwater and RealtyMogul.
Property Summary
6226 West Sahara Avenue is a 292,180 square foot low-rise office building in the West Las Vegas submarket of the Las Vegas MSA. It is 100% leased to Nevada Power at NNN rents 39% below market (according to CoStar); this lease is set to expire in January 2029. While Nevada Power Company is the entity on the lease, its parent company, NV Energy, uses the entire building as its headquarters. It was built in 1983, with Nevada Power moving in the following year. The Property includes two on-site high-capacity generators, "Strip" views from the 2nd and 3rd floor balconies, 13 electric vehicle charging stations, a data center with raised flooring, a fitness center, and a full industrial kitchen. According to the Real Estate Company, the first floor was recently renovated and a new roof was installed. The tenant also installed a sun shade in the atrium in 2013 and made a significant sewer pipe repair in the line leading from the building to the street last fall. The tenant has been an excellent steward of the building and the Property Condition Assessment notes only $1K in required maintenance over the next two years. The Property includes 1,032 parking spaces (total parking ratio of 3.53/1,000 square feet). It is centrally located, with convenient access to the I-15 and US-95 Interstates, the Las Vegas "Strip," and McCarran International Airport. Within one mile of the Property is the College of Southern Nevada, two parks, and several retail and dining options.
Tenant Summary

NV Energy, Inc. ("NV Energy") is the parent company of Nevada Power Company, together with its subsidiaries ("Nevada Power"). NV Energy is a holding company that also owns Sierra Pacific Power Company ("Sierra Pacific") and certain other subsidiaries. It is a United States regulated electric utility company serving retail customers, including residential, commercial, and industrial customers, primarily in the Las Vegas, North Las Vegas, Henderson, and adjoining areas. In total the company provides electricity to 2.4 million customers. NV energy is an indirect and wholly owned subsidiary of Berkshire Hathaway Energy Company ("BHE"). BHE is a holding company based in Des Moines, Iowa that owns subsidiaries primarily engaged in the energy business. BHE is a consolidated subsidiary of Berkshire Hathaway, Inc. ("Berkshire Hathaway").
Lease Summary
| Tenant | Square Feet | % of Property | Rent per square foot | Lease Expiration | Lease Type |
|---|---|---|---|---|---|
| Nevada Power | 292,180 | 100.0% | $10.57* | Jan '29 | NNN |
| Grand Total | 292,180 | 100.0% | $10.57 |
*Rent drops to $9.97 per square foot on February 1, 2024
| 4265 W Sunset Rd. | 1551 Hillshire | 7180 Pollock Dr. | Averages | Subject | |
|---|---|---|---|---|---|
| Building SF | 85,943 | 70,542 | 46,057 | 67,514 | 292,180 |
| Year Built | 2000 | 1993 | 1997 | 1997 | 1983 |
| Rental Rate (NNN) | $14.28 | $16.20 | $21.60 | $17.36 | $10.57 |
| Leased SF | 85,943 | 70,542 | 46,057 | 67,514 | 292,180 |
| Tenant | Las Vegas Color Graphics | Shift 4 | SolarCity | Nevada Power Company | |
| Date Signed | Feb '20 | Jan '17 | May '17 | Feb '10 | |
| Lease Term (years) | 12.0 | 3.8 | 3.6 | 6.5 | 19.0 |
| Parking Ratio (per 1,000 sf) | 1.1 | 4.2 | 7.0 | 3.8 | 3.5 |
| Distance from Property (mi.) | 5.3 | 5.2 | 7.4 | 6.0 |
| 500 N Rainbow | Charleston Tower | 1551 Hillshire | Bonneville Square | Averages | Subject | |
|---|---|---|---|---|---|---|
| Date Sold | May '20 | Jul '18 | Jan '19 | Jan '20 | Jun '20 | |
| Building SF | 81,959 | 88,726 | 70,542 | 97,611 | 84,710 | 292,180 |
| Occupancy at Purchase | 92% | 88% | 100% | 81% | 90% | 100% |
| Year Built | 1997 | 1973 | 1993 | 1983 | 1987 | 1983 |
| Purchase Price | $15,000,000 | $17,000,000 | $18,300,000 | $14,900,000 | $16,300,000 | $34,000,000 |
| $/SF | $183 | $192 | $259 | $153 | $197 | $116 |
| Cap Rate | N/A | 7.62% | 6.34% | 7.50% | 7.15% | 9.09% |
| Parking Ratio (per 1,000 sf) | 5.0 | 3.3 | 4.2 | 2.9 | 3.9 | 3.5 |
| Distance from Property (mi.) | 2.3 | 3.8 | 5.2 | 4.9 | 4.1 |
Lease and sale comparables were obtained from CoStar
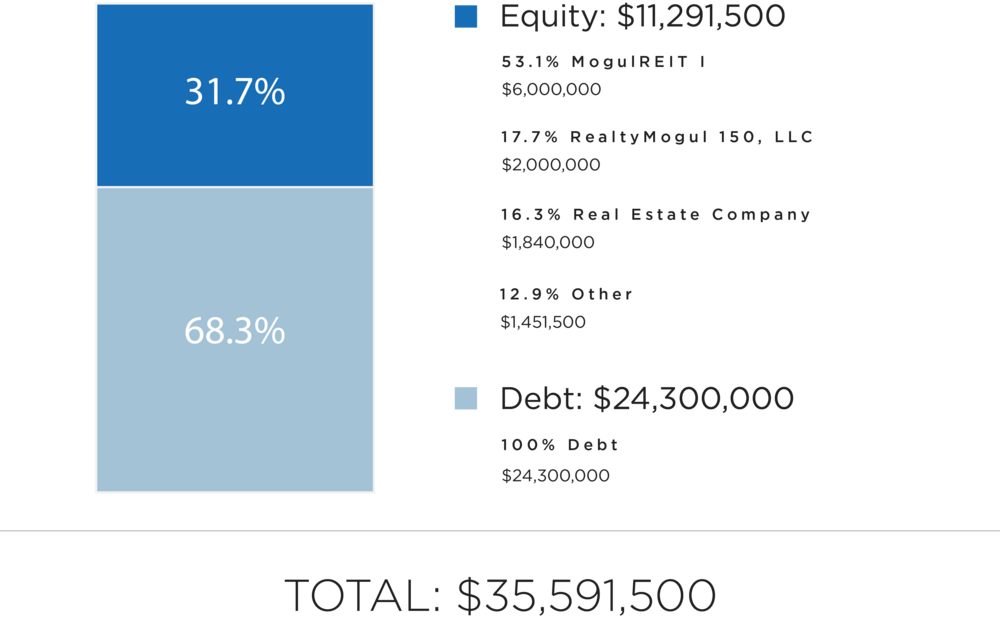
| Sources of Funds | $ Amount | Per Square Foot |
| Debt | $24,300,000 | $83 |
| Equity | $11,291,500 | $39 |
| Total Sources of Funds | $35,591,500 | $122 |
| Purchase Price | $34,000,000 | $116 |
| Loan Fee | $121,500 | $0 |
| Real Estate Company Acquisition Fee | $340,000 | $1 |
| Broker Dealer Fee | $80,000 | $0 |
| Broker Fee | $340,000 | $1 |
| MogulREIT I Origination Fee | $340,000 | $1 |
| Closing Costs | $320,000 | $1 |
| Working Capital | $50,000 | $0 |
| Total Uses of Funds | $35,591,500 | $122 |
Please note that the Real Estate Company's equity contribution may consist of friends and family equity and equity from funds controlled by the Real Estate Company
The expected terms of the debt financing are as follows:
- Estimated Loan Proceeds: $24,300,000
- Interest Rate: 4.00%
- Amortization: 25 years
- Interest Only Period: None
- Loan Term: Seven years
- Extension Options: None
- Prepayment Penalty: 2.0% months 1-12, 1.5% months 13-18, 1.0% months 19-24
- Cash Flow Sweep: Year seven
There can be no assurance that a lender will provide debt on the rates and terms noted above, or at all. All rates and terms of the debt financing are subject to lender approval, including but not limited to possible increases in capital reserve requirements for funds to be held in a lender controlled capital reserve account.
The Real Estate Company intends to make distributions of all available cash and capital proceeds to investors (The Company and Real Estate Company, collectively, the "Members") as follows:
- To the Members, pari passu, all excess operating cash flows to an 8.0% IRR to the Members;
- 80% / 20% (80% to the Members / 20% to the Real Estate Company) of all excess operating cash flows to a 10% IRR;
- 70% / 30% (70% to the Members / 30% to the Real Estate Company) of all excess operating cash flows to an 13% IRR;
- 60% / 40% (60% to the Members / 40% to the Real Estate Company) of all excess operating cash flows to a 16% IRR;
- 50% / 50% (50% to the Members / 50% to the Real Estate Company) of excess cash flow and appreciation thereafter.
Note that these distributions will occur after the payment of The Company's liabilities (loan payments, operating expenses and other fees as set forth in the operating agreement, in addition to any member loans or returns due on member loans).
The Company will distribute 100% of its share of excess cash flow (after expenses and fees) to the members of The Company (including the RealtyMogul investors).
Distributions are expected to start in October 2020 and are expected to continue on a semi-annual basis thereafter. These distributions are at the discretion of the Real Estate Company, who may decide to delay distributions for any reason, including maintenance or capital reserves.
| Year 1 | Year 2 | Year 3 | Year 4 | Year 5 | Year 6 | Year 7 | |
|---|---|---|---|---|---|---|---|
| Effective Gross Revenue | $1,801,917 | $3,089,000 | $3,089,000 | $3,016,404 | $2,914,000 | $2,914,000 | $2,914,000 |
| Total Operating Expenses | $0 | $0 | $0 | $0 | $0 | $0 | $0 |
| Net Operating Income | $1,801,917 | $3,089,000 | $3,089,000 | $3,016,404 | $2,914,000 | $2,914,000 | $2,914,000 |
| Year 0 | 2020 | 2021 | 2022 | 2023 | 2024 | 2025 | 2026 | 2027 | |
|---|---|---|---|---|---|---|---|---|---|
| Distributions to RealtyMogul 150, LLC Investors | ($2,020,000) | $11,812 | $213,411 | $213,411 | $213,411 | $185,621 | $183,034 | $89,467 | $2,695,408 |
| Net Earnings to Investor - Hypothetical $50,000 Investment | ($50,000) | $292 | $5,282 | $5,282 | $5,282 | $4,595 | $4,531 | $2,215 | $65,827 |
Certain fees and compensation will be paid over the life of the transaction. The following fees and compensation will be paid:
| Type of Fee | Amount of Fee | Received By | Paid From | Notes |
|---|---|---|---|---|
| Acquisition Fee | $340,000 | Real Estate Company | Capitalized Equity Contribution | 1.0% of Purchase Price |
| Broker-Dealer Fee | $80,000 | North Capital (1) | Capitalized Equity Contribution | 4.0% of amount invested in RealtyMogul 150, LLC. |
| Origination Fee | $340,000 | RM Adviser, LLC | Capitalized Equity Contribution | 1.0% of Purchase Price |
| Broker Fee | $340,000 | Dekel Capital, Inc. | Capitalized Equity Contribution | 1.0% of Purchase Price |
| Disposition Fee | 1.0% of gross sale price | RM Adviser, LLC | Distributable Cash |
| Type of Fee | Amount of Fee | Received By | Paid From | Notes |
|---|---|---|---|---|
| Asset Management Fee | 1.5% of Effective Gross Income | Real Estate Company | Distributable Cash |
Paid semi-annually from rental payments |
| Management and Administrative Fee | 1.0% of amount invested in RealtyMogul 150, LLC | RM Manager, LLC | Distributable Cash | RM Manager, LLC is the Manager of The Company and a wholly-owned subsidiary of Realty Mogul, Co. (2) |
| Property Management Fee | 0.5% of Effective Gross Income | SKR Real Estate Services | Distributable Cash | Paid semi-annually from rental payments |
(1) North Capital Private Securities Corporation (“NCPS”), a registered broker-dealer who will act as placement agent for interests in the Company will be paid a fee as outlined above. NCPS will pay a referral fee to Mogul Securities, LLC (“MS”), an affiliate of the Manager and RealtyMogul, Co., for referring the transaction pursuant to a referral agreement between NCPS and MS. Certain employees of Realty Mogul, Co., an affiliate of Manager are registered representatives of, and are paid commissions by, NCPS.
(2) Fees may be deferred to reduce impact to investor distributions.
The above presentation is based upon information supplied by the Real Estate Company or others. Realty Mogul, Co., RM Manager, LLC, and The Company, along with their respective affiliates, officers, directors or representatives (the "RM Parties") hereby advise you that none of them has independently confirmed or verified any of the information contained herein. The RM Parties further make no representations as to the accuracy or completeness of any such information and undertake no obligation now or in the future to update or correct this presentation or any information contained herein.
The information on this Page is qualified in its entirety by reference to the more complete information about the offering contained in the Sponsor’s Investment Documents. The information on this Page is not complete and subject to change at the Sponsor’s discretion at any time up to the closing date. The Sponsor’s Investment Documents and supplements thereto contain important information about the Sponsor’s offering including relevant investment objectives, the business plan, risks, charges, expenses, and other information, which you should consider carefully before investing. The information on this Page should not be used as a basis for an investor’s decision to invest.
Risk of InvestmentThis investment is speculative, highly illiquid, and involves substantial risk. There can be no assurances that all or any of Sponsor’s assumptions, expectations, estimates, goals, hypothetical illustrations, or other aspects of Sponsor’s business plans (“Assumptions”) will be true or that actual performance will bear any relation to Sponsor’s Assumptions, and no guarantee or representation is made that Sponsor’s Assumptions will be achieved. If Sponsor does not achieve its Assumptions, your investment could be materially and adversely affected. A loss of part or all of the principal value of your investment may occur. You should not invest unless you can readily bear the consequences of such loss. Sponsor’s Assumptions should not be relied upon as the primary basis for your decision to invest.
No Reliance on Forward-Looking Statements; Sponsor AssumptionsSponsor is solely responsible for statements made concerning forward-looking statements and Assumptions, which apply only as of the date made, are preliminary and subject to change, and are expressly qualified in their entirety by the disclosures and cautionary statements included in Sponsor’s Investment Documents, which you should carefully review. Sponsor is obligated to update or revise such forward-looking statements or Assumptions to reflect events or circumstances that arise after the date made or to reflect the occurrence of unanticipated events. Sponsor’s forward-looking statements and Assumptions are hypothetical, not based on actual investment achievements or events, and are presented solely for purposes of providing insight into the Sponsor’s investment objectives, detailing Sponsor’s anticipated risk and reward characteristics, and establishing a benchmark for future evaluation of actual results; therefore, they are not a predictor, projection, or guarantee of future results. You should not rely on Sponsor’s forward-looking statements as a basis to invest.
Importantly, we do not adopt, endorse, or provide any assurance of returns or as to the accuracy or reasonableness of Sponsor’s Assumptions or forward-looking statements.
No Reliance on Past PerformanceAny description of past performance is not a reliable indicator of future performance and should not be relied upon as the primary basis to invest.
Sponsor’s Use of DebtA substantial portion of the total cost of the real estate asset acquired by the Sponsor with investor funds (“Property”) will be paid with borrowed funds, i.e., debt. Sponsor’s estimated rates and terms of the debt financing are subject to lender approval, and there is no assurance that the Sponsor will secure debt at the rates and terms presented on this Page or in the Sponsor’s Investment Documents, or at all. The use of borrowed money to acquire real estate is referred to as leveraging, which can amplify losses and could result in lender foreclosure. In addition, if the debt includes a variable (or “floating”) interest rate, the total amount of interest paid over the term of the debt will fluctuate and can increase. As a result, Sponsor’s use of debt can result in a loss of some or all of your investment.
Sponsor’s Offering is Not RegisteredSponsor’s securities offering will not be registered under the Securities Act of 1933, as amended (the “Securities Act”), in reliance upon the exemptions from registration pursuant to Rule 506(c) of Regulation D as promulgated under the Securities Act (“Private Placement”). In addition, the offering will not be registered under any state securities laws in reliance on exemptions from state registration. Such securities (your ownership interests) are subject to restrictions on transferability and resale and may not be transferred or resold except as permitted under applicable state and federal securities laws pursuant to registration or an available exemption. All Private Placements on the Platform are intended solely for “Accredited Investors,” as that term is defined in Rule 501(a) under the Securities Act.
No Investment AdviceNothing on this Page should be regarded as investment advice (either with respect to a particular security or regarding an overall investment strategy), a recommendation, an offer to sell, or a solicitation of or an offer to buy any security. Advice from a securities professional is strongly advised to understand and assess the risks associated with real estate or private placement investments.
1031 Exchange RiskInternal Revenue Code Section 1031 (“Section 1031”) contains complex tax concepts and certain tax consequences may vary depending on the individual circumstances of each investor. You should consult with and rely on your own tax advisor about the tax aspects with respect to your particular circumstances.