


New Standard Equities "NSE" was formed in 2010 to capitalize on the dislocation in the post‐financial crisis real estate investment market. With significant experience in buying and operating large, institutional-quality multifamily properties throughout the Western U.S., the company is deploying private and institutional capital to purchase and operate apartment assets that offer steady, long-term cash flow to its investors. New Standard Equities’ full-service real estate platform is actively engaged in property management, asset management, construction management and project consultation. NSE has successfully operated multifamily assets in major markets throughout the Western U.S.
The track record below includes all acquisitions completed by New Standard Equities.
RealtyMogul has invested in five prior transactions with NSE, (1) Oak Harbor, (2) Village Fair, (3) Walnut Place, (4) Elysian Glen, and (5) Majestic Bay Townhomes. Of these, only Oak Harbor has gone full cycle, achieving a 31.8% IRR after being sold in Q1 2019.
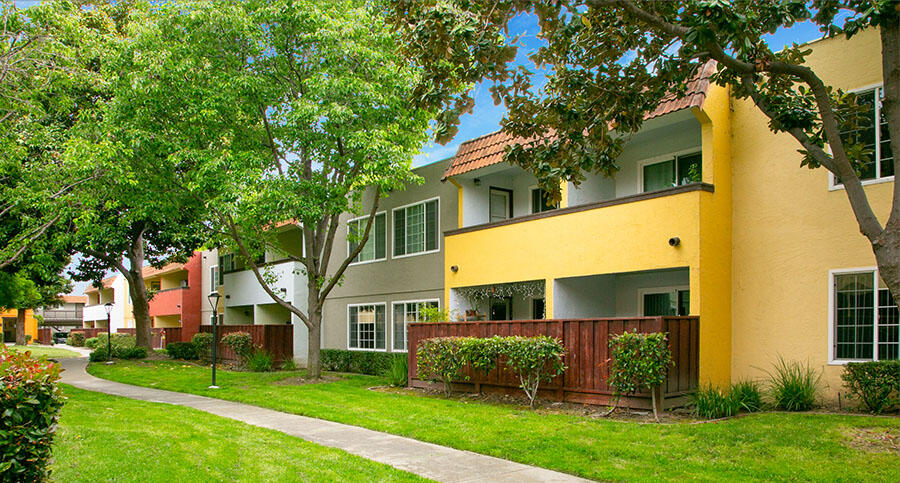
Built in 1969, Casa Serena, f.k.a. Marbaya, (the "Property") is a 170-unit garden-style community. It is located in Fremont, CA, approximately 17 miles north of the San Jose CBD. The Property contains studio (four units, 470 square feet), one-bed-one-bath (110 units, 610 square feet), and two-bed-one-bath (56 units, 835 square feet) floorplans. The current owner infused a total of $6.6 MM since buying the Property in 2004; 99 units have undergone some level of renovation, with 18 units completely renovated. Improvements include vinyl plank flooring, quartz countertops, and stainless steel appliances. Within one mile of the Property is a gym, two drug stores, several parks and retail/dining options, and the Quarry Lakes Regional Recreation Area, which offers swimming, fishing, bicycling, and hiking activities. The assigned elementary, middle, and high school are ranked 7/10, 10/10, and 8/10 respectively by greatschools.com. According to Trulia, the area has the lowest crime relative to the rest of Alameda County.
| Unit Type | # of Units | % of Total | Unit Size (square feet) | In-place Rent | Post-reno Rent |
| Studio | 4 | 2% | 470 | $1,715 | $2,023 |
| 1 Bed, 1 Bath | 110 | 65% | 610 | $1,968 | $2,364 |
| 2 Bed, 1 Bath | 56 | 33% | 835 | $2,306 | $2,715 |
| Total/Averages | 170 | 100% | 681 | $2,073 | $2,472 |
| Camden Village | Creekside Village | Heritage Village | Rexford | Total/Averages | Subject | |
|---|---|---|---|---|---|---|
| Units | 192 | 480 | 192 | 203 | 267 | 170 |
| Year Built | 1966 | 1987 | 1987 | 1980 | 1980 | 1969 |
| Average SF | 852 | 792 | 825 | 1,127 | 899 | 681 |
| Average Rental Rate | $2,655 | $2,601 | $2,679 | $2,730 | $2,666 | $2,472 |
| Average $/SF | $3.12 | $3.28 | $3.25 | $2.42 | $2.97 | $3.63 |
| Distance | 1.7 miles | 1.1 miles | 1.5 miles | 2.0 miles | 1.6 miles |
| The District | Sofi Union City | Mosaic Apartments | 3955 Adams Ave. | Total/Averages | Subject | |
|---|---|---|---|---|---|---|
| Date | Jul '19 | Dec '18 | Dec '17 | Jan '19 | Sep '19 | |
| Units | 24 | 250 | 122 | 10 | 102 | 170 |
| Year Built | 1964 | 1984 | 1970 | 1950 | 1967 | 1969 |
| Purchase Price | $9,600,000 | $91,500,000 | $43,000,000 | $3,200,000 | $36,825,000 | $60,000,000 |
| $/Unit | $400,000 | $366,000 | $352,459 | $320,000 | $359,615 | $352,941 |
| Cap Rate | 5.60% | 4.50% | N/A | 3.74% | 4.61% | 4.55% |
| Distance | 2.2 miles | 3.2 miles | 3.0 miles | 4.3 miles | 3.2 miles |
Sale and lease comps were obtained from CoStar and Axiometrics
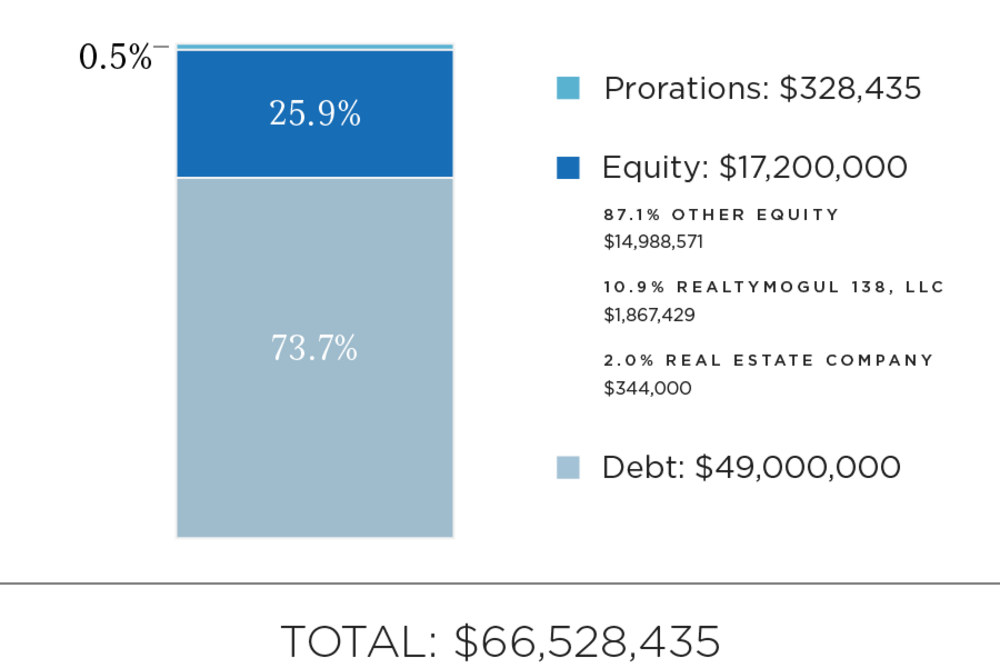
| Sources of Funds | Amount |
|---|---|
| Debt | $49,000,000 |
| Equity | $17,200,000 |
| Prorations | $328,435 |
| Total Sources of Funds | $66,528,435 |
| Uses of Funds | Amount |
| Purchase Price | $60,000,000 |
| Real Estate Company Acquisition Fee | $450,000 |
| Broker Dealer Fee* | $0 |
| Loan Fee | $742,182 |
| CapEx Budget | $4,000,000 |
| Closing, Legal Fees and Due Dilligence | $472,310 |
| Escrows | $547,328 |
| Rate Cap Fee | $33,300 |
| Working Capital | $283,315 |
| Total Uses of Funds | $66,528,435 |
*Rather than being capitalized to the transaction, the North Capital Broker Dealer Fee will be paid by NSE outside of closing
Please note that the Real Estate Company's equity contribution may consist of friends and family equity and equity from funds controlled by the Real Estate Company
Please note that the Real Estate Company will be keeping $60,000 of working capital in the operating account of NSE Fremont Manager, LLC; this amount will be taken pro rata from all contributions to the GP Equity, including that of RealtyMogul 138, LLC
The expected terms of the debt financing are as follows:
- Estimated Proceeds: $49,000,000
- Initial Funding: $45,000,000
- Future Funding: $4,000,000
- Estimated Rate (Floating): One Month Libor plus 2.40%
- Term: 3 years
- Interest Only: 5 years
- Prepayment Penalty: 18 months yield maintenance
- Extension Options: Two (2) one-year extension options (0.0% fee for the first, 0.2% fee for the second)
There can be no assurance that a lender will provide debt on the rates and terms noted above, or at all. All rates and terms of the debt financing are subject to lender approval, including but not limited to possible increases in capital reserve requirements for funds to be held in a lender controlled capital reserve account.
The Target intends to make distributions to investors (the Company and Real Estate Company, collectively, the "Members") as follows:
- To the Members, pari passu, all excess operating cash flows to a 10.0% IRR to the Members;
- 87.5% / 12.5% (87.5% to Members / 12.5% to Promote) of excess cash flow to the greater of a 15.0% IRR or 1.6x equity multiple;
- 68.75% / 31.25% (68.75% to Members / 31.25% to Promote) of excess cash flow and appreciation thereafter.
Note that these distributions will occur after the payment of the Company's liabilities (loan payments, operating expenses and other fees as set forth in the LLC agreement, in addition to any member loans or returns due on member loans).
The manager of The Company may receive a portion of the promote. Distributions are expected to start in March 2020 and are projected to continue on a quarterly basis thereafter. These distributions are at the discretion of the Real Estate Company, who may decide to delay distributions for any reason, including maintenance or capital reserves.
| Year 1 | Year 2 | Year 3 | Year 4 | Year 5 | |
|---|---|---|---|---|---|
| Effective Gross Revenue | $4,343,295 | $4,663,276 | $4,938,601 | $5,276,404 | $5,584,474 |
| Total Operating Expenses | $1,615,876 | $1,661,373 | $1,706,465 | $1,754,391 | $1,802,409 |
| Net Operating Income | $2,727,419 | $3,001,903 | $3,232,136 | $3,522,013 | $3,782,064 |
| Year 0 | 2019 | 2020 | 2021 | 2022 | 2023 | 2024 | |
|---|---|---|---|---|---|---|---|
| Distributions to RealtyMogul 138, LLC Investors | ($1,920,000) | $9,108 | $73,552 | $110,393 | $133,101 | $154,677 | $3,021,951 |
| Net Earnings to Investor - Hypothetical $50,000 Investment |
($50,000) | $237 | $1,915 | $2,875 | $3,466 | $4,028 | $78,697 |
Certain fees and compensation will be paid over the life of the transaction. The following fees and compensation will be paid:
| Type of Fee | Amount of Fee | Received By | Paid From | Notes |
|---|---|---|---|---|
| Acquisition Fee | $450,000 | Real Estate Company | Capitalized Equity Contribution | 0.75% of the Property purchase price |
| Broker-Dealer Fee | $76,000 | North Capital (1) | Real Estate Company Acquisition Fee | Greater of $50,000 or 4.0% of the equity raised by RealtyMogul 138, LLC |
| Construction Management Fee | 5.0% of costs | Real Estate Company | Capitalized Equity Contribution | |
| Servicing Startup Fee | $150,000 | Third Party Investor | Capitalized Equity Contribution |
| Type of Fee | Amount of Fee | Received By | Paid From | Notes |
|---|---|---|---|---|
| Management and Administrative Fee | 1.0% of amount invested in RealtyMogul 138, LLC | RM Manager, LLC | Distributable Cash | RM Manager, LLC is the Manager of RealtyMogul 138, LLC and a wholly-owned subsidiary of Realty Mogul, Co. (2) |
| Asset Management Fee | 0.5% of Effective Gross Income | Real Estate Company | Distributable Cash | |
| Property Management Fee | 3.0% of Effective Gross Income | Real Estate Company | Distributable Cash | |
| Servicing Fee | $41,280 per year | Third Party Investor | Distributable Cash | 0.3% of capital contribution by Third Party Investor |
(1) North Capital Private Securities Corporation (“NCPS”), a registered broker-dealer who will act as placement agent for interests in the Company will be paid a fee as outlined above. NCPS will pay a referral fee to Mogul Securities, LLC (“MS”), an affiliate of the Manager and RealtyMogul, Co., for referring the transaction pursuant to a referral agreement between NCPS and MS. Certain employees of Realty Mogul, Co., an affiliate of Manager are registered representatives of, and are paid commissions by, NCPS.
(2) Fees may be deferred to reduce impact to investor distributions.
The above presentation is based upon information supplied by the Real Estate Company or others. Realty Mogul, Co., RM Manager, LLC, and The Company, along with their respective affiliates, officers, directors or representatives (the "RM Parties") hereby advise you that none of them has independently confirmed or verified any of the information contained herein. The RM Parties further make no representations as to the accuracy or completeness of any such information and undertake no obligation now or in the future to update or correct this presentation or any information contained herein.
The information on this Page is qualified in its entirety by reference to the more complete information about the offering contained in the Sponsor’s Investment Documents. The information on this Page is not complete and subject to change at the Sponsor’s discretion at any time up to the closing date. The Sponsor’s Investment Documents and supplements thereto contain important information about the Sponsor’s offering including relevant investment objectives, the business plan, risks, charges, expenses, and other information, which you should consider carefully before investing. The information on this Page should not be used as a basis for an investor’s decision to invest.
Risk of InvestmentThis investment is speculative, highly illiquid, and involves substantial risk. There can be no assurances that all or any of Sponsor’s assumptions, expectations, estimates, goals, hypothetical illustrations, or other aspects of Sponsor’s business plans (“Assumptions”) will be true or that actual performance will bear any relation to Sponsor’s Assumptions, and no guarantee or representation is made that Sponsor’s Assumptions will be achieved. If Sponsor does not achieve its Assumptions, your investment could be materially and adversely affected. A loss of part or all of the principal value of your investment may occur. You should not invest unless you can readily bear the consequences of such loss. Sponsor’s Assumptions should not be relied upon as the primary basis for your decision to invest.
No Reliance on Forward-Looking Statements; Sponsor AssumptionsSponsor is solely responsible for statements made concerning forward-looking statements and Assumptions, which apply only as of the date made, are preliminary and subject to change, and are expressly qualified in their entirety by the disclosures and cautionary statements included in Sponsor’s Investment Documents, which you should carefully review. Sponsor is obligated to update or revise such forward-looking statements or Assumptions to reflect events or circumstances that arise after the date made or to reflect the occurrence of unanticipated events. Sponsor’s forward-looking statements and Assumptions are hypothetical, not based on actual investment achievements or events, and are presented solely for purposes of providing insight into the Sponsor’s investment objectives, detailing Sponsor’s anticipated risk and reward characteristics, and establishing a benchmark for future evaluation of actual results; therefore, they are not a predictor, projection, or guarantee of future results. You should not rely on Sponsor’s forward-looking statements as a basis to invest.
Importantly, we do not adopt, endorse, or provide any assurance of returns or as to the accuracy or reasonableness of Sponsor’s Assumptions or forward-looking statements.
No Reliance on Past PerformanceAny description of past performance is not a reliable indicator of future performance and should not be relied upon as the primary basis to invest.
Sponsor’s Use of DebtA substantial portion of the total cost of the real estate asset acquired by the Sponsor with investor funds (“Property”) will be paid with borrowed funds, i.e., debt. Sponsor’s estimated rates and terms of the debt financing are subject to lender approval, and there is no assurance that the Sponsor will secure debt at the rates and terms presented on this Page or in the Sponsor’s Investment Documents, or at all. The use of borrowed money to acquire real estate is referred to as leveraging, which can amplify losses and could result in lender foreclosure. In addition, if the debt includes a variable (or “floating”) interest rate, the total amount of interest paid over the term of the debt will fluctuate and can increase. As a result, Sponsor’s use of debt can result in a loss of some or all of your investment.
Sponsor’s Offering is Not RegisteredSponsor’s securities offering will not be registered under the Securities Act of 1933, as amended (the “Securities Act”), in reliance upon the exemptions from registration pursuant to Rule 506(c) of Regulation D as promulgated under the Securities Act (“Private Placement”). In addition, the offering will not be registered under any state securities laws in reliance on exemptions from state registration. Such securities (your ownership interests) are subject to restrictions on transferability and resale and may not be transferred or resold except as permitted under applicable state and federal securities laws pursuant to registration or an available exemption. All Private Placements on the Platform are intended solely for “Accredited Investors,” as that term is defined in Rule 501(a) under the Securities Act.
No Investment AdviceNothing on this Page should be regarded as investment advice (either with respect to a particular security or regarding an overall investment strategy), a recommendation, an offer to sell, or a solicitation of or an offer to buy any security. Advice from a securities professional is strongly advised to understand and assess the risks associated with real estate or private placement investments.
1031 Exchange RiskInternal Revenue Code Section 1031 (“Section 1031”) contains complex tax concepts and certain tax consequences may vary depending on the individual circumstances of each investor. You should consult with and rely on your own tax advisor about the tax aspects with respect to your particular circumstances.