The team at our affiliated broker-dealer, RM Securities, conducts diligence on of the issuer, including detailed background checks, criminal checks, bad actor checks, and reference checks on sponsors. In addition to screening for any criminal background, we may also turn down sponsors due to poor reference checks, even if the background and criminal checks are satisfactory.
We require unaffiliated sponsors to use an unaffiliated third-party escrow agent.* When an investor makes an investment with such sponsors using the RealtyMogul platform, the investor’s money is transferred directly into a third-party escrow account. All closing conditions in connection with a sponsor’s contingency offering need to be met before the third-party escrow agent will approve releasing investor funds to the issuer or general partner. For example, if an issuer or general partner plans to use funds for a real estate acquisition that does not ultimately transact, the third-party escrow agent will not transfer investor funds to the issuer or general partner, and funds will be returned to investors.
* Unless otherwise disclosed, escrow accounts are not required for some investments that accommodate 1031 investments where the property is already acquired.
Our processes typically includes visiting certain properties (or a subset of properties if it's a fund) to confirm the real estate is what and where the real estate is supposed to be. For certain properties that accommodate 1031 exchange investments, the team will review third-party prepared due diligence reports in lieu of a site visit.
We have formalized processes and checklists for every private placement deal listed on the platform.


The Property is being acquired at a basis of $119,444 per unit, which compares favorably to recent comparables trading upwards of $160,000 per unit.

Per CoStar, current rents present a 21% discount to submarket averages and appear to offer a compelling mark-to-market opportunity as evidenced by the competitive set.

The Property is well-located, situated 13 miles East of the Portland CBD, and within three miles of a Boeing factory (1,600 employees), an Amazon fulfillment center (1,500 employees), a 100-bed medical center, as well as downtown Gresham. The Property is also across the street from the MAX train station, offering affordable and convenient access throughout the Portland MSA.
Cooper Street Capital
Cooper Street Capital (“CSC”) provides investment access to the commercial real estate space for retail, family offices, and institutional investors. As a private equity real estate firm, CSC applies targeted acquisition strategies and active asset management to provide consistent risk-adjusted returns for investors in value-add and core-plus multifamily real estate opportunities. CSC aims to capture upside potential for its partners through both physical renovations and/or major operational improvements.
Since the firm's founding in 2011, CSC’s team has stayed committed to sourcing commercial real estate investment opportunities from across the United States that have demonstrated strong financial performance in the past or that exhibit the potential for gains in the future. In either case, potential acquisitions must be supported by strong market fundamentals.
CSC aims to minimize downside risk for its partners through “deal-by-deal” and targeted acquisitions. The firm seeks out existing multifamily real estate assets that can provide for continued cash flow and where value can be built upon through the process of driving up an asset’s yearly Net Operating Income (NOI). The firm is headquartered in Aspen, Colorado.
https://www.cooperstreetcapital.com/-
 Brandon CooperManaging Partner
 -
 Matt CooperDirector of Acquisitions
 -
 Robert FayDirector of Investor Relations
Brandon has spearheaded the acquisition of over $1.5 billion worth of real estate assets in the last twelve years. Prior to founding Cooper Street Capital, Brandon was the co-founder of two other real estate investment firms, including Maroon Peak Partners and I-95 Ventures. Before breaking into the real estate sector, Brandon worked as a financial advisor at Merrill Lynch and previous to that as a policy analyst at The Center for Middle East Peace in Washington, D.C. He graduated Magna Cum Laude from Bates College where he led the Bobcat’s Division I cross country ski team.
Prior to joining Cooper Street Capital, Matt spent several years with the US Delegation to the World Trade Organization (WTO) and the Organization for Economic Co-operation and Development (OECD) researching topics of international trade and the economics of corporate governance frameworks. Since joining, he has leveraged his analytical background to help CSC acquire over $1 billion of commercial real estate. He also holds a Bachelor of Arts in Political Science and French Language from the University of Virginia and a Masters of Science in International Political Economy from the London School of Economics.
Over the past seven years, Robert has capitalized, acquired, and repositioned over $1.25 billion worth of multifamily real estate raising and managing over $450 million in equity from family offices and high-net-worth individuals. Prior to Robert’s real estate ventures, he worked in equity research assisting in the valuation of publicly traded stocks with market caps between $30-$200 billion and for Bank of America Merrill Lynch. At Cooper Street Capital, Robert is in charge of all things Investor Relations where he works closely with the CEO and Director of Acquisition on capital events for the company and its investing partners. He graduated from the University of Colorado at Boulder with a dual degree in Economics and Psychology.
| Property Name | City, State | Asset Type | Status | Acq Date | Units | Purchase Price | Sales Price or Estimated Value | IRR | EMx |
| Highland Park | Albuquerque, NM | Multifamily | SOLD | 2/1/2013 | 80 | $5,125,000 | $6,400,000 | 18.40% | N/A |
| Maroon Peak Netherwood | Albuquerque, NM | Multifamily | SOLD | 8/1/2013 | 220 | $13,975,000 | $18,500,000 | 12.90% | N/A |
| Citadel Apartments | Albuquerque, NM | Multifamily | SOLD | 3/1/2014 | 233 | $9,719,000 | $14,792,000 | 33.40% | N/A |
| I-95 Portfolio | Portland, ME | Multifamily | SOLD | 7/1/2014 | 54 | $6,550,000 | $9,500,000 | 18.00% | N/A |
| Bowdoin Realty Portfolio | Portland, ME | Multifamily | SOLD | 12/1/2014 | 41 | $5,630,000 | $9,900,000 | 22.30% | N/A |
| 94-96 Winter | Portland, ME | Multifamily | SOLD | 2/1/2015 | 10 | $900,000 | $1,400,000 | 54.50% | N/A |
| Bricklight Capital Portfolio | Portland, ME | Multifamily | SOLD | 7/1/2015 | 45 | $4,900,000 | $7,100,000 | 20.50% | N/A |
| East End Apartments | Portland, ME | Multifamily | SOLD | 9/1/2015 | 37 | $4,300,000 | $5,800,000 | 24.10% | N/A |
| Bricklight II | Portland, ME | Multifamily | SOLD | 9/1/2015 | 24 | $2,730,000 | $3,250,000 | 25.20% | N/A |
| 773 Congress | Portland, ME | Multifamily | SOLD | 9/1/2015 | 5 | $390,000 | $420,000 | 29.60% | N/A |
| 59 Bramhall | Portland, ME | Multifamily | SOLD | 10/1/2015 | 9 | $625,000 | $750,000 | 48.00% | N/A |
| Bear Creek Apartments | Albuquerque, NM | Multifamily | SOLD | 6/1/2016 | 84 | $2,820,000 | $3,400,000 | 30.50% | N/A |
| Cedar 31 Apartments | Austin, TX | Multifamily | OWNED | 4/9/2017 | 14 | $2,310,000 | $3,100,000 | N/A | N/A |
| Bannister Apartments | Austin, TX | Multifamily | SOLD | 5/1/2017 | 34 | $2,485,000 | $3,300,000 | 18.30% | N/A |
| 1515 Clermont | Denver, CO | Multifamily | SOLD | 7/1/2017 | 36 | $5,500,000 | $7,150,000 | 14.00% | N/A |
| The Goose Nest Apartments | Portland, OR | Multifamily | SOLD | 8/1/2017 | 22 | $3,075,000 | $4,260,000 | 20.10% | N/A |
| Villas de la Luz | Austin, TX | Multifamily | SOLD | 1/1/2018 | 240 | $20,500,000 | $25,225,000 | 22.80% | N/A |
| Courtyard and Arbors Apartments | Albuquerque, NM | Multifamily | SOLD | 2/1/2018 | 529 | $31,100,000 | $38,000,000 | 18.30% | N/A |
| English Aire and Lafayette Landing | Austin, TX | Multifamily | SOLD | 8/1/2018 | 397 | $38,750,000 | $45,000,000 | 50.70% | N/A |
| Sage Canyon | Albuquerque, NM | Multifamily | SOLD | 8/24/2018 | 105 | $8,790,000 | $10,260,000 | 38.15% | 1.54x |
| CSC North Austin Portfolio | Austin, TX | Multifamily | SOLD | 1/1/2019 | 523 | $56,000,000 | $62,350,000 | 50.70% | N/A |
| Gallery Park and Westfal | Portland, OR | Multifamily | OWNED | 1/18/2019 | 93 | $18,200,000 | $2,600,000 | N/A | N/A |
| Mueller Rose | Austin, TX | Multifamily | SOLD | 3/15/2019 | 181 | $18,825,000 | $30,000,000 | 25.10% | 1.93x |
| CSC Spanish Trails | Austin, TX | Multifamily | SOLD | 3/1/2019 | 40 | $6,238,000 | $7,600,000 | 19.30% | N/A |
| 1919 Portsmouth, 1903 Portsmouth, 420 W. Alabama | Houston, TX | Multifamily | OWNED | 4/26/2019 | 75 | $13,000,000 | $14,000,000 | N/A | N/A |
| Rock Creek | Albuquerque, NM | Multifamily | SOLD | 6/28/2019 | 121 | $6,875,000 | $8,000,000 | 39.10% | 1.48x |
| Pyramid Portfolio | Albuquerque, NM | Multifamily | SOLD | 6/28/2019 | 34 | $1,905,000 | $2,300,000 | 25.20% | 1.25x |
| Bannister Place | Austin, TX | Multifamily | SOLD | 7/11/2019 | 20 | $3,300,000 | $4,000,000 | 13.21% | 1.40x |
| The French Quarter | Albuquerque, NM | Multifamily | SOLD | 7/2/2019 | 84 | $3,400,000 | $4,480,000 | 16.45% | 1.33x |
| Lexington Realty Capital | Albuquerque, NM | Multifamily | SOLD | 8/9/2019 | 156 | $7,400,000 | $11,750,000 | 142.16% | 2.43x |
| The Zeno Apartments | Portland, OR | Multifamily | OWNED | 8/27/2019 | 22 | $4,250,000 | $5,000,000 | N/A | N/A |
| Cascade Apartments | Austin, TX | Multifamily | SOLD | 9/19/2019 | 198 | $31,500,000 | $38,000,000 | 13.90% | 1.41x |
| Villas Esperanza | Albuquerque, NM | Multifamily | SOLD | 9/20/2019 | 188 | $12,250,000 | $19,000,000 | 35.60% | 2.28x |
| Miller Square | Austin, TX | Multifamily | SOLD | 9/1/2019 | 51 | $8,640,000 | $10,800,000 | 13.23% | 1.42x |
| Chestnut Park | San Antonio, TX | Multifamily | SOLD | 12/3/2019 | 145 | $12,000,000 | $18,500,000 | 30.20% | 1.89x |
| Arbors and Courtyards | Albuquerque, NM | Multifamily | SOLD | 12/23/2019 | 529 | $38,000,000 | $66,500,000 | 61.80% | 3.04x |
| Barberry Village | Portland, OR | Multifamily | SOLD | 1/10/2020 | 180 | $21,500,000 | $34,000,000 | 36.59% | 2.05x |
| Arcadian | Austin, TX | Multifamily | SOLD | 2/14/2020 | 83 | $11,350,000 | $13,400,000 | 29.27% | 1.80x |
| Amber Hill | San Antonio, TX | Multifamily | SOLD | 3/18/2020 | 244 | $16,750,000 | $20,700,000 | 52.90% | 1.57x |
| Blue Vine Apartments | San Antonio, TX | Multifamily | SOLD | 4/27/2020 | 111 | $10,050,000 | $14,500,000 | 17.54% | 1.39x |
| The Lexington Place | Albuquerque, NM | Multifamily | SOLD | 8/13/2020 | 156 | $11,750,000 | $15,752,000 | 35.57% | 1.68x |
| River Park Apartments | New Braunfels, TX | Multifamily | SOLD | 9/2/2020 | 100 | $7,800,000 | $11,195,000 | 64.80% | 1.67x |
| Luna Verde | El Paso, TX | Multifamily | OWNED | 9/9/2020 | 297 | $13,500,000 | $23,000,000 | N/A | N/A |
| Paso Oeste | El Paso, TX | Multifamily | SOLD | 9/9/2020 | 244 | $15,500,000 | $21,025,000 | 29.40% | N/A |
| Vista Grande | Albuquerque, NM | Multifamily | SOLD | 10/19/2020 | 168 | $11,000,000 | $19,200,000 | 130.08% | 3.80x |
| Mountaindale | El Paso, TX | Multifamily | SOLD | 10/1/2020 | 88 | $5,100,000 | $7,550,000 | 23.83% | 1.34x |
| Creeks Edge Apartments | Austin, TX | Multifamily | SOLD | 1/4/2021 | 200 | $23,000,000 | $33,250,000 | 21.97% | 1.32x |
| Netherwood Village | Albuquerque, NM | Multifamily | SOLD | 1/29/2021 | 220 | $18,500,000 | $31,500,000 | 366.94% | 4.59x |
| Amber Hill - 2 | San Antonio, TX | Multifamily | SOLD | 5/25/2021 | 244 | $20,700,000 | $27,000,000 | 69.30% | 1.73x |
| Raintree Village | El Paso, TX | Multifamily | SOLD | 4/15/2021 | 275 | $15,750,000 | $20,265,000 | 22.43% | 1.44x |
| Evergreen Apartments | Santa Fe, NM | Multifamily | OWNED | 5/3/2021 | 70 | $6,300,000 | $8,500,000 | N/A | N/A |
| Alexis Apartments | Las Cruces, NM | Multifamily | SOLD | 6/2/2021 | 170 | $13,235,000 | $25,000,000 | 299.90% | 4.25x |
| The Oasis, Speedway 38, Barton Ridge | Austin, TX | Multifamily | OWNED | 7/21/2021 | 121 | $21,650,000 | $21,650,000 | N/A | N/A |
| Velo Apartments | Spokane, WA | Multifamily | SOLD | 6/16/2021 | 58 | $7,900,000 | $8,400,000 | 30.16% | 1.44x |
| Orlo | Portland, OR | Multifamily | OWNED | 8/6/2021 | 38 | $5,000,000 | $5,000,000 | N/A | N/A |
| Regal Ridge | Spokane, WA | Multifamily | SOLD | 8/31/2021 | 97 | $18,250,000 | $21,500,000 | 8.30% | 1.16x |
| 1865 Union Street | San Francisco, CA | Multifamily | OWNED | 9/30/2021 | 5 | $4,100,000 | $4,100,000 | N/A | N/A |
| The Rosewood | Spokane, WA | Multifamily | OWNED | 12/15/2021 | 77 | $10,500,000 | $13,230,000 | N/A | N/A |
| Paso Norte, Santa Rosa, Rosetta | El Paso, TX | Multifamily | OWNED | 12/3/2021 | 288 | $19,475,000 | $24,000,000 | N/A | N/A |
| The Alexandra | Lexington, KY | Multifamily | OWNED | 2/15/2022 | 204 | $14,000,000 | $14,000,000 | N/A | N/A |
| The Lennox | Spokane, WA | Multifamily | OWNED | 3/7/2022 | 51 | $6,600,000 | $6,600,000 | N/A | N/A |
| Trinity Place/Casa Barranca | El Paso, TX | Multifamily | OWNED | 6/1/2022 | 429 | $32,400,000 | $32,400,000 | N/A | N/A |
| The Caterina/Paso Este | El Paso, TX | Multifamily | OWNED | 6/1/2022 | 131 | $8,825,000 | $8,825,000 | N/A | N/A |
| Arabella | San Antonio, TX | Multifamily | OWNED | 7/12/2022 | 144 | $12,700,000 | $12,700,000 | N/A | N/A |
| Crescent Ridge | Cincinnati, OH | Multifamily | OWNED | 8/1/2022 | 154 | $17,300,000 | $17,300,000 | N/A | N/A |
| White Willow | Portland, OR | Multifamily | OWNED | 9/21/2022 | 90 | $11,700,000 | $11,700,000 | N/A | N/A |
| Jackson / Morrison | Spokane, WA | Multifamily | OWNED | 10/14/2022 | 111 | $16,550,000 | $16,550,000 | N/A | N/A |
| Elm Creek | San Antonio, TX | Multifamily | OWNED | 12/13/2022 | 81 | $9,350,000 | $9,350,000 | N/A | N/A |
| Casa Loma | Santa Fe, NM | Multifamily | OWNED | 1/13/2023 | 132 | $26,500,000 | $26,500,000 | N/A | N/A |
| Dawn Run | Lexington, KY | Multifamily | OWNED | 4/27/2023 | 218 | $9,100,000 | $9,100,000 | N/A | N/A |
| The Izzy | Oklahoma City, OK | Multifamily | OWNED | 3/21/2023 | 328 | $32,250,000 | $32,250,000 | N/A | N/A |
| Villas on 50th | Oklahoma City, OK | Multifamily | OWNED | 5/8/2023 | 114 | $7,300,000 | $7,300,000 | N/A | N/A |
| Totals/Weighted Average | 10,400 | $925,192,000 | $1,150,679,000 |
The above bios and track record were provided by Cooper Street Capital and have not been independently verified by RealtyMogul.
In this transaction, RealtyMogul investors are to invest in Realty Mogul 143, LLC ("The Company"), which is to subsequently invest in CSC Barberry Village Realty Capital, LLC ("The Target"), a limited liability company that will hold title to the Property. Cooper Street Capital (the "Real Estate Company") is under contract to purchase the Property for approximately $21.5 million ($119,444 per unit) and the total project cost is expected to be approximately $25.1 million ($139,333 per unit).
The Real Estate Company plans to implement a value-add strategy. This strategy assumes a $2.4 million capital improvement budget tailored to address interior and exterior renovations over three years, resulting in a target renovation premium of $196 per unit (~20% above in-place).
The exterior renovations, budgeted at $754,799, include adding a clubhouse, pool upgrades, landscaping, exterior painting, balcony updates and a signage package. The Real Estate Company plans to spend approximately $1.3 million ($8,341 per unit) on interior renovations for 160 units, including flooring upgrades, cabinet replacements, new black appliances, washer-dryers, bathroom renovations and painting. This budget also includes a 10.0% contingency and a 5.0% construction management fee. The business plan calls for a three-year hold, at which point the Property is expected to sell at a 5.5% cap rate for $30.2 million ($167,966 per unit).
Capital Expenditure Budget
| Exterior Renovations | ||
| Gates/Fencing | $53,875 | |
| Exterior Lighting | $20,000 | |
| Private Patios Enclosure (Ground Floor Units) | $167,959 | |
| Club House | $40,000 | |
| Landscaping | $40,000 | |
| Balcony Updates | $30,000 | |
| Signage Package | $15,000 | |
| Paint | $150,000 | |
| Siding | $35,000 | |
| Pool Upgrades | $15,000 | |
| Seal Coat/Striping | $16,965 | |
| Energy Efficient Windows | $67,500 | |
| Gazebo 12x16 Double Roof Aluminum | $10,000 | |
| Covered Grills | $3,500 | |
| Storage Space | $40,000 | |
| Miscellaneous Repairs/Green Updates | $50,000 | |
| Exterior Subtotal | $754,799 | |
| Interior Renovations | Per Unit | |
| GE 24" Dishwasher | $46,280 | $356 |
| Broan 30" White Range Hood | $6,889 | $53 |
| GE 30" Electric Stove | $74,945 | $577 |
| GE 15.5 Cubic Feet Top Mount Fridge | $99,515 | $766 |
| Bathtub Resurface | $27,840 | $174 |
| Bathroom Hardware Package | $40,000 | $250 |
| Flooring | $182,000 | $1,400 |
| Paint & Drywall Rehabilitation | $24,000 | $150 |
| Kitchen Cabinet Paint/Hardware | $20,000 | $125 |
| Washer/Dryer Hook-Ups Plumbing | $562,230 | $6,247 |
| Washer/Dryer | $135,045 | $1,501 |
| WAC Lighting Link 3 Light 27" Wide LED Bath | $19,120 | $120 |
| Satco Blink Plus 15" W White 4000K LED | $16,640 | $104 |
| Labor | $80,000 | $500 |
| Interior Subtotal | $1,334,504 | $8,341 |
| Construction Manager (5%) | $100,465 | |
| Contingency Reserve (10%) | $200,930 | |
| Marketing | $15,000 | |
| Total Estimated Budget | $2,405,698 |
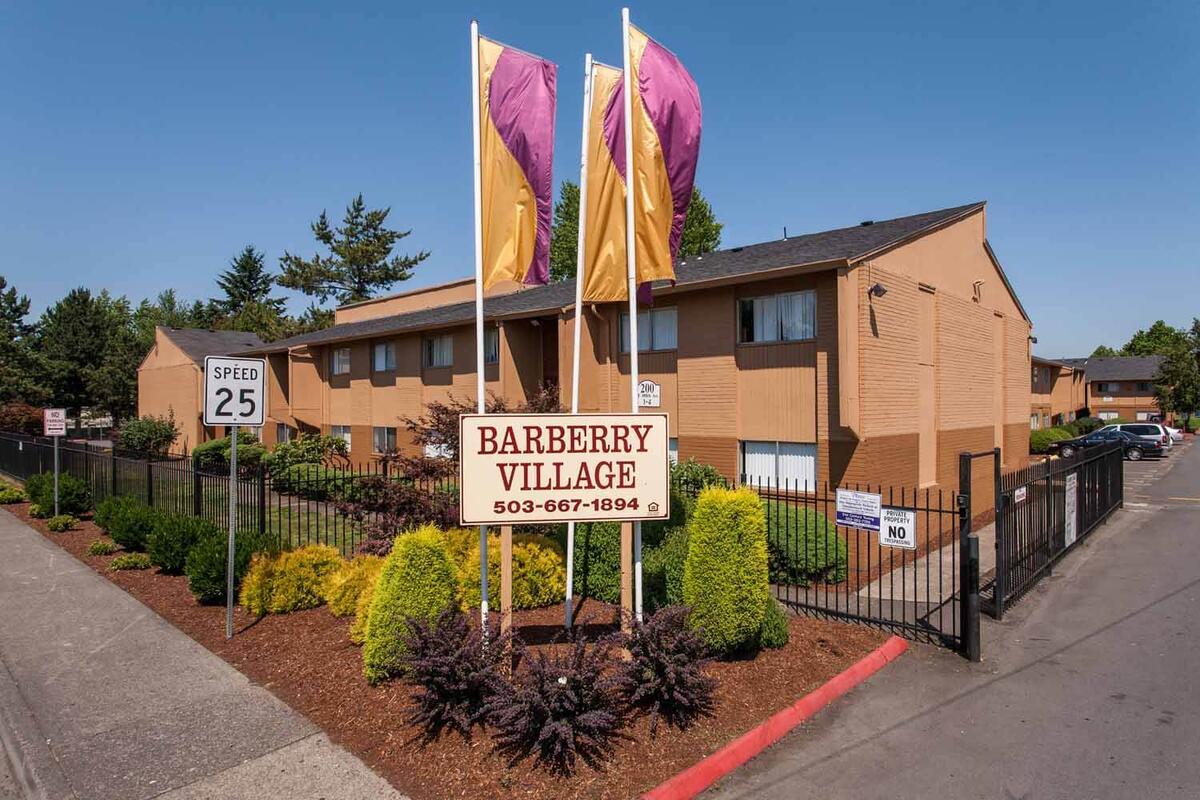
Barberry Village is a class-C garden-style multifamily property located in the Gresham submarket of Portland, OR. Built in 1974, the Property is comprised of one- (68 units) two- (104 unit) and three- (8 units) bedroom floor plans combining to 180 units. Amenities include a resort-style pool, community laundry facilities, and a playground. The Property is 92.5% occupied with in-place rents of $958, which reflects a 21% discount to submarket averages, per CoStar.
The Property is located 13 miles outside of Portland CBD, proximate to I-84 and I-205. Within three miles of the Property are a Boeing factory, an Amazon Fulfillment Center, Mt. Hood Medical Center, and downtown Gresham.
Unit Mix
| Unit Type | # of Units | % of Total | Unit Size (square feet) | In-place Rent | Post-reno Rent |
|---|---|---|---|---|---|
| 1 Bed, 1 Bath | 68 | 38% | 610 | $886 | $1,030 |
| 2 Bed, 1 Bath | 104 | 58% | 826 | $992 | $1,220 |
| 3 Bed, 1 Bath | 18 | 4% | 917 | $1,129 | $1,350 |
| Total/Averages | 180 | 100% | 748 | $958 | $1,154 |
Lease Comparables - Post Renovation
|
|
Townfair
|
Village Court
|
Fieldstone
|
Rockwood Station
|
Pine Square
|
Averages
|
Subject
|
|---|---|---|---|---|---|---|---|
| Submarket | Gresham | Gresham | Gresham | Gresham | Gresham | Gresham | |
| Occupancy | 97% | 94% | 94% | 94% | 97% | 93% | |
| Units | 265 | 84 | 154 | 195 | 143 | 168 | 180 |
| Year Built | 1991 | 1950 | 1997 | 1990 | 1974 | 1980 | 1974 |
| # Units (1x1) | 132 | 23 | 42 | 78 | 52 | 65 | 68 |
| Rent (1x1) | $1,214 | $1,115 | $1,381 | $1,225 | $1,149 | $1,217 | $1,030 |
| SF (1x1) | 730 | 500 | 774 | 717 | 735 | 691 | 610 |
| Rent/SF (1x1) | $1.66 | $2.23 | $1.74 | $1.71 | $1.56 | $1.78 | $1.69 |
| # Units (2x1) | 67 | 18 | 49 | 117 | 88 | 68 | 104 |
| Rent (2x1) | $1,306 | $1,262 | $1,410 | $1,439 | $1,310 | $1,345 | $1,220 |
| SF (2x1) | 922 | 915 | 957 | 1010 | 875 | 936 | 826 |
| Rent/SF (2x1) | $1.42 | $1.38 | $1.45 | $1.42 | $1.50 | $1.43 | $1.48 |
| # Units (3x1) | 14 | 14 | 8 | ||||
| Rent (3x1) | $1,798 | $1,798 | $1,350 | ||||
| SF (3x1) | 1,077 | 1,077 | 917 | ||||
| Rent/SF (3x1) | $1.67 | $1.67 | $1.47 | ||||
| Distance from Subject | 1.5 miles | 0.7 miles | 1.3 miles | 0.1 miles | 0.6 miles | 0.8 miles | N/A |
Sales Comparables
|
|
The Binford
|
Mountain High
|
Halsey Station
|
Glendoveer Estates
|
Averages
|
Subject
|
|---|---|---|---|---|---|---|
| Date | Jul-18 | Jan-18 | Aug-19 | Under Contract | ||
| Year Built | 1949 | 1995 | 1990 | 1973 | 1974 | |
| # of Units | 182 | 112 | 124 | 79 | 124 | 180 |
| Average SF/Unit | 1,004 | 1,170 | 997 | 896 | 1,017 | 748 |
| Purchase Price | $30,729,309 | $17,050,000 | $20,800,000 | $10,500,000 | $19,769,827 | $21,500,000 |
| $/Unit | $168,842 | $152,232 | $167,742 | $132,911 | $155,432 | $119,444 |
| Distance from Subject | 6.1 miles | 3.4 miles | 2.2 miles | 1.7 miles | 3.3 miles | N/A |
Sale and Lease Comparable information provided by CoStar, Axiometrics, and the Real Estate Company.
Market Overview
Per Costar, with substantial inventory but limited development, the Gresham/Far East submarket boasts below-average rents and vacancies. Tenants often come here after getting priced out of more expensive urban core areas. The submarket was a hotbed of foreclosures during the housing crisis. Many residents were forced to rent apartments in the area, which has contributed to strong fundamentals. Cumulative rent growth has been rapid, but income restraints may make it difficult to sustain such an accelerated pace of growth.
Until recently, the submarket remained quiet during Portland’s building boom. No new inventory delivered for six consecutive years, but a steady trickle of units began coming on line in 2017. Though these smaller projects have not significantly affected fundamentals, several larger communities are now beginning to come on line. Benefiting from low prices and continued interest from a mix of local and institutional players, submarket sales volume has exceeded $100 million for each of the past five years.
Per Axiometrics, effective rent in the Portland MSA increased 1.7% from $1,401 in 2Q19 to $1,434 in 3Q19, which resulted in an annual growth rate of 2.9%. Annual effective rent growth has averaged 2.7% since 2Q96. The market's annual rent growth rate was below the national average of 3.0%. Out of the 150 markets ranked by RealPage nationally, Portland-Vancouver-Hillsboro, OR-WA was 32nd for quarterly effective rent growth, and 79th for annual effective rent growth for 3Q19.
The market's occupancy rate increased from 96.1% in 2Q19 to 96.3% in 3Q19, and was up from 96.2% a year ago. The market's occupancy rate was below the national average of 96.4% in 3Q19. The market's occupancy rate has averaged 95.0% since 2Q96.
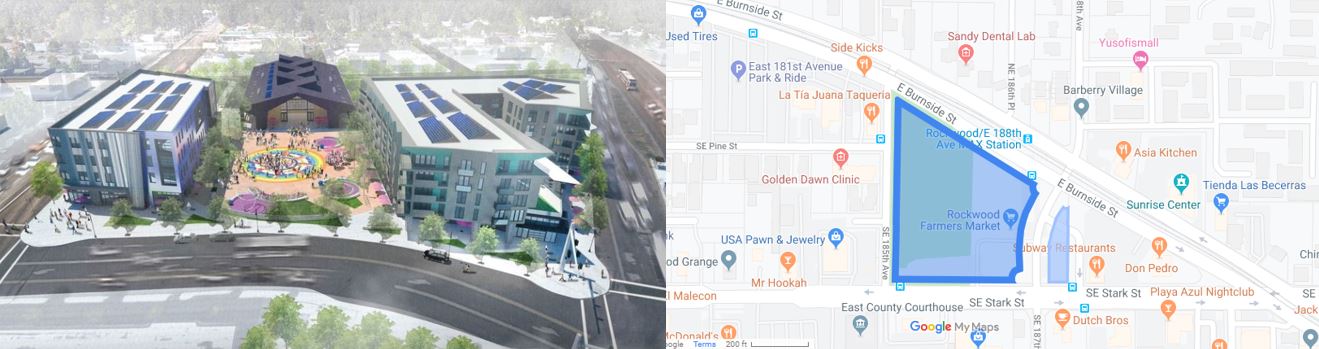
Nearby Development - Rockwood Rising
The City of Gresham Redevelopment Commission is developing over 200,000 square feet of new commercial, office and retail space, including over 100 new apartment homes 0.1 miles from the Property. Rockwood Rising is expected to be a bustling center featuring a market hall, a public plaza, and “Innovation Hub” offering job hunting assistance, technical training, and space for small business owners. The project is expected to deliver in 2021.
Demographic Information
| 1 Mile | 3 Miles | 5 Miles | |
|---|---|---|---|
| Population (2019) | 24,543 | 141,786 | 285,818 |
| Population (2024) | 25,695 | 148,519 | 299,957 |
| Average Age | 35 | 37 | 37 |
| Median Household Income | $44,252 | $50,253 | $54,060 |
| Average Household Size | 2.9 | 2.7 | 2.7 |
| Median Home Value | $226,697 | $254,503 | $269,102 |
| Population Growth (2019-2024) | 4.69% | 4.75% | 4.95% |
Demographic information above was obtained from CoStar.


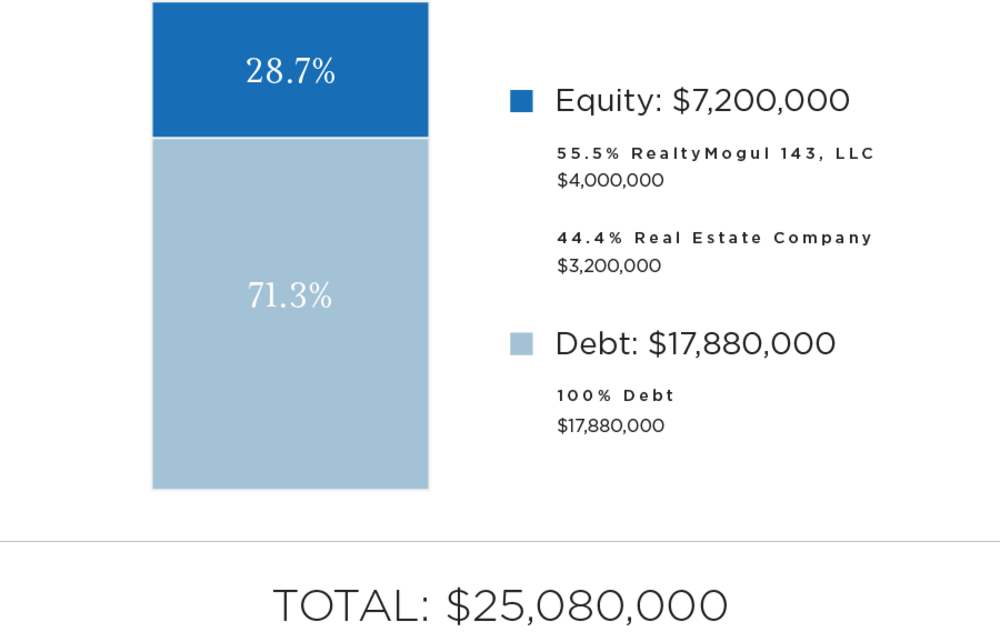
| Sources of Funds | Amount |
|---|---|
| Debt | $17,880,000 |
| Equity | $7,200,000 |
| Total Sources of Funds | $25,080,000 |
| Uses of Funds | Amount |
| Purchase Price | $21,500,000 |
| CapEx Reserve | $2,405,698 |
| Real Estate Company Acquisition Fee | $215,000 |
| Broker Dealer Fee | $160,000 |
| Lender Origination Fee | $178,800 |
| Taxes and Insurance Reserve | $99,879 |
| Working Capital | $50,000 |
| Other Closing and Pursuit Costs | $470,623 |
| Total Uses of Funds | $25,080,000 |
Please note that the Real Estate Company's equity contribution may consist of friends and family equity and equity from funds controlled by the Real Estate Company.e
The expected terms of the debt financing are as follows:
- Estimated Proceeds: $17,880,000
- Estimated Rate (Floating): 30-Day LIBOR + 275 basis points
- Amortization: None
- Interest Only: Full term
- Term: 2 years
- Extension Options: Two (2) one-year options to extend (0.25% fee for each)
- Exit Fee: 1.0%
There can be no assurance that a lender will provide debt on the rates and terms noted above, or at all. All rates and terms of the debt financing are subject to lender approval, including but not limited to possible increases in capital reserve requirements for funds to be held in a lender controlled capital reserve account.
Barberry Village, LLC intends to make distributions to Realty Mogul 143, LLC as follows:
- To the Members, pari passu, all excess cash flows and appreciation to a 10.0% IRR to the Members,
- 70.0 / 30.0 (70.0% to the Members / 30.0% to Promote) of excess cash flows and appreciation thereafter
Note that these distributions will occur after the payment of the Company's liabilities (loan payments, operating expenses and other fees as set forth in the LLC agreement, in addition to any member loans or returns due on member loans).
Realty Mogul 143, LLC will distribute 100% of its share of excess cash flow (after expenses and fees) to the members of Realty Mogul 143, LLC (the RealtyMogul.com investors).
Distributions are expected to start in December 2020 and are projected to continue on a quarterly basis thereafter. These distributions are at the discretion of the Sponsor, who may decide to delay distributions for any reason, including maintenance or capital reserves.
| Year 1 | Year 2 | Year 3 | |
|---|---|---|---|
| Effective Gross Revenue | $2,163,684 | $2,349,551 | $2,568,888 |
| Total Operating Expenses | $989,438 | $1,012,425 | $1,036,764 |
| Net Operating Income | $1,174,246 | $1,337,126 | $1,532,124 |
| Year 0 | 2020 | 2021 | 2022 | |
|---|---|---|---|---|
| Distributions to RealtyMogul 143, LLC Investors | ($4,040,000) | $149,239 | $238,695 | $6,028,176 |
| Net Earnings to Investor - Hypothetical $50,000 Investment |
($50,000) | $1,847 | $2,954 | $74,606 |
Certain fees and compensation will be paid over the life of the transaction. The following fees and compensation will be paid:
| Type of Fee | Amount of Fee | Received By | Paid From | Notes |
|---|---|---|---|---|
| Acquisition Fee | $215,000 | Real Estate Company | Capitalized Equity Contribution | 1.0% of the Property purchase price |
| Broker-Dealer Fee | $160,000 | North Capital (1) | Capitalized Equity Contribution | Greater of $50,000 or 4.0% of the equity raised by RealtyMogul 143, LLC |
| Construction Management Fee | 5.0% of Capital Expenditure Budget | Real Estate Company | Capitalized Equity Contribution |
| Type of Fee | Amount of Fee | Received By | Paid From | Notes |
|---|---|---|---|---|
| Management and Administrative Fee | 1.0% of amount invested in RealtyMogul 143, LLC | RM Manager, LLC | Distributable Cash | RM Manager, LLC is the Manager of RealtyMogul 143, LLC and a wholly-owned subsidiary of Realty Mogul, Co. (2) |
| Asset Management Fee | 1.0% of Effective Gross Income | Real Estate Company | Distributable Cash | |
| Property Management Fee | 3.0% of Effective Gross Income | Real Estate Company | Distributable Cash |
(1) North Capital Private Securities Corporation (“NCPS”), a registered broker-dealer who will act as placement agent for interests in the Company will be paid a fee as outlined above. NCPS will pay a referral fee to Mogul Securities, LLC (“MS”), an affiliate of the Manager and RealtyMogul, Co., for referring the transaction pursuant to a referral agreement between NCPS and MS. Certain employees of Realty Mogul, Co., an affiliate of Manager are registered representatives of, and are paid commissions by, NCPS.
(2) Fees may be deferred to reduce impact to investor distributions.
The above presentation is based upon information supplied by the Real Estate Company or others. Realty Mogul, Co., RM Manager, LLC, and The Company, along with their respective affiliates, officers, directors or representatives (the "RM Parties") hereby advise you that none of them has independently confirmed or verified any of the information contained herein. The RM Parties further make no representations as to the accuracy or completeness of any such information and undertake no obligation now or in the future to update or correct this presentation or any information contained herein.
RM Securities, LLC, its registered representatives, affiliates, associated persons, and personnel of its affiliates who may also be associated with it, including our associated persons and personnel of our affiliates who are also be associated with RM Securities, LLC (it (“RM Securities,” “we,” “our,” or “us”) will receive fees, expense reimbursements, and other compensation (“Fees”) from the issuer of this investment offering, its sponsor, or an affiliate thereof (“Sponsor”), or otherwise in connection with Sponsor’s offering. The Fees paid to us are in addition to other fees you will pay to Sponsor or in connection with Sponsor’s investment offering. You will pay Fees to Sponsor, either directly or indirectly as an investor in the Sponsor’s offering. Sponsor will use the Fees you pay, as well as funds you invest in the relevant offering, to compensate us. The Fees paid to us will directly or indirectly be borne by you as the investor (typically, but not always, in the form of an expense of the Sponsor’s offering in which you invest) because such Fees will reduce the proceeds available for distribution to you and reduce the amount you earn over time.
For more information on the Fees paid to us, or any other Fees you will pay in connection with Sponsor’s offering, please carefully review the Sponsor’s Investment Documents. Please also carefully review RM Securities’ Form CRS, Regulation Best Interest Disclosures, and Limited Brokerage Services Agreement.
No Approval, Opinion or Representation, or Warranty by RM Securities, LLCSponsor has provided, approved, and is solely responsible in all aspects for the information on this webpage (“Page”), including Sponsor’s offering documentation, which may include without limitation the Private Placement Memorandum, Operating or Limited Partnership Agreement, Subscription Agreement, the Project Summary and all exhibits and other documents attached thereto or referenced therein (collectively, the “Investment Documents”). The Investment Documents linked on this page have been prepared and posted by Sponsor, and not by RM Securities. We did not assist in preparing, do not adopt or endorse, and we are not otherwise responsible for, the Sponsor’s Investment Documents. We make no representations or warranties as to the accuracy of information on this Page or in the Sponsor’s Investment Documents and we accept no liability therefor. No part of the information on this Page or in the Sponsor’s Investment Documents is intended to be binding on us.
Sponsor’s Information Qualified by Investment DocumentsThe information on this Page is qualified in its entirety by reference to the more complete information about the offering contained in the Sponsor’s Investment Documents. The information on this Page is not complete and subject to change at the Sponsor’s discretion at any time up to the closing date. The Sponsor’s Investment Documents and supplements thereto contain important information about the Sponsor’s offering including relevant investment objectives, the business plan, risks, charges, expenses, and other information, which you should consider carefully before investing. The information on this Page should not be used as a basis for an investor’s decision to invest.
Risk of InvestmentThis investment is speculative, highly illiquid, and involves substantial risk. There can be no assurances that all or any of Sponsor’s assumptions, expectations, estimates, goals, hypothetical illustrations, or other aspects of Sponsor’s business plans (“Assumptions”) will be true or that actual performance will bear any relation to Sponsor’s Assumptions, and no guarantee or representation is made that Sponsor’s Assumptions will be achieved. If Sponsor does not achieve its Assumptions, your investment could be materially and adversely affected. A loss of part or all of the principal value of your investment may occur. You should not invest unless you can readily bear the consequences of such loss. Sponsor’s Assumptions should not be relied upon as the primary basis for your decision to invest.
No Reliance on Forward-Looking Statements; Sponsor AssumptionsSponsor is solely responsible for statements made concerning forward-looking statements and Assumptions, which apply only as of the date made, are preliminary and subject to change, and are expressly qualified in their entirety by the disclosures and cautionary statements included in Sponsor’s Investment Documents, which you should carefully review. Neither RM Securities nor Sponsor are obligated to update or revise such forward-looking statements or Assumptions to reflect events or circumstances that arise after the date made or to reflect the occurrence of unanticipated events. Sponsor’s forward-looking statements and Assumptions are hypothetical, not based on actual investment achievements or events, and are presented solely for purposes of providing insight into the Sponsor’s investment objectives, detailing Sponsor’s anticipated risk and reward characteristics, and establishing a benchmark for future evaluation of actual results; therefore, they are not a predictor, projection, or guarantee of future results. You should not rely on Sponsor’s forward-looking statements as a basis to invest.
Importantly, we do not adopt, endorse, or provide any assurance of returns or as to the accuracy or reasonableness of Sponsor’s Assumptions or forward-looking statements.
No Reliance on Past PerformanceAny description of past performance is not a reliable indicator of future performance and should not be relied upon as the primary basis to invest.
Sponsor’s Use of DebtA substantial portion of the total cost of the real estate asset acquired by the Sponsor with investor funds (“Property”) will be paid with borrowed funds, i.e., debt. Sponsor’s estimated rates and terms of the debt financing are subject to lender approval, and there is no assurance that the Sponsor will secure debt at the rates and terms presented on this Page or in the Sponsor’s Investment Documents, or at all. The use of borrowed money to acquire real estate is referred to as leveraging, which can amplify losses and could result in lender foreclosure. In addition, if the debt includes a variable (or “floating”) interest rate, the total amount of interest paid over the term of the debt will fluctuate and can increase. As a result, Sponsor’s use of debt can result in a loss of some or all of your investment.
Sponsor’s Offering is Not RegisteredSponsor’s securities offering will not be registered under the Securities Act of 1933, as amended (the “Securities Act”), in reliance upon the exemptions from registration pursuant to Rule 506(c) of Regulation D as promulgated under the Securities Act (“Private Placement”). In addition, the offering will not be registered under any state securities laws in reliance on exemptions from state registration. Such securities (your ownership interests) are subject to restrictions on transferability and resale and may not be transferred or resold except as permitted under applicable state and federal securities laws pursuant to registration or an available exemption. All Private Placements on the Platform are intended solely for “Accredited Investors,” as that term is defined in Rule 501(a) under the Securities Act.
No Investment AdviceNothing on this Page should be regarded as investment advice (either with respect to a particular security or regarding an overall investment strategy), a recommendation, an offer to sell, or a solicitation of or an offer to buy any security. Advice from a securities professional is strongly advised to understand and assess the risks associated with real estate or private placement investments. For additional information on RM Securities’ involvement in this offering, please carefully review the Sponsor’s Investment Documents, and RM Securities’ Form CRS, Regulation Best Interest Disclosures, and Limited Brokerage Services Agreement.
1031 Exchange RiskInternal Revenue Code Section 1031 (“Section 1031”) contains complex tax concepts and certain tax consequences may vary depending on the individual circumstances of each investor. RM Securities and its affiliates make no representation or warranty of any kind with respect to the tax consequences of your investment or that the IRS will not challenge any such treatment. You should consult with and rely on your own tax advisor about the tax aspects with respect to your particular circumstances.