The team at our affiliated broker-dealer, RM Securities, conducts diligence on of the issuer, including detailed background checks, criminal checks, bad actor checks, and reference checks on sponsors. In addition to screening for any criminal background, we may also turn down sponsors due to poor reference checks, even if the background and criminal checks are satisfactory.
We require unaffiliated sponsors to use an unaffiliated third-party escrow agent.* When an investor makes an investment with such sponsors using the RealtyMogul platform, the investor’s money is transferred directly into a third-party escrow account. All closing conditions in connection with a sponsor’s contingency offering need to be met before the third-party escrow agent will approve releasing investor funds to the issuer or general partner. For example, if an issuer or general partner plans to use funds for a real estate acquisition that does not ultimately transact, the third-party escrow agent will not transfer investor funds to the issuer or general partner, and funds will be returned to investors.
* Unless otherwise disclosed, escrow accounts are not required for some investments that accommodate 1031 investments where the property is already acquired.
Our processes typically includes visiting certain properties (or a subset of properties if it's a fund) to confirm the real estate is what and where the real estate is supposed to be. For certain properties that accommodate 1031 exchange investments, the team will review third-party prepared due diligence reports in lieu of a site visit.
We have formalized processes and checklists for every private placement deal listed on the platform.


Inception Investors, LLC
Inception Investors is a private real estate investment and operating company that was founded in 2012. The company is headquartered in New York City and has offices in Brooklyn and Manhattan.
The Sponsor’s investment strategy is to acquire properties with attractive growth potential through a combination of active property and asset management and market growth. They generally target cash flowing Class-B multifamily properties and give key consideration to the following criteria:
- Gentrifying Tri-state area markets with high population density and strong market fundamentals.
- Capitalize on shifts in demographic trends and property investments that include an increased preference for urban living by baby boomers, millennials, and young professionals as well as assets that are in close proximity to transit or places of employment.
RealtyMogul.com has invested in three prior transactions with The Real Estate Company (New Jersey Multifamily, Brooklyn Multifamily and 497 Dean Street). As of Q2 2017, NOI over the previous year at New Jersey Multifamily is trending at 44.5% above proforma. At Brooklyn Multifamily, the Real Estate Company has completed five unit buyouts and renovations since the purchase of the property in July 2016, outperforming underwritten expectation of three unit buyouts and renovations during this timeframe. Renovated units are achieving a 57.6% increase in rents vs. previously in-place rent, which is greater than the 36.0% increase contemplated in the RM Estimated Financials for that property. 497 Dean Street was closed on in August 2017 and while no distribution was underwritten until March 2018 The Real Estate Company distributed to Realty Mogul in November 2017, approximately a quarter ahead of schedule.
The Real Estate Company's Track Record (includes transactions the management team completed as Principals of other firms prior to joining Clairmont and Inception Investors)
http://www.inceptioninvestors.com-
 Ryan Colbert, Managing Partner
 -
 Chesky Engel, Managing Partner
Mr. Colbert has over a decade of institutional real estate equity investment experience in both domestic & international markets and has acquired over $1 billion worth of commercial real estate. His experience includes investments in distressed real estate & note purchases, recapitalizations, JV partner buy-outs and direct secondary investing across all major asset classes.
Mr. Colbert was a Director at Madison Marquette and formerly a Vice President at the Lightstone Group, one of the nation’s largest real estate investment firms. While at Madison Marquette, he closed over $400 million of multifamily, office and retailacquisitions. While at the Lightstone Group, he was responsible for rebuilding the firm’s hospitality portfolio as well as expanding its existing multifamily portfolio, closing over $100 million of acquisitions during his tenure. Prior to joining Lightstone Group, Mr. Colbert was a member of the investment team at Madison International Realty, a real estate private equity firm focused on the acquisition of direct secondary’s and structured equity investments. While at Madison International Realty he was involved in the recapitalization of over $200 million of real estate.
Mr. Colbert holds a Series 7 & 63 license and completed his dual-undergraduate degree in Political Science & Finance with minors in German Studies & Law at Cornell University.
Mr. Engel is Co-Founder & Managing Member of Inception Investors with primary responsibility for operational excellence, transaction sourcing, construction and development. Mr. Engel is responsible for daily operations, transaction sourcing, construction and development of Inception Investor's transactions in the Tri-state area. Mr. Engel brings 20 year's investing experience in New York City real estate and is a Brooklyn native. Mr. Engel has been involved in numerous high-profile re-development and re-positioning projects which have been featured in the Real Deal, Brownstoner, and Crain's New York Business. Mr. Engel has also completed over $1 billion of transactions in the New York City area including investments in distressed real estate & note purchases, recapitalizations and JV partner buy-outs across all asset classes. Mr. Engel holds a Bachelor's Degree from Gateshead Talmudical College in Gateshead, United Kingdom.
| Investment | Date of Initial Investment | Date of Liquidation | Property Type | Property Location | Market Value(a) | Invested & Committed Capital(b) |
|---|---|---|---|---|---|---|
| Fairfield Inn | Jul-10 | TBD | Hotel | East Rutherford, NJ | $18,700,000 | $3,940,983 |
| Everson Pointe(c) | Dec-10 | Jan-15 | Retail | Atlanta, GA | 9,000,000 | 4,664,000 |
| TownePlace Suites | Jan-11 | TBD | Hotel | Metairie, LA | 15,300,000 | 6,055,449 |
| Rego Park(c) | Mar-11 | TBD | Multifamily | Queens, NY | 19,000,000 | 15,132,500 |
| Crowne Plaza Boston North Shore | Mar-11 | TBD | Hotel | Danvers, MA | 27,000,000 | 23,590,184 |
| Holiday Inn Express(c) | Jun-11 | TBD | Hotel | East Brunswick, NJ | 9,000,000 | 6,196,498 |
| Crowe's Crossing | Oct-11 | TBD | Retail | Atlanta, GA | 12,000,000 | 2,069,210 |
| Marriott Courtyard(c) | Nov-11 | TBD | Hotel | Parsippany, NJ | 10,000,000 | 11,925,000 |
| DePaul Plaza Shopping Center | Nov-11 | TBD | Retail | St. Louis, MO | 20,000,000 | 8,745,154 |
| Shasta Crossroads | Dec-11 | Dec-14 | Retail | Redding, CA | 9,000,000 | 6,954,373 |
| Hampton Inn | Mar-12 | TBD | Hotel | Woodbridge, VA | 10,500,000 | 4,021,019 |
| Meridian Village | Apr-12 | TBD | Retail | Bellingham, WA | 15,000,000 | 4,225,100 |
| Washington Business Park | Sep-12 | Dec-12 | Office | Lanham, MD | 45,000,000 | 11,000,000 |
| The Center Building | Dec-12 | Mar-15 | Office | Queens, NY | 84,500,000 | 18,947,840 |
| Cotton Exchange Hotel | Mar-13 | Jun-13 | Hotel | New Orleans, LA | 30,000,000 | 13,600,130 |
| 331 Carroll Street | Aug-13 | TBD | Multifamily | Orange, NJ | 1,250,000 | 725,000 |
| 7000 Central Park | Sep-13 | TBD | Office | Atlanta, GA | 75,000,000 | 13,264,192 |
| The Edge | Dec-13 | TBD | Retail | Brooklyn, NY | 45,500,000 | 19,445,772 |
| Free Market Portfolio | Dec-13 | TBD | Multifamily | Brooklyn, NY | 5,000,000 | 916,187 |
| Paces Village Apartments | Dec-13 | TBD | Multifamily | Greensboro, NC | 15,000,000 | 4,379,994 |
| Marina Shores Apartments | Mar-14 | TBD | Multifamily | Virginia Beach, VA | 54,000,000 | 18,292,593 |
| 23 Harvard Street | Jul-14 | TBD | Multifamily | East Orange, NJ | 1,000,000 | 500,000 |
| Broad Street Apartments | Sep-14 | TBD | Multifamily | Richmond, VA | 11,000,000 | 3,144,136 |
| BankNote Building | Sep-14 | TBD | Office | Bronx, NY | 120,000,000 | 28,204,512 |
| Eastern Parkway Portfolio | Oct-14 | TBD | Multifamily | Brooklyn, NY | 10,000,000 | 2,287,600 |
| Brooklyn 9 Portfolio | Aug-15 | TBD | Multifamily | Brooklyn, NY | 30,000,000 | 7,137,217 |
| Park Avenue Apartments | Mar-16 | TBD | Multifamily | Plainfield, NJ | 3,000,000 | 1,100,000 |
| 330 E. 22nd St. | Jul-16 | TBD | Multifamily | Brooklyn, NY | 5,000,000 | 1,859,504 |
| 509 Saratoga Avenue | Jun-17 | TBD | Multifamily | Brooklyn, NY | 7,500,000 | 3,045,956 |
| 497 Dean Street | Aug-17 | TBD | Multifamily | Brooklyn, NY | 2,875,000 | 1,645,500 |
| Total Portfolio | $721,250,000 | $246,993,699 |
(a) Purchase price, UPB, or appraised value, whichever is greater at time of acquisition.
(b) Includes capitalized expenses allocated to each investment and co-investments made by third parties.
(c) Invested & committed capital represents Day One equity investment. Performance expectations include assumed refinancing distribution upon asset stabilization.
Note: The management overview and track record detailed above was provided by the Sponsor and has not been verified by RealtyMogul.com or NCPS.
In this transaction, RealtyMogul.com investors are to invest in Realty Mogul 97, LLC ("The Company"), which is to subsequently invest in Vinegar Hill Asset, LLC ("The Target"), a limited liability company that will hold title to the Portfolio. Inception Investors, LLC (the "Real Estate Company") purchased the Portfolio in August 2015 for $26.3 million ($234,821 per unit) and the current total accrued project cost is approximately $28.25 million ($252,219 per unit).
The Real Estate Company has been executing on its business plan is to implement a value-add strategy by completing interior and exterior renovations across the Portfolio since its acquisition of the Portfolio in 2015. The majority of the Portfolio is subject to New York City Rent Guidelines Board ("NYC RGB") rent stabilization code, which dictates the manners in which landlords may increase rents on rent stabilized units in New York City. The most effective manner in increasing rents on rent stabilized units in New York City is to vacate units which have been occupied for greater than two years, either through tenant buyouts or natural tenant roll, then renovate and release those units. Per the NYC RGB, a unit which has been occupied by the same tenant for a consecutive period of greater than two years is eligible for a 20% increase in rental rate upon releasing the unit (see 'NYC RGB Fact Sheet - Vacancy Leases' attached to the Financials tab of this offering). Additionally, landlords may further increase rents for rent stabilized units by completing pre-approved capital improvements. Rents for renovated units are subject to the Individual Apartment Improvement (IAI) rules which limit rent increases to 1/40th of the cost of construction for properties with 35 units or less (see 'NYC RGB Fact Sheet - Individual Apartment Improvements' attached to the Financials tab of this offering). Since the acquisition of the Portfolio in 2015, The Real Estate Company has executed on 15 tenant rollover and renovations which have increased the income generated by those units by approximately $175,000. While units are not turned the maximum allowable rental increase is dictated by the NYC RGB. The maximum allowable rental increase guidelines are set once a year and are effective for leases beginning on or after October 1st of each year. For the first year of the hold period of the Portfolio the maximum allowable rental increase for occupied units is to be 1.25%. Historical maximum allowable increases per the NYC RGB may be found as 'NYC RGB Fact Sheet - Historical Orders' attached to the Financials tab of this offering.
The Company's investment into The Target will retire an existing preferred equity investment in the Portfolio and provide the Real Estate Company with approximately $950,000 to buyout and renovate an estimated additional 19 units over The Company's three year estimated hold period of the Portfolio. The Real Estate Company intends to hold the Portfolio for three (3) years while executing the business plan before selling the Portfolio at an anticipated exit cap rate of 5.00%.
| CapEx Item | $ Amount |
|---|---|
| Sheetrock | $3,000 |
| Moldings | $1,500 |
| Electrical Work | $2,800 |
| Plumbing Work | $2,400 |
| Kitchen Cabinets | $1,000 |
| Kitchen Sink | $500 |
| Kitchen Faucet | $400 |
| Bathroom Tub & Plumbing | $3,500 |
| Toilet | $350 |
| Toilet Seat | $100 |
| Bathroom Vanity | $350 |
| Bathroom Faucet | $150 |
| Bathroom Medicine Cabinet | $150 |
| Flooring | $2,900 |
| Light Fixtures | $650 |
| Smoke Alarms | $250 |
| Closet Work | $2,000 |
| Intercoms in Apartments | $1,000 |
| Paint Entire Apartment | $2,000 |
| Total | $25,000 |
Realty Mogul has invested in two prior transactions with The Real Estate Company (497 Dean Street and Brooklyn Multi-family). As of Q2 2017 the Sponsor has completed five unit buyouts and renovations since the purchase of the property in July 2016, outperforming underwritten projections of three unit buyouts and renovations during this timeframe. Renovated units are achieving a 57.6% increase in rents vs. previously in-place rent, which is greater than the 36.0% increase contemplated in the RM Estimated Financials for that property. 497 Dean Street was closed on in August 2017 and as such no material operating history for this property is yet available.
Built between 1920 and 1935, the Portfolio consists of 112 multifamily units, comprising 99,680 rentable square feet, across seven separate properties located in various neighborhoods of Brooklyn, New York. The unit mix is comprised of 30 one-bedroom, 57 two-bedroom, and 25 three-bedroom apartments with a weighted average size and rent per unit of 895 square feet and $1,488 per unit ($1.67 per square foot), respectively (per the 09/25/2017 rent roll). The Portfolio was 99.1% occupied as of 9/25/17. The Portfolio has no parking, but this is consistent with older, walk-up, low-rise properties in the Brooklyn market.
| Property | 2015 Acquisition Price | # of Units | Unit (Square Feet) | Total Square Feet | Rent per Unit | Rent per Square Foot |
|---|---|---|---|---|---|---|
| 226 Pulaski Street | $3,500,000 | 12 | 875 | 10,500 | $1,606 | $1.84 |
| 642 Wilson Avenue | $2,700,000 | 6 | 813 | 4,875 | $2,270 | $2.79 |
| 1226 Lincoln Place | $7,600,000 | 31 | 924 | 28,647 | $1,587 | $1.72 |
| 1639 Carroll Street | $3,000,000 | 17 | 728 | 12,376 | $1,111 | $1.53 |
| 3013-3019 Newkirk Avenue | $4,700,000 | 18 | 1,075 | 19,350 | $1,686 | $1.57 |
| 83-85 East 94th Street | $2,400,000 | 16 | 875 | 14,000 | $1,154 | $1.32 |
| 436 East 34th Street | $2,400,000 | 12 | 875 | 10,504 | $1,408 | $1.61 |
| Totals/Averages | $26,300,000 | 112 | 895 | 100,252 | $1,488 | $1.67 |
Bedford-Stuyvesant/Bushwick
222-266 Pulaski Street & 642 Wilson Avenue
| Lease Comparables | 729 Lafayette Ave | 1342 Hancock St | 1334 Hancock St | 1500 Bushwick Ave | 638 Wilson Ave | Total / Averages |
642 Wilson Ave |
226 Pulaski St |
|---|---|---|---|---|---|---|---|---|
| Occupancy | 100 | 100 | 100 | 100 | 100 | 100 | 100 | 100 |
| Units (#) | 17 | 5 | 5 | 12 | 6 | 9 | 6 | 12 |
| Year Built | 1931 | 1906 | 1906 | 1906 | 1906 | 1911 | 1931 | 1931 |
| Average SF (per unit) | 1210 | 732 | 732 | 750 | 750 | 835 | 813 |
875 |
| Average Rental Rate (unit) | $3,214 | $1,031 | $985 | $1,813 | $1,251 | $1,658 | $2,118 |
$1,755 |
| Average $/SF | $2.66 | $1.41 | $1.35 | $2.42 | $1.67 | $1.90 | $2.82 |
$2.51 |
| Distance from Subject | 0.2 mi | 0.4 mi | 0.4 mi | 0.4 mi | 0.1 mi | 0.3 mi | - | - |
| Sale Comparables | 17-21 Woodbine St | 255 Himrod St | 96 Malcolm X Blvd | 888 Flushing Ave | 317 Putnam Ave | Total / Averages | 642 Wilson |
226 Pulaski St |
|---|---|---|---|---|---|---|---|---|
| Date | April - 15 | January - 15 | January - 15 | June - 14 | March - 15 | |||
| # of Units | 6 | 6 | 8 | 8 | 6 | 7 | 6 | 12 |
| Year Built | 1930 | 1931 | 1931 | 1931 | 1931 | 1931 | 1931 | 1931 |
| Average SF (per Unit) | 812 | 750 | 793 | 875 | 1066 | 852 | 813 | 875 |
| Purchase Price | $2,750,000 | $1,950,000 | $2,1665,000 | $2,720,000 | $3,350,000 | $2,587,000 | $2,510,625 | $3,776,400 |
| $/Unit | $458,333 | $325,000 | $270,625 | $340,000 | $558,333 | $390,458 | $418,438 | $314,700 |
| Cap Rate | - | - | - | 5.49% | 5.28% | 5.39% | - | - |
| Distance | 1.2 mi | 1.3 mi | 1.7 mi | 2.0 mi | 1.0 mi | 1.4 mi | - | - |
Lease and Sale Comparable information provided by 2015 acquisition appraisals completed for 226 Pulaski Street.
Crown Heights
1226 Lincoln Place & 1639 Carroll Street
| Lease Comparables | Landing At Acworth | Legacy At Acworth | Walden Ridge | Shiloh Green | Greenhouse | Total / Averages | Subject | Subject |
|---|---|---|---|---|---|---|---|---|
| Occupancy | 92% | 97% | 94% | 99% | 94% | 95% | 96% | 96% |
| Units (#) | 234 | 192 | 210 | 235 | 489 | 272 | 216 | 216 |
| Year Built | 2001 | 1998 | 2002 | 1996 | 1985 | 1996 | 1988 | 1988 |
| Average SF (per unit) | 948 | 1,103 | 1,079 | 1,357 | 893 | 1,076 | 683 | 683 |
| Average Rental Rate (unit) | $1,132 | $983 | $1,263 | $1,217 | $1,039 | $1,127 | $817 | $817 |
| Average $/SF | $1.19 | $0.89 | $1.17 | $0.90 | $1.16 | $1.06 | $1.20 | $1.20 |
| Distance from Subject | 0.7 mi | 0.8 mi | 2.8 mi | 3.8 mi | 4.8 mi | 2.6 mi | - | - |
| Sale Comparables | Mountain Park Estates | ARIUM Kennesaw | Bridges of Kennesaw | Waldan Pond | The 1800 At Barrett Lakes | Total / Averages | Subject Property | Subject Property |
|---|---|---|---|---|---|---|---|---|
| Date | March-16 | September-15 | August-15 | August-15 | November-14 | |||
| # of Units | 450 | 324 | 296 | 124 | 500 | 339 | 216 | 216 |
| Year Built | 1999 | 1989 | 1996 | 1986 | 1988 | 1992 | 1988 | 1988 |
| Average SF (per Unit) | 1,181 | 925 | 1,162 | 957 | 1,080 | 1,061 | 683 | 683 |
| Purchase Price | $64,000,000 | $29,250,000 | $35,008,500 | $7,800,000 | $49,000,000 | $37,011,700 | $16,000,000 | $16,000,000 |
| $/Unit | $142,222 | $90,278 | $118,272 | $62,903 | $98,000 | $102,335 | $74,074 | $74,074 |
| Cap Rate | - | - | 5.70% | 6.50% | - | 6.10% | 7.84% | 7.84% |
| Distance | 4.0 mi | 6.1 mi | 2.5 mi | 4.7 mi | 8.6 mi | 5.18 mi | - | - |
Lease and Sale Comparable information provided by 2015 acquisition appraisals completed for 1226 Lincoln Place.
Ditmas Park/Flatbush
3013-3019 Newkirk Avenue, 83-85 East 94th Street & 436 East 34th Street
| Lease Comparables | Landing At Acworth | Legacy At Acworth | Walden Ridge | Shiloh Green | Greenhouse | Total / Averages | Subject | Subject | Subject |
|---|---|---|---|---|---|---|---|---|---|
| Occupancy | 92% | 97% | 94% | 99% | 94% | 95% | 96% | 96% | 96% |
| Units (#) | 234 | 192 | 210 | 235 | 489 | 272 | 216 | 216 | 216 |
| Year Built | 2001 | 1998 | 2002 | 1996 | 1985 | 1996 | 1988 | 1988 | 1988 |
| Average SF (per unit) | 948 | 1,103 | 1,079 | 1,357 | 893 | 1,076 | 683 | 683 | 683 |
| Average Rental Rate (unit) | $1,132 | $983 | $1,263 | $1,217 | $1,039 | $1,127 | $817 | $817 | $817 |
| Average $/SF | $1.19 | $0.89 | $1.17 | $0.90 | $1.16 | $1.06 | $1.20 | $1.20 | $1.20 |
| Distance from Subject | 0.7 mi | 0.8 mi | 2.8 mi | 3.8 mi | 4.8 mi | 2.6 mi | - | - | - |
| Sale Comparables | Mountain Park Estates | ARIUM Kennesaw | Bridges of Kennesaw | Waldan Pond | The 1800 At Barrett Lakes | Total / Averages | Subject Property | Subject Property | Subject Property |
|---|---|---|---|---|---|---|---|---|---|
| Date | March-16 | September-15 | August-15 | August-15 | November-14 | ||||
| # of Units | 450 | 324 | 296 | 124 | 500 | 339 | 216 | 216 | 216 |
| Year Built | 1999 | 1989 | 1996 | 1986 | 1988 | 1992 | 1988 | 1988 | 1988 |
| Average SF (per Unit) | 1,181 | 925 | 1,162 | 957 | 1,080 | 1,061 | 683 | 683 | 683 |
| Purchase Price | $64,000,000 | $29,250,000 | $35,008,500 | $7,800,000 | $49,000,000 | $37,011,700 | $16,000,000 | $16,000,000 | $16,000,000 |
| $/Unit | $142,222 | $90,278 | $118,272 | $62,903 | $98,000 | $102,335 | $74,074 | $74,074 | $74,074 |
| Cap Rate | - | - | 5.70% | 6.50% | - | 6.10% | 7.84% | 7.84% | 7.84% |
| Distance | 4.0 mi | 6.1 mi | 2.5 mi | 4.7 mi | 8.6 mi | 5.18 mi | - | - | - |
Lease and Sale Comparable information provided by 2015 acquisition appraisals completed for 3013-3019 Newkirk Avenue.
Market Overview
Per CoStar, New York vacancies are below 3% despite the delivery of nearly 25,000 units since 2016, which speaks to the market's impressive demand.
The expiration of 421-A was a paradigm shifter for New York. The market is projected to welcome around 50,000 units of supply in the near term, but a few years of absent tax abatement could mean a short break in the pipeline. A constricted lending environment could further limit supply growth in the outer years of the forecast. The replacement for 421-A, "Affordable New York," passed its final steps of the legislative process in April 2017. Although very similar to 421-A, the controversial new bill increases the minimum wages for construction workers. But developers paying those wages can receive a 35-year tax break versus the previous 25 years for 421-A.
Increased competition is already taking a toll at the top of the market. Rent growth for the metro decelerated by around 200 basis points from 2015-2016. Luxury assets in particular are feeling the pinch, with 4 & 5 Star rent growth over the previous 12 months more than 300 basis points below growth in the 3 Star segment. Despite rent growth decreasing, New York still contains seven of the nation's top 10 most expensive submarkets.
A low-interest-rate environment and global uncertainty are supporting lofty valuations across the metro. The market's median price tops $220,000/unit, and cap rates have compressed to less than 4%. Still, returns on residential investment in New York don't look too soft when compared with yields on government-issued bonds.
Instability stemming from Brexit, coupled with other global weaknesses, should further drive demand for residential assets in the metro. To be fair, uncertainty in the global economy has apparently instigated a decline in investment volume, with 2016 sales at just 75% of the previous year's volume, but on the balance, global unsteadiness could benefit owners here, because New York residential assets continue to be viewed as a global safe haven.
Submarket Overview - Bedford-Stuyvesant/Bushwick
222-266 Pulaski Street & 642 Wilson Avenue
Per CoStar, Affordability and various public transportation options are driving demand - and thus gentrification - in this submarket. And while new supply in 2015 was the highest it's been in the past 15 years, demand has outpaced the historic average and provided some counterbalance to the rapid inventory growth. As a result, 2016 ended with vacancies below the submarket's historical level. Still, about 15% of inventory is under construction in the submarket - with 3% of inventory delivered thus far in 2017 - and vacancies have already begun to inch upwards. Rent growth over 2016 superseded the submarket's historical average growth rate despite supply additions, though gains have slowed considerably relative to the year prior. Investors seem keen on Bed-Stuy/Fort Greene/Bushwick - the submarket logged more transactions in the four quarters ending 16Q4 than any other submarket in the New York metro, resulting in sales volume close to $625 million.
| Distance from Property | 1 Mile | 3 Miles | 5 Miles |
| Population (2017) | 196,466 | 1,280,360 | 3,055,353 |
| Population (2022) | 204,636 | 1,334,139 | 3,162,929 |
| Population Growth (2017-2022) | 4.2% | 4.2% | 3.5% |
| Median HH Income | $40,710 | $53,122 | $62,854 |
| Median Home Value | $702,931 | $738,490 | $681,719 |
All demographic information above was obtained from CoStar.
Submarket Overview - Crown Heights
1226 Lincoln Place & 1639 Carroll Street
Per CoStar, Despite a high concentration of renters and relatively affordable rents, supply and demand in Crown Heights/Prospect Lefferts Gardens have lagged behind the metro average, with residents and developers focusing on submarkets further north and west. However, as gentrification intensifies and potential zoning changes in East New York are implemented, developments to accommodate more residents may soon appear. Vacancy is below its historical average - registering at less than 2%. Rents here remain well below those of nearby submarkets, which has been a major draw for young residents. Construction was limited in the past few years, but several projects - accounting for about 750 units - are underway. Most of these developments will be in the western half of the submarket, but the potential rezoning of East New York may eventually lead to more development east of Broadway Junction. Year-to-date sales have been well distributed across the submarket, possibly in anticipation of future changes. Sales volume dropped off appreciably over the year ending in 16Q4 - clocking in at less than half the volume posted over the year ending in 15Q4. This is partially skewed by 2015's standout year, when close to 10% of inventory turned over. Median price per unit is appreciating rapidly, but remains roughly 20% below the metrowide median.
| Distance from Property | 1 Mile | 3 Miles | 5 Miles |
| Population (2017) | 191,239 | 1,372,889 | 2,737,988 |
| Population (2022) | 198,896 | 1,426,296 | 2,832,482 |
| Population Growth (2017-2022) | 4.0% | 3.9% | 3.5% |
| Median HH Income | $38,949 | $49,678 | $55,838 |
| Median Home Value | $646,310 | $619,454 | $659,148 |
All demographic information above was obtained from CoStar.
Submarket Overview - Ditmas Park/Flatbush
3013-3019 Newkirk Avenue, 83-85 East 94th Street & 436 East 34th Street
Per CoStar, Like many parts of Brooklyn relatively close to Manhattan, Ditmas Park/Flatbush has drawn an inflow of new residents with higher salaries. However, the difference here is that they’re not driving demand for high-end product. This predominantly residential submarket has long been a destination for homebuyers, resulting in limited demand for multifamily properties, which is not altogether surprising given the extremely low vacancy here. This area has experienced much less growth than other parts of Brooklyn, despite rents that are roughly 30% lower than the metro area’s, and this can partially be attributed to the lack of retail and entertainment options.
While only 70 units delivered in 2016, about 350 are still under construction, the highest number since 2000. While this is just a fraction of the activity seen in other Brooklyn submarkets, construction may be worth watching here, particularly as prices in adjacent areas continue to rise and the population here continues to grow. In a submarket where local players have historically driven sales, institutional investors are increasingly getting involved. Sales volume for 2015 reflected this trend, nearing $355 million, more than twice the value in 2014. At about $240 million, sales volume in 2016 dropped off from its 2015 peak but is still roughly 50% above the submarket’s historical average.
| Distance from Property | 1 Mile | 3 Miles | 5 Miles |
| Population (2017) | 186,330 | 1,264,952 | 2,634,276 |
| Population (2022) | 193,900 | 1,310,438 | 2,727,332 |
| Population Growth (2017-2022) | 4.1% | 3.6% | 3.5% |
| Median HH Income | $47,798 | $54,444 | $53,019 |
| Median Home Value | $450,376 | $663,213 | $673,019 |
All demographic information above was obtained from CoStar.


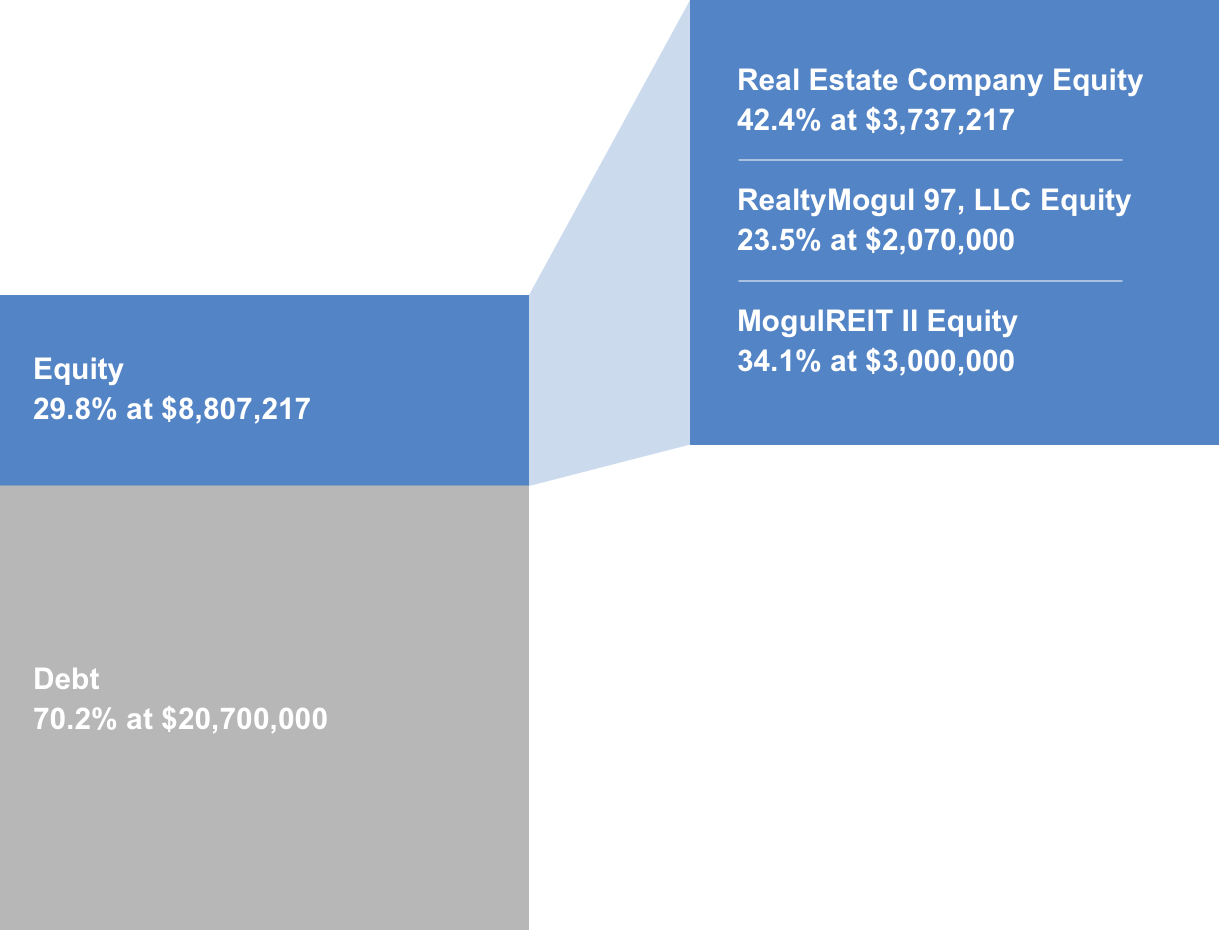
| Sources of Funds | Cost |
|---|---|
| Debt | $20,700,000 |
| Equity | $8,807,217 |
| Total Sources of Funds | $29,507,217 |
| Uses of Funds | Cost |
| Purchase Price | $26,300,000 |
| Buyout & Unit Renovation Reserve | $954,236 |
| MogulREIT II Acquisition Fee | $143,993 |
| North Capital Broker Dealer Fee | $97,970 |
| Existing Preferred Equity Accrued Payoff | $411,301 |
| Real Estate Company Initial Closing Costs and Reserves | $1,549,717 |
| Fresh Working Capital | $50,000 |
| Total Uses of Funds | $29,507,217 |
The general terms of the debt financing are as follows:
- Lender: New York Community Bank
- Loan Origination Date: August 2015
- Initial Proceeds: $20,700,000
- Rate: 3.00% Fixed (see Note below)
- Interest Only Period: Two (2) years
- Amortization: 30 year schedule, commencing at the expiration of the Interest Only Period
- Term: Five (5) years
- Prepayment Penalty: 2.0% penalty through August 2018, then 1.0% through August 2020, none thereafter.
Note: The senior loan is a 10 year loan with an initial five year term at 3.0% fixed with two years I/O before a 30 year amortization schedule. At the conclusion of the fifth year of the senior loan the loan is open for prepayment at par. However, the interest rate on the loan increases to the Prime rate (4.25% as of 10.16.17) + a spread of 2.75%, with the amortization schedule of the loan decreasing to 27 years at such time. The expectation is that the Portfolio will be sold soon after the change in interest rate event occurs.
There can be no assurance that a lender will provide debt on the rates and terms noted above, or at all. All rates and terms of the debt financing are subject to lender approval, including but not limited to possible increases in capital reserve requirements for funds to be held in a lender controlled capital reserve account.
The Target will make distributions to investors (The Company and Real Estate Company, collectively, the "Members") as follows:
Operating Cash Flow
- First, to Members for any accumulated unpaid 7% preferred return,
- Second, a cumulative quarterly-compounded 7% annual preferred return,
- Then, any excess balance will be split 75% to Members pari passu and 25% to Sponsor.
Capital Events (sale, refinance)
- First, to Members for any accumulated unpaid 7% preferred return,
- Second, return of capital,
- Then, any excess balance will be split 75% to Members pari passu and 25% to Sponsor to an 18% IRR Hurdle,
- Then, any excess balance will be split 55% to members pari passu and 45% to Sponsor.
Note that these distributions will occur after the payment of the Company's liabilities (loan payments, operating expenses and other fees as set forth in the LLC agreement, in addition to any member loans or returns due on member loans).
The Company will distribute 100% of its share of excess cash flow (after expenses) to the members of The Company (the RealtyMogul.com investors). The manager of The Company will receive a portion (up to 10% pro-rata) of the Real Estate Company's promote interest. Distributions are projected to start in June 2018 and are projected to continue on a quarterly basis thereafter. These distributions are at the discretion of the Real Estate Company, who may decide to delay distributions for any reason, including maintenance or capital reserves.
| Year 1 | Year 2 | Year 3 | |
|---|---|---|---|
| Effective Gross Revenue | $2,106,430 | $2,276,122 | $2,361,070 |
| Total Operating Expenses | $636,009 | $654,935 | $670,735 |
| Net Operating Income | $1,470,421 | $1,621,197 | $1,690,335 |
| Year 0 | 2017 | 2018 | 2019 | 2020 | |
|---|---|---|---|---|---|
| Distributions to Realty Mogul 97, LLC Investors |
($2,095,000) | $0 | $72,131 | $102,295 | $3,151,371 |
| Net Earnings to Investor - Hypothetical $50,000 Investment |
($50,000) | $0 | $1,722 | $2,441 | $75,212 |
Certain fees and compensation will be paid over the life of the transaction. The following fees and compensation will be paid:
| Type of Fee | Amount of Fee | Received By | Paid From | Notes |
|---|---|---|---|---|
| Acquisition Fee | $143,993 | RM Advisor, LLC | Capitalized Equity Contribution | 0.5475% of the Property purchase price. RM Advisor, LLC is the Manager of MogulREIT II and a wholly-owned subsidiary of Realty Mogul, Co. |
| Disposition Fee | 0.5475% of Gross Sale Proceeds | RM Advisor, LLC | Distributable Cash | RM Advisor, LLC is the Manager of MogulREIT II and a wholly-owned subsidiary of Realty Mogul, Co. |
| Broker-Dealer Fee | $97,970 | North Capital (1) | Capitalized Equity Contribution | 4.85% based on the amount of equity invested by Realty Mogul 97, LLC. |
| Construction Management Fee | 10.0% of total costs | Real Estate Company | Capitalized Equity Contribution |
| Type of Fee | Amount of Fee | Received By | Paid From | Notes |
|---|---|---|---|---|
| Property Management Fee | 4.0% of effective gross revenues | EEP Management, LLC, a third party property management firm | Operating Cash Flow | |
| Asset Management Fee | $20,000 annually | Real Estate Company | Operating Cash Flow | Paid on a monthly basis. |
| Management and Administrative Fee | 1.25% of amount invested in Realty Mogul 97, LLC | RM Manager, LLC | Distributable Cash | RM Manager, LLC is the Manager of Realty Mogul 97, LLC and a wholly-owned subsidiary of Realty Mogul, Co. (2) |
(1) Certain employees of Realty Mogul, Co. are registered representatives of, and are paid commissions by, North Capital Private Securities Corp., a Delaware corporation ("North Capital"). In addition, North Capital pays a technology provider services fee to Realty Mogul, Co. for licensing and access to certain technology, reporting, communications, branding, entity formation and administrative services performed from time to time by Realty Mogul, Co., and North Capital and Realty Mogul, Co. are parties to a profit sharing arrangement.
(2) Fees may be deferred to reduce impact to investor distributions.
The above presentation is based upon information supplied by the Real Estate Company or others. Realty Mogul, Co., RM Manager, LLC, and The Company, along with their respective affiliates, officers, directors or representatives (the "RM Parties") hereby advise you that none of them has independently confirmed or verified any of the information contained herein. The RM Parties further make no representations as to the accuracy or completeness of any such information and undertake no obligation now or in the future to update or correct this presentation or any information contained herein.
RM Securities, LLC, its registered representatives, affiliates, associated persons, and personnel of its affiliates who may also be associated with it, including our associated persons and personnel of our affiliates who are also be associated with RM Securities, LLC (it (“RM Securities,” “we,” “our,” or “us”) will receive fees, expense reimbursements, and other compensation (“Fees”) from the issuer of this investment offering, its sponsor, or an affiliate thereof (“Sponsor”), or otherwise in connection with Sponsor’s offering. The Fees paid to us are in addition to other fees you will pay to Sponsor or in connection with Sponsor’s investment offering. You will pay Fees to Sponsor, either directly or indirectly as an investor in the Sponsor’s offering. Sponsor will use the Fees you pay, as well as funds you invest in the relevant offering, to compensate us. The Fees paid to us will directly or indirectly be borne by you as the investor (typically, but not always, in the form of an expense of the Sponsor’s offering in which you invest) because such Fees will reduce the proceeds available for distribution to you and reduce the amount you earn over time.
For more information on the Fees paid to us, or any other Fees you will pay in connection with Sponsor’s offering, please carefully review the Sponsor’s Investment Documents. Please also carefully review RM Securities’ Form CRS, Regulation Best Interest Disclosures, and Limited Brokerage Services Agreement.
No Approval, Opinion or Representation, or Warranty by RM Securities, LLCSponsor has provided, approved, and is solely responsible in all aspects for the information on this webpage (“Page”), including Sponsor’s offering documentation, which may include without limitation the Private Placement Memorandum, Operating or Limited Partnership Agreement, Subscription Agreement, the Project Summary and all exhibits and other documents attached thereto or referenced therein (collectively, the “Investment Documents”). The Investment Documents linked on this page have been prepared and posted by Sponsor, and not by RM Securities. We did not assist in preparing, do not adopt or endorse, and we are not otherwise responsible for, the Sponsor’s Investment Documents. We make no representations or warranties as to the accuracy of information on this Page or in the Sponsor’s Investment Documents and we accept no liability therefor. No part of the information on this Page or in the Sponsor’s Investment Documents is intended to be binding on us.
Sponsor’s Information Qualified by Investment DocumentsThe information on this Page is qualified in its entirety by reference to the more complete information about the offering contained in the Sponsor’s Investment Documents. The information on this Page is not complete and subject to change at the Sponsor’s discretion at any time up to the closing date. The Sponsor’s Investment Documents and supplements thereto contain important information about the Sponsor’s offering including relevant investment objectives, the business plan, risks, charges, expenses, and other information, which you should consider carefully before investing. The information on this Page should not be used as a basis for an investor’s decision to invest.
Risk of InvestmentThis investment is speculative, highly illiquid, and involves substantial risk. There can be no assurances that all or any of Sponsor’s assumptions, expectations, estimates, goals, hypothetical illustrations, or other aspects of Sponsor’s business plans (“Assumptions”) will be true or that actual performance will bear any relation to Sponsor’s Assumptions, and no guarantee or representation is made that Sponsor’s Assumptions will be achieved. If Sponsor does not achieve its Assumptions, your investment could be materially and adversely affected. A loss of part or all of the principal value of your investment may occur. You should not invest unless you can readily bear the consequences of such loss. Sponsor’s Assumptions should not be relied upon as the primary basis for your decision to invest.
No Reliance on Forward-Looking Statements; Sponsor AssumptionsSponsor is solely responsible for statements made concerning forward-looking statements and Assumptions, which apply only as of the date made, are preliminary and subject to change, and are expressly qualified in their entirety by the disclosures and cautionary statements included in Sponsor’s Investment Documents, which you should carefully review. Neither RM Securities nor Sponsor are obligated to update or revise such forward-looking statements or Assumptions to reflect events or circumstances that arise after the date made or to reflect the occurrence of unanticipated events. Sponsor’s forward-looking statements and Assumptions are hypothetical, not based on actual investment achievements or events, and are presented solely for purposes of providing insight into the Sponsor’s investment objectives, detailing Sponsor’s anticipated risk and reward characteristics, and establishing a benchmark for future evaluation of actual results; therefore, they are not a predictor, projection, or guarantee of future results. You should not rely on Sponsor’s forward-looking statements as a basis to invest.
Importantly, we do not adopt, endorse, or provide any assurance of returns or as to the accuracy or reasonableness of Sponsor’s Assumptions or forward-looking statements.
No Reliance on Past PerformanceAny description of past performance is not a reliable indicator of future performance and should not be relied upon as the primary basis to invest.
Sponsor’s Use of DebtA substantial portion of the total cost of the real estate asset acquired by the Sponsor with investor funds (“Property”) will be paid with borrowed funds, i.e., debt. Sponsor’s estimated rates and terms of the debt financing are subject to lender approval, and there is no assurance that the Sponsor will secure debt at the rates and terms presented on this Page or in the Sponsor’s Investment Documents, or at all. The use of borrowed money to acquire real estate is referred to as leveraging, which can amplify losses and could result in lender foreclosure. In addition, if the debt includes a variable (or “floating”) interest rate, the total amount of interest paid over the term of the debt will fluctuate and can increase. As a result, Sponsor’s use of debt can result in a loss of some or all of your investment.
Sponsor’s Offering is Not RegisteredSponsor’s securities offering will not be registered under the Securities Act of 1933, as amended (the “Securities Act”), in reliance upon the exemptions from registration pursuant to Rule 506(c) of Regulation D as promulgated under the Securities Act (“Private Placement”). In addition, the offering will not be registered under any state securities laws in reliance on exemptions from state registration. Such securities (your ownership interests) are subject to restrictions on transferability and resale and may not be transferred or resold except as permitted under applicable state and federal securities laws pursuant to registration or an available exemption. All Private Placements on the Platform are intended solely for “Accredited Investors,” as that term is defined in Rule 501(a) under the Securities Act.
No Investment AdviceNothing on this Page should be regarded as investment advice (either with respect to a particular security or regarding an overall investment strategy), a recommendation, an offer to sell, or a solicitation of or an offer to buy any security. Advice from a securities professional is strongly advised to understand and assess the risks associated with real estate or private placement investments. For additional information on RM Securities’ involvement in this offering, please carefully review the Sponsor’s Investment Documents, and RM Securities’ Form CRS, Regulation Best Interest Disclosures, and Limited Brokerage Services Agreement.
1031 Exchange RiskInternal Revenue Code Section 1031 (“Section 1031”) contains complex tax concepts and certain tax consequences may vary depending on the individual circumstances of each investor. RM Securities and its affiliates make no representation or warranty of any kind with respect to the tax consequences of your investment or that the IRS will not challenge any such treatment. You should consult with and rely on your own tax advisor about the tax aspects with respect to your particular circumstances.