The team at our affiliated broker-dealer, RM Securities, conducts diligence on of the issuer, including detailed background checks, criminal checks, bad actor checks, and reference checks on sponsors. In addition to screening for any criminal background, we may also turn down sponsors due to poor reference checks, even if the background and criminal checks are satisfactory.
We require unaffiliated sponsors to use an unaffiliated third-party escrow agent.* When an investor makes an investment with such sponsors using the RealtyMogul platform, the investor’s money is transferred directly into a third-party escrow account. All closing conditions in connection with a sponsor’s contingency offering need to be met before the third-party escrow agent will approve releasing investor funds to the issuer or general partner. For example, if an issuer or general partner plans to use funds for a real estate acquisition that does not ultimately transact, the third-party escrow agent will not transfer investor funds to the issuer or general partner, and funds will be returned to investors.
* Unless otherwise disclosed, escrow accounts are not required for some investments that accommodate 1031 investments where the property is already acquired.
Our processes typically includes visiting certain properties (or a subset of properties if it's a fund) to confirm the real estate is what and where the real estate is supposed to be. For certain properties that accommodate 1031 exchange investments, the team will review third-party prepared due diligence reports in lieu of a site visit.
We have formalized processes and checklists for every private placement deal listed on the platform.


Trion Properties
Trion Properties focuses on potentially maximizing investor returns by increasing net operating income throughout the holding period through a hands-on management style of heavy renovation and aggressive lease-up.Trion Properties is a private equity investment company which acquires opportunistic real estate investments that need moderate to heavy rehab on a mid to long term investment horizon.
Founded in 2005, Trion has successfully closed over $200 million in transactions through either the purchase of the fee simple interest or taking ownership of the asset through acquiring the non-performing debt.Trion Properties is managed by principals whose combined experience spans over 20 years in West Coast real estate markets and is in excess of one billion dollars in transactions.
RealtyMogul.com has invested in two prior transactions with the Real Estate Company - Woodland Park Estates and Buckingham Apartments. As of Q2 2017, all of the units at Woodland Park Estates had been renovated, and average in-place rents were 54.5% higher than average rents at the time of acquisition and 20% higher than proforma rents. As of Q3 2017, the cash-on-cash return since inception was 6.7%, which does not include refinance proceeds that returned approximately 15% of capital to investors. As of Q2 2017, Buckingham Apartments was still undergoing renovations, with 25 of 48 units complete, and another 10 units that were expected to be completed by the end of Q3 2017. Average in-place rents as of Q2 2017 were 22.8% above average rents at the time of acquisition.
https://trion-properties.com/-
 Max SharkanskyCo-Founder and Managing Partner
 -
 Mitch PaskhoverCo-Founder
Max Sharkansky oversees all aspects of acquisition, disposition, and property analysis for Trion Properties. Since founding Trion Properties, Max has led the acquisition, renovation and disposition of over $100 million in mismanaged and distressed assets, primarily in multifamily.. Max launched his foray into investments with two acquisitions of value-add multifamily properties in 2005. Following the first two closings, Max, along with partner Mitch Paskhover, created the platform and formed the Company in 2006 to execute a business plan of acquiring mispriced and mismanaged properties throughout Los Angeles. Max led Trion in the execution of several acquisitions in its first two years of existence and exited the portfolio prior to the economic crisis. With cash on hand and no resources tied up in workouts, Max assisted in implementing an acquisition strategy of targeting distressed debt secured by multifamily, and distressed multifamily REOs, which led to the ultra-successful campaign of the acquisition of 20 properties throughout the downturn. Since the recovery and the clearing of distress from the marketplace, Max has shifted strategies to the acquisition of value-add properties where value can be created through extensive renovations, hands-on management, and improvement of operating efficiencies.
Prior to co-founding Trion Properties, Max was a Senior Associate at Marcus & Millichap from 2002 through 2006. While at Marcus & Millichap, Max managed the sale of several million dollars in real estate throughout the continental United States, specifically in the multifamily arena, elevating him to one of the top-ranking brokers in Los Angeles. He graduated from Loyola Marymount University where he earned a Bachelor’s degree in Business Administration with an emphasis on Finance.
Mitch Paskhover is a real estate investment professional and brings strategic planning, financial experience and vision to the management team. Mr. Paskhover directs all financing activities for Trion, including the procurement of acquisition and project financing. Mr. Paskhover also assists in all acquisition, disposition and risk management activities for Trion. His ability to seek out and acquire distressed multifamily properties and his expertise of the marketplace have been instrumental in the success of Trion Properties.
Prior to co-founding Trion Properties, Paskhover was a Managing Director in the Los Angeles office of HFF (Holliday Fenoglio Fowler, L.P.). Paskhover has over eight years of experience in commercial real estate finance. Mr. Paskhover’s primary focus was on debt and equity transactions including multifamily, office, retail and hospitality properties with an emphasis on multifamily. During his tenure at HFF, Mitch Paskhover was promoted to Managing Director within two years of becoming a Director. Throughout his career in commercial real estate, Mr. Paskhover has been involved in over $2.5 billion in commercial real estate transactions. Mr. Paskhover joined HFF in June 2002. Prior to HFF, Mr. Paskhover was with Prudential in their Los Angeles office where he was responsible for originating commercial real estate loans. He graduated from University of Southern California where he earned a Bachelor’s degree in Business Administration with an emphasis on Finance. He is a licensed California Real Estate Broker.
| Property Address | City | Property Type | Date Acquired | # of Units | Square Feet | Status | Purchase Price | Total Capitalization |
|---|---|---|---|---|---|---|---|---|
| 412 S Lake St | Los Angeles, CA | MF | 8/1/2013 | 41 | - | Stabilized | $1,600,000 | $9,000,000 |
| 4620 S Slauson Ave | Los Angeles, CA | MF | 9/12/2014 | 28 | - | Stabilized | $6,750,000 | $10,800,000 |
| 1802-1820 Pacific Coast Hwy | Redondo Beach, CA | Retail | 11/24/2014 | - | 20,191 | Stabilized | $5,781,250 | $9,800,000 |
| 28955 Pacific Coast Hwy | Malibu, CA | 2/28/2014 | - | 16,711 | Renovating | $5,750,000 | $9,300,000 | |
| 1804 NE 104th St | Portland, OR | MF | 5/14/2015 | 74 | - | Stabilized | $6,642,598 | $11,100,000 |
| 3635 College Ave | San Diego, CA | MF | 6/15/2015 | 98 | - | Stabilized | $9,650,000 | $19,400,000 |
| 2222 SW Spring Garden | Portland, OR | MF | 8/14/2015 | 44 | - | Renovating | $4,450,000 | $5,730,000 |
| 324S Catalina St | Los Angeles, CA | MF | 11/23/2015 | 47 | - | Stabilized | $7,540,000 | $9,400,000 |
| 239 242nd St | Hayward, CA | MF | 12/23/2015 | 30 | - | Stabilized | $6,650,000 | $8,650,000 |
| 348 Estabrook | San Leandro, CA | MF | 1/4/2016 | 38 | - | Stabilized | $7,200,000 | $12,000,000 |
| 5012 Slauson Ave | Culver City, CA | MF | 4/1/2016 | - | N/A | Entitlement | $2,610,500 | $3,800,000 |
| 11255 SW Greenburg Rd | Tigard, OR | MF | 7/11/2016 | 36 | Renovating | $3,800,000 | $5,580,000 | |
| 180 Buckingham Ave | Redwood City, CA | MF | 7/13/2016 | 48 | - | Renovating | $15,000,000 | $17,330,000 |
| 14620-14650 SW Farmigton Rd | Beaverton, OR | MF | 10/14/2016 | 61 | - | Renovating | $7,250,000 | $9,222,384 |
| 77-85 Estabrook St | San Leandro, CA | MF | 3/24/2017 | 146 | - | Renovating | $36,600,000 | $42,511,937 |
| 12020 Why Worry Lane | Beaverton, OR | MF | 6/19/2017 | 67 | - | Renovating | $9,185,000 | $10,700,000 |
| Currently Owned Total | 758 | $136,459,348 | $194,324,321 |
| Property Address | City | Property Type | Date Acquired | # of Units | Square Feet | Status | Purchase Price | Total Capitalization | Sale Price | Sale Date |
|---|---|---|---|---|---|---|---|---|---|---|
| 6180 Aldama | Los Angeles, CA | MF | 7/31/2015 | 15 | - | Realized | $3,375,000 | $4,113,253 | $5,530,000 | 5/19/2017 |
| 24510 Town Center Dr | Valencia, CA | Retail | 10/22/2013 | - | 26,186 | Exchange | $6,900,000 | $7,900,000 | $9,728,000 | 12/21/2016 |
| 3536 Watt Ave | Sacramento, CA | MF | 4/1/2013 | 128 | 96,800 | Exchange | $4,900,000 | $5,932,025 | $10,250,000 | 9/30/2016 |
| 5416 Jackson St | North Highlands, CA | MF | 1/28/2014 | 185 | 0 | Realized | $9,300,000 | $10,738,981 | $15,500,000 | 9/1/2016 |
| 909 Sunshine Ave | El Cajon, CA | MF | 4/10/2013 | 22 | - | Realized | $2,350,000 | $2,619,213 | $3,740,000 | 5/7/2015 |
| 3298 Mooney Blvd | Visalia, CA | Retail | 12/31/2012 | - | 57,254 | Realized | $2,746,650 | $2,756,277 | $4,000,000 | 6/1/2013 |
| 7629-7633 Normal Ave | La Mesa, CA | MF | 11/20/2012 | 21 | - | Realized | $1,900,000 | $2,263,689 | $3,580,000 | 6/9/2015 |
| Arden Loan Portfolio | Sacramento, CA | MF | 7/26/2012 | 224 | - | Realized | $5,750,000 | $6,085,860 | $7,134,385 | 2/1/2013 |
| 1535 N Cedar Ave | Fresno, CA | MF | 7/13/2012 | 124 | - | Realized | $3,248,750 | $4,435,709 | $5,500,000 | 3/4/2015 |
| 4318 Avalon | Los Angeles, CA | MF | 1/3/2012 | 11 | - | Realized | $515,000 | $563,902 | $680,000 | 7/18/2012 |
| 2280 South Drive | Auburn, CA | MF | 12/30/2011 | 16 | - | Realized | $1,350,000 | $1,727,568 | $2,400,000 | 7/12/2012 |
| 210 43rd Place | Los Angeles, CA | MF | 9/26/2011 | 30 | - | Realized | $949,000 | $1,040,393 | $1,480,000 | 6/25/2012 |
| 8833 Tobias Ave | Panorama City, CA | MF | 9/21/2011 | 20 | - | Realized | $1,169,000 | $1,278,675 | $1,430,000 | 12/30/2011 |
| 225 N Avenue 53 | Los Angeles, CA | MF | 4/28/2011 | 20 | - | Realized | $1,249,463 | $1,526,243 | $2,075,000 | 5/12/2012 |
| 4620 Coliseum | Los Angeles, CA | MF | 12/17/2010 | 35 | - | Realized | $1,800,000 | $1,985,773 | $2,550,000 | 12/29/2011 |
| 1324 57th St | Los Angeles, CA | MF | 11/23/2010 | 14 | - | Realized | $875,000 | $977,018 | $1,155,000 | 10/28/2011 |
| 6407 10th Ave | Los Angeles, CA | MF | 5/5/2010 | 28 | - | Realized | $1,500,000 | $1,763,512 | $2,125,000 | 7/29/2011 |
| East West Bank Portfolio | LA County, CA | MF | 8/14/2009 | 21 | - | Realized | $725,000 | $740,024 | $960,000 | 9/1/2010 |
| 13490-13520 Foothill Blvd | Sylmar, CA | MF | 6/4/2007 | 81 | - | Realized | $11,150,000 | $11,786,570 | $12,850,000 | 7/1/2008 |
| 7445 Vineland | Sun Valley, CA | MF | 4/10/2007 | 20 | - | Realized | $1,867,125 | $1,928,485 | $2,250,000 | 8/5/2008 |
| 4632 Laurel Canyon | Valley Village, CA | MF | 3/20/2007 | 44 | - | Realized | $5,225,000 | $5,529,035 | $4,851,125 | 5/29/2009 |
| 12717 Barbara Ann | North Hollywood, CA | MF | 11/2/2006 | 24 | - | Realized | $2,625,000 | $2,800,887 | $3,200,000 | 4/10/2009 |
| 417W Los Feliz | Glendale, CA | MF | 12/30/2005 | 34 | - | Realized | $2,200,000 | $2,444,000 | $3,495,000 | 5/17/2007 |
| 7355- 7359 Vineland | Sun Valley, CA | MF | 12/28/2005 | 12 | - | Realized | $1,147,466 | $1,263,093 | $1,600,000 | 4/11/2007 |
| Sold Assets Total | 1,129 | $74,817,454 | $84,200,185 | $108,063,510 | ||||||
| Grand Total | 1,887 | $211,276,802 | $278,524,506 |
The Real Estate Company's bio and track record were provided by the Real Estate Company and have not been verified by RealtyMogul.com or NCPS
In this transaction, RealtyMogul.com investors will invest in Realty Mogul 95, LLC (the "Company"). Realty Mogul 95, LLC will subsequently invest in 4445 Stevenson Investors, LLC (the "Target"), the entity that will directly or indirectly hold title to the Property.
Trion Properties (the "Real Estate Company") believes that rents at the Property are currently below market, and plans to implement a capital improvement plan of approximately $3,371,445 ($38,312 per unit) in order to enhance the Property's appeal and bring rents up to market. Interior renovations are budgeted at $25,000 per unit and are to include vinyl plank flooring, stainless steel appliances and stovetops, new cabinetry, quartz countertops, window treatments, plumbing and fixtures, Bluetooth smart locks, new vanities, re-glazed bathtubs, paint, and lighting. The Real Estate Company also plans to install a washer and dryer inside each unit. Exterior renovations are to include paint, fencing, removing dry rot, upgrading amenities, HVAC, landscaping, branding/signage, improving carports, roof repair, and lighting. Upon completion, the Real Estate Company expects to be able to achieve rental increases averaging $917 per unit, a 55% increase over average in-place rents.
The Real Estate Company also intends to enhance the overall operations of the Property through improved management and marketing efforts, drawing from their ownership experience of over 1,800 multifamily units to date. After renovations are complete, the Real Estate Company plans to refinance the Property, and sell within five years.
RealtyMogul.com has invested in two prior transactions with the Real Estate Company - Woodland Park Estates and Buckingham Apartments. As of Q2 2017, all of the units at Woodland Park Estates had been renovated, and average in-place rents were 54.5% higher than average rents at the time of acquisition and 20% higher than proforma rents. As of Q3 2017, the cash-on-cash return since inception was 6.7%, which does not include refinance proceeds that returned approximately 15% of capital to investors. As of Q2 2017, Buckingham Apartments was still undergoing renovations, with 25 of 48 units complete, and another 10 units that were expected to be completed by the end of Q3 2017. Average in-place rents as of Q2 2017 were 22.8% above average rents at the time of acquisition.
RealtyMogul.com, along with Trion Properties (the "Real Estate Company"), is providing the opportunity to invest in the acquisition and ownership of an 88-unit apartment community located in Fremont, CA, within the San Francisco-Oakland-Hayward, CA MSA.
The primary objective of this investment is to acquire the Property, implement a $3,371,445 capital improvement program, increase rents to market rates, and sell the Property within approximately five (5) years.
The Real Estate Company sees this investment as an opportunity to capitalize on an under managed asset in a market where they currently own and manage four other multifamily assets.
First completed in 1966, Americana Apartments is an 88-unit garden style apartment community. The complex contains 17 free-standing buildings, 14 of which contain the 88 dwelling units. Floorplans consist of two bedroom/one and a half bathroom, and three bedroom/two bathroom two-story townhome configurations. The Property is located on a 4.65-acre parcel in Fremont, California.
Amenities consist of two in-ground pools within gated pool decks, four laundry rooms (three of which are free-standing) and two carports structures containing 77 covered parking spaces. Dwelling units conform to the same general finishes, fixtures, and appliances. Each contains a refrigerator, electric oven/range, dishwasher, and garbage disposal. Living rooms and bedrooms have carpet flooring, with VCT (vinyl composition tile) flooring in kitchens and bathrooms.
| # of Units | Avg SF/Unit | Avg In-Place Rent/Unit | |
|---|---|---|---|
| 2BD / 1.5BA Townhouse | 72 | 987 | $1,635 |
| 3BD / 2BA Townhouse | 16 | 1,100 | $1,810 |
| Total | 88 | 1,008 | $1,667 |
[[{"fid":"49690","view_mode":"media_original","type":"media","attributes":{"height":"587","width":"825","style":"width: 585px; height: 416px; border-width: 1px; border-style: solid;","class":"media-element file-media-original"}}]]
[[{"fid":"49691","view_mode":"media_original","type":"media","attributes":{"height":"2242","width":"3992","style":"width: 585px; height: 329px; border-width: 1px; border-style: solid;","class":"media-element file-media-original"}}]]
| Camden Village Apts. | Victoria Park Apts. | Sofi Fremont | Trimboli Terrace Apts. | Cambridge Court Townhomes | Woodbridge Apartment Homes | Total / Averages | Subject | |
|---|---|---|---|---|---|---|---|---|
| Date | 6/16 | 5/16 | 12/16 | 3/17 | 12/16 | 3/17 | - | - |
| Units(#) | 196 | 60 | 204 | 19 | 17 | 19 | 86 | 88 |
| Year Built | 1969 | 1987 | 1973 | 1989 | 1985 | 1989 | 1982 | 1966 |
| SF | 163,584 | 50,052 | 162,932 | 14,350 | 21,760 | 14,350 | 134,406 | 88,705 |
| Average Size/Unit | 835 | 834 | 799 | 755 | 1,280 | 755 | 876 | 1,008 |
| Purchase Price | $63,000,000 | $18,600,000 | $74,500,000 | $7,750,000 | $7,650,000 | $7,775,000 | $58,345,363 | $26,500,000 |
| $/Unit | $321,429 | $310,000 | $365,196 | $407,895 | $450,000 | $409,211 | $377,288 | $301,136 |
| $/SF | $385 | $372 | $457 | $540 | $352 | $542 | $441 | $299 |
| Cap Rate | 4.50% | 3.20% | 4.76% | 4.89% | N/A | N/A | 4.34% | 3.22% |
| Distance from Subject | 2.5 | 1.7 | 2.7 | 0.8 | 1.2 | 1.0 | 1.7 | - |
| Sundale Apartments | Camden Village | Stevenson Place | Waterstone Fremont | Woodcreek Apartments* | Briarwood at Central Park | Total / Averages | Subject (Targeted) | |
|---|---|---|---|---|---|---|---|---|
| Units(#) | 286 | 192 | 200 | 526 | 96 | 159 | 243 | 88 |
| Year Built | 1963 | 1966 | 1971 | 1974 | 1986 | 1970 | 1,972 | 1966 |
| Distance from Subject | 0.6 | 2.6 | 0.4 | 1.1 | 1.9 | 1.0 | 1.3 | - |
| Rents (2 Bedroom) | $2,595 | $2,703 | $2,583 | $2,685 | $2,425 | $2,456 | $2,575 | $2,525 |
| Average Size | 1,026 | 1,017 | 1,110 | 1,040 | 881 | 828 | 984 | 987 |
| Average Rent/SF | $2.53 | $2.66 | $2.33 | $2.58 | $2.75 | $2.97 | $2.64 | $2.56 |
| Rents (3 Bedroom) | - | $3,211 | - | - | $2,900 | - | $3,056 | $2,850 |
| Average Size | - | 1,300 | - | - | 1,152 | - | 1,226 | 1,110 |
| Average Rent/SF | - | $2.47 | - | - | $2.52 | - | $2.49 | $2.59 |
| *Two bedroom floorplans at this comp feature 2 bathrooms | ||||||||
The Property is located in Fremont, the fourth largest city in the Bay Area, less than two miles from I-880, and four miles from Tesla's 5.3 million square foot factory. Fremont is very well connected to the rest of the Bay Area via I-880, the Dumbarton Bridge, the San Mateo Bridge, and Bay Area Rapid Transit (BART), which has a station in Fremont approximately two miles from the subject Property. CoStar reports a 2015 study that measured a daily traffic count of 36,892 cars on Stevenson Boulevard at the location of the Property.
Market Overview
CoStar reports that the Bay Area's booming economy and healthy population growth has helped to maintain strong apartment demand in the East Bay. The market benefits from its proximity to two major employment centers. Many residents work in San Francisco or San Jose, metros with significant labor-market gains in recent years. East Bay is also generating its own growth, with pending relocations by companies such as Uber, which are drawn to the market's cheaper office rents. (Source: CoStar)
According to Axiometrics, effective rent increased 4.1% from $2,314 in 1Q17 to $2,409 in 2Q17, which resulted in an annual growth rate of 1.2%. Annual effective rent growth is forecast to be 3.6% in 2018, and average 3.8% from 2019 to 2021. The market's occupancy rate increased from 95.5% in 1Q17 to 96.1% in 2Q17. For the forecast period, the market's occupancy rate is expected to be 96.1% in 2018, and average 96.1% from 2019 to 2021. (Source: Axiometrics)
Submarket Overview
Axiometrics reports that effective rent increased 4.5% from $2,319 in 1Q17 to $2,422 in 2Q17. Out of the 8 submarkets in the market, the Fremont/Newark/Union City submarket ranked 3rd for quarterly effective rent growth and 4th for annual effective rent growth for 2Q17. Annual effective rent growth is forecast to be 1.3% in 2017, and average 3.4% through 2019. The submarket's occupancy rate increased from 95.5% in 1Q17 to 96.3% in 2Q17, and was up from 96.2% a year ago. The submarket's occupancy rate is expected average 96.4% from 2017 to 2019. (Source: Axiometrics)
According to CoStar, Fremont/Hayward, like many parts of the East Bay, benefits from population growth and demand spillover from San Francisco and Silicon Valley. Landlords also benefit from the submarket's status as a key industrial center. All of this, as well as the lack of new construction, has allowed vacancies to remain relatively tight around the historical average.
Fremont/Hayward is a largely blue-collar, low-rise suburban submarket consisting primarily of single-family homes. The submarket is home to the Tesla Motors factory, the last major automaker producing cars in California, which makes it an important industrial center in East Bay. Tesla is currently adding an additional 4.6 million square feet of space to its Fremont facility, which will bring their total space to nearly 10 million square feet. Other big employers in the submarket include Seagate Technology, which purchased the Fremont manufacturing plant formerly occupied by the now bankrupt Solyndra and Amazon.com, which recently completed a lease for more than 500,000 square feet of distribution space, also in Fremont.
Developers have been quiet here during the current cycle, and there is less high-end product than elsewhere in the metro. However, more than 40% of Fremont/Hayward residents do rent, and a steady need for apartments throughout the metro has led to tight vacancies and strong rent growth in recent years. Trading of apartment units is mostly confined to lower-tiered buildings, because very little of the submarket's product is institutional-grade. (Source: CoStar)
Demographic Information
| Distance from Property | 1 Mile | 3 Miles | 5 Miles |
| Population | 38,253 | 167,712 | 289,460 |
| Projected Growth (2017-2022) | 8.23% | 7.96% | 7.76% |
| Median Household Income | $92,572 | $105,097 | $109,120 |
| Average Household Income | $110,588 | $126,594 | $131,536 |
| Median Home Value | $665,338 | $736,845 | $742,900 |
| % of Renter Households | 55% | 42% | 38% |
Demographic information above was obtained from CoStar


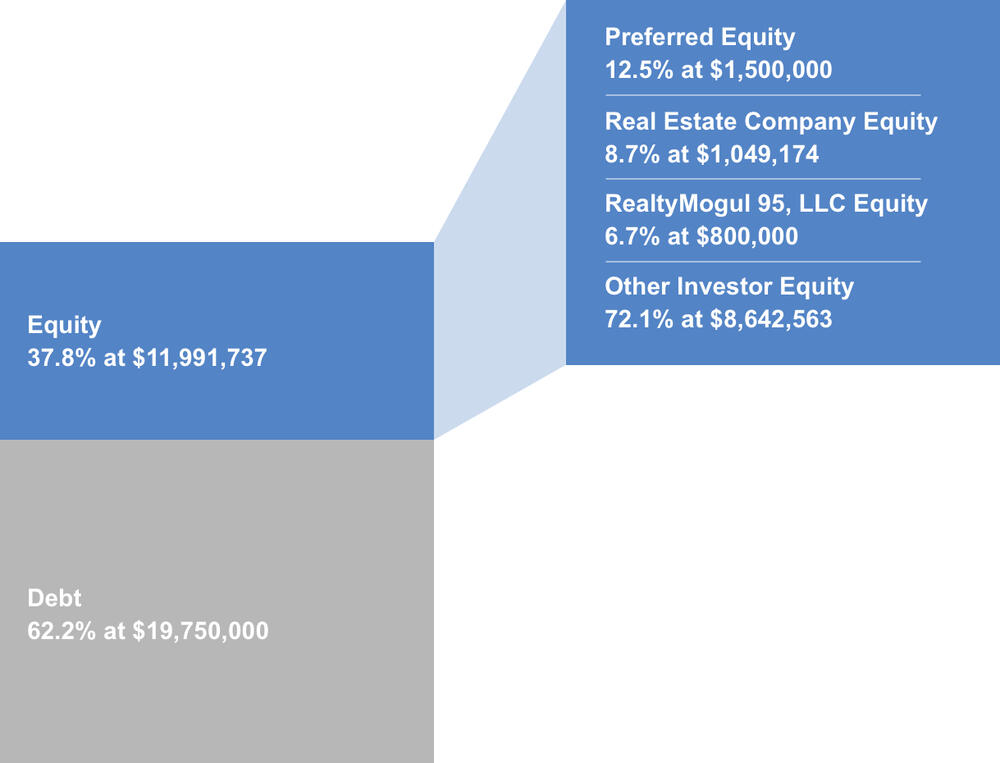
| Source of Funds | Cost |
|---|---|
| Senior Loan | $19,750,000 |
| Preferred Equity | $1,500,000 |
| Equity | $10,491,737 |
| Total Sources of Funds | $31,741,737 |
| Uses of Funds | Cost |
| Purchase Price | $26,500,000 |
| Sponsor Acquisition Fee | $265,000 |
| Broker Dealer Fee (3.0%) | $24,000 |
| Interest Reserves | $500,000 |
| Closing Costs | $132,500 |
| Working Capital | $576,917 |
| Unit Renovation Budget | $2,210,900 |
| Exterior and Common Area Capex | $1,160,545 |
| Loan Broker Fee | $212,500 |
| Loan Fees | $159,375 |
| Total Uses of Funds | $31,741,737 |
Senior Loan
- Lender: California Bank and Trust
- Loan Type: Bridge Loan
- Loan Amount: $19,750,000 (of which $3,525,000 is reserved for capital improvements and interest reserves)
- Interest Rate: 30-Day LIBOR + 325 bps
- Term: 36 Months
- Amortization: 30 year amortization, extension periods only
- Interest Only: 36 Months
- Prepayment Penalty: Breakage fees only
- Extensions: Two (2) 12 month extensions (0.25% fee)
Preferred Equity
- Provider: Partners Capital Solutions Equity Fund III
- Type: Preferred Equity
- Loan Amount: $1,500,000
- Interest Rate: 14.00%; 6.00% to be paid current, monthly, and 8.00% accruing, non-compounding, to be paid at a capital event.
- Term: 5 Years
- Amortization: None
- Interest Only: Full term
- Prepayment Penalty: None
- Extensions: None
The Target will make distributions to investors (The Company and the Real Estate Company, collectively, the "Members") as follows:
Operating Income, Refinance, and Sales Proceeds
- An 8% preferred return to all Members, pari passu, in proportion to their respective capital contributions;
- Second, to all Members, pari passu, in proposition to their respective unreturned capital contributions, until all unreturned capital contributions to Members have been returned;
- Any excess balance will be split 70% to Members pari passu and 30% to Sponsor
Note that these distributions will occur after the payment of the Company's liabilities (loan payments, preferred equity distributions, operating expenses and other fees as set forth in the LLC agreement, in addition to any Member loans or returns due on Member loans).
The Company will distribute 100% of its share of excess cash flow (after expenses) to the Members of the Company (the RealtyMogul.com investors). The manager of the Company will receive a portion (up to 10%) of the Real Estate Company's promote interest. Distributions are targeted to start in June 2019 and are projected to continue on a quarterly basis thereafter. These distributions are at the discretion of the Real Estate Company who may decide to delay distributions for any reason, including maintenance or capital reserves.
| Year 1 | Year 2 | Year 3 | Year 4 | Year 5 | |
|---|---|---|---|---|---|
| Effective Gross Revenue | $1,216,331 | $2,185,562 | $2,798,636 | $2,976,769 | $3,067,989 |
| Total Operating Expenses | $801,337 | $858,784 | $902,482 | $929,295 | $953,153 |
| Net Operating Income | $414,994 | $1,326,778 | $1,896,153 | $2,047,474 | $2,114,745 |
| Year 0 | 2017 | 2018 | 2019 | 2020 | 2021 | 2022 | |
|---|---|---|---|---|---|---|---|
| Distributions to Realty Mogul 95, LLC Investors |
($810,000) | $0 | $0 | $218,126 | $42,783 | $47,698 | $1,182,452 |
| Net Earnings to Investor - Hypothetical $50,000 Investment |
($50,000) | $0 | $0 | $13,465 | $2,641 | $2,944 | $72,991 |
Certain fees and compensation will be paid over the life of the transaction. The following fees and compensation will be paid:
| Type of Fee | Amount of Fee | Received By | Paid From | Notes |
|---|---|---|---|---|
| Acquisition Fee | $265,000 | Real Estate Company | Capitalized Equity Contribution | 1.0% of the property purchase price |
| Broker-Dealer Fee | 3.0% | North Capital (1) | Capitalized Equity Contribution | 3.0% based on the amount of equity invested by Realty Mogul 95, LLC |
| Mortgage Broker Fee | 1.0% | Continental Funding Group | Capitalized Equity Contribution | 1.0% of the total loan and preferred equity amounts arranged at closing, as well as any future refinance proceeds. Continental Funding Group is a separate but affiliated entity of the Real Estate Company and its principals. |
| Construction Management Fee | 5.0% of capital improvement budget | Real Estate Company | Capitalized Equity Contribution | This expense is included in the capital improvement budget that is capitalized into the deal |
| Type of Fee | Amount of Fee | Received By | Paid From | Notes |
|---|---|---|---|---|
| Property Management Fee | 4.0% | Real Estate Company | Operating Cash Flow | The greater of 4.0% of Gross Operating Revenues or $2,500/month |
| Management and Administrative Fee | 1.0% of amount invested in Realty Mogul 95, LLC | RM Manager, LLC | Distributable Cash | RM Manager, LLC is the Manager of Realty Mogul 95, LLC and a wholly-owned subsidiary of Realty Mogul, Co. (2) |
Notes:
(1) Certain employees of Realty Mogul, Co. are registered representatives of, and are paid commissions by, North Capital Private Securities Corp., a Delaware corporation ("North Capital"). In addition, North Capital pays a technology provider services fee to Realty Mogul, Co. for licensing and access to certain technology, reporting, communications, branding, entity formation and administrative services performed from time to time by Realty Mogul, Co., and North Capital and Realty Mogul, Co. are parties to a profit sharing arrangement.
(2) Fees may be deferred to reduce impact to investor distributions
The above presentation is based upon information supplied by the Sponsor or others. Realty Mogul, Co., RM Manager, LLC, and The Company, along with their respective affiliates, officers, directors or representatives (the "RM Parties") hereby advise you that none of them has independently confirmed or verified any of the information contained herein. The RM Parties further make no representations as to the accuracy or completeness of any such information and undertake no obligation now or in the future to update or correct this presentation or any information contained herein.
RM Securities, LLC, its registered representatives, affiliates, associated persons, and personnel of its affiliates who may also be associated with it, including our associated persons and personnel of our affiliates who are also be associated with RM Securities, LLC (it (“RM Securities,” “we,” “our,” or “us”) will receive fees, expense reimbursements, and other compensation (“Fees”) from the issuer of this investment offering, its sponsor, or an affiliate thereof (“Sponsor”), or otherwise in connection with Sponsor’s offering. The Fees paid to us are in addition to other fees you will pay to Sponsor or in connection with Sponsor’s investment offering. You will pay Fees to Sponsor, either directly or indirectly as an investor in the Sponsor’s offering. Sponsor will use the Fees you pay, as well as funds you invest in the relevant offering, to compensate us. The Fees paid to us will directly or indirectly be borne by you as the investor (typically, but not always, in the form of an expense of the Sponsor’s offering in which you invest) because such Fees will reduce the proceeds available for distribution to you and reduce the amount you earn over time.
For more information on the Fees paid to us, or any other Fees you will pay in connection with Sponsor’s offering, please carefully review the Sponsor’s Investment Documents. Please also carefully review RM Securities’ Form CRS, Regulation Best Interest Disclosures, and Limited Brokerage Services Agreement.
No Approval, Opinion or Representation, or Warranty by RM Securities, LLCSponsor has provided, approved, and is solely responsible in all aspects for the information on this webpage (“Page”), including Sponsor’s offering documentation, which may include without limitation the Private Placement Memorandum, Operating or Limited Partnership Agreement, Subscription Agreement, the Project Summary and all exhibits and other documents attached thereto or referenced therein (collectively, the “Investment Documents”). The Investment Documents linked on this page have been prepared and posted by Sponsor, and not by RM Securities. We did not assist in preparing, do not adopt or endorse, and we are not otherwise responsible for, the Sponsor’s Investment Documents. We make no representations or warranties as to the accuracy of information on this Page or in the Sponsor’s Investment Documents and we accept no liability therefor. No part of the information on this Page or in the Sponsor’s Investment Documents is intended to be binding on us.
Sponsor’s Information Qualified by Investment DocumentsThe information on this Page is qualified in its entirety by reference to the more complete information about the offering contained in the Sponsor’s Investment Documents. The information on this Page is not complete and subject to change at the Sponsor’s discretion at any time up to the closing date. The Sponsor’s Investment Documents and supplements thereto contain important information about the Sponsor’s offering including relevant investment objectives, the business plan, risks, charges, expenses, and other information, which you should consider carefully before investing. The information on this Page should not be used as a basis for an investor’s decision to invest.
Risk of InvestmentThis investment is speculative, highly illiquid, and involves substantial risk. There can be no assurances that all or any of Sponsor’s assumptions, expectations, estimates, goals, hypothetical illustrations, or other aspects of Sponsor’s business plans (“Assumptions”) will be true or that actual performance will bear any relation to Sponsor’s Assumptions, and no guarantee or representation is made that Sponsor’s Assumptions will be achieved. If Sponsor does not achieve its Assumptions, your investment could be materially and adversely affected. A loss of part or all of the principal value of your investment may occur. You should not invest unless you can readily bear the consequences of such loss. Sponsor’s Assumptions should not be relied upon as the primary basis for your decision to invest.
No Reliance on Forward-Looking Statements; Sponsor AssumptionsSponsor is solely responsible for statements made concerning forward-looking statements and Assumptions, which apply only as of the date made, are preliminary and subject to change, and are expressly qualified in their entirety by the disclosures and cautionary statements included in Sponsor’s Investment Documents, which you should carefully review. Neither RM Securities nor Sponsor are obligated to update or revise such forward-looking statements or Assumptions to reflect events or circumstances that arise after the date made or to reflect the occurrence of unanticipated events. Sponsor’s forward-looking statements and Assumptions are hypothetical, not based on actual investment achievements or events, and are presented solely for purposes of providing insight into the Sponsor’s investment objectives, detailing Sponsor’s anticipated risk and reward characteristics, and establishing a benchmark for future evaluation of actual results; therefore, they are not a predictor, projection, or guarantee of future results. You should not rely on Sponsor’s forward-looking statements as a basis to invest.
Importantly, we do not adopt, endorse, or provide any assurance of returns or as to the accuracy or reasonableness of Sponsor’s Assumptions or forward-looking statements.
No Reliance on Past PerformanceAny description of past performance is not a reliable indicator of future performance and should not be relied upon as the primary basis to invest.
Sponsor’s Use of DebtA substantial portion of the total cost of the real estate asset acquired by the Sponsor with investor funds (“Property”) will be paid with borrowed funds, i.e., debt. Sponsor’s estimated rates and terms of the debt financing are subject to lender approval, and there is no assurance that the Sponsor will secure debt at the rates and terms presented on this Page or in the Sponsor’s Investment Documents, or at all. The use of borrowed money to acquire real estate is referred to as leveraging, which can amplify losses and could result in lender foreclosure. In addition, if the debt includes a variable (or “floating”) interest rate, the total amount of interest paid over the term of the debt will fluctuate and can increase. As a result, Sponsor’s use of debt can result in a loss of some or all of your investment.
Sponsor’s Offering is Not RegisteredSponsor’s securities offering will not be registered under the Securities Act of 1933, as amended (the “Securities Act”), in reliance upon the exemptions from registration pursuant to Rule 506(c) of Regulation D as promulgated under the Securities Act (“Private Placement”). In addition, the offering will not be registered under any state securities laws in reliance on exemptions from state registration. Such securities (your ownership interests) are subject to restrictions on transferability and resale and may not be transferred or resold except as permitted under applicable state and federal securities laws pursuant to registration or an available exemption. All Private Placements on the Platform are intended solely for “Accredited Investors,” as that term is defined in Rule 501(a) under the Securities Act.
No Investment AdviceNothing on this Page should be regarded as investment advice (either with respect to a particular security or regarding an overall investment strategy), a recommendation, an offer to sell, or a solicitation of or an offer to buy any security. Advice from a securities professional is strongly advised to understand and assess the risks associated with real estate or private placement investments. For additional information on RM Securities’ involvement in this offering, please carefully review the Sponsor’s Investment Documents, and RM Securities’ Form CRS, Regulation Best Interest Disclosures, and Limited Brokerage Services Agreement.
1031 Exchange RiskInternal Revenue Code Section 1031 (“Section 1031”) contains complex tax concepts and certain tax consequences may vary depending on the individual circumstances of each investor. RM Securities and its affiliates make no representation or warranty of any kind with respect to the tax consequences of your investment or that the IRS will not challenge any such treatment. You should consult with and rely on your own tax advisor about the tax aspects with respect to your particular circumstances.