The team at our affiliated broker-dealer, RM Securities, conducts diligence on of the issuer, including detailed background checks, criminal checks, bad actor checks, and reference checks on sponsors. In addition to screening for any criminal background, we may also turn down sponsors due to poor reference checks, even if the background and criminal checks are satisfactory.
We require unaffiliated sponsors to use an unaffiliated third-party escrow agent.* When an investor makes an investment with such sponsors using the RealtyMogul platform, the investor’s money is transferred directly into a third-party escrow account. All closing conditions in connection with a sponsor’s contingency offering need to be met before the third-party escrow agent will approve releasing investor funds to the issuer or general partner. For example, if an issuer or general partner plans to use funds for a real estate acquisition that does not ultimately transact, the third-party escrow agent will not transfer investor funds to the issuer or general partner, and funds will be returned to investors.
* Unless otherwise disclosed, escrow accounts are not required for some investments that accommodate 1031 investments where the property is already acquired.
Our processes typically includes visiting certain properties (or a subset of properties if it's a fund) to confirm the real estate is what and where the real estate is supposed to be. For certain properties that accommodate 1031 exchange investments, the team will review third-party prepared due diligence reports in lieu of a site visit.
We have formalized processes and checklists for every private placement deal listed on the platform.


Though the current owners have been good stewards of the Property, there exists an opportunity to capture significant upside via a thoughtful and strategic renovation. In addition to renovation upside, the Property will benefit significantly from improved management practices and the capture of loss-to-lease on current rents.

Tides has created economies of scale in this micro-location in which the Property will be their fourth asset and should be able to improve management efficiencies across the four properties.

There is ample opportunity to improve upon the existing scope, and planned renovations will follow the Tides Equities brand design, which includes new quartz countertops, stainless steel appliances, upgraded shaker-style cabinets with pulls, brushed nickel hardware, upgraded plumbing & lighting fixtures, a contemporary paint scheme, wood-like flooring and adding washers/dryers to each unit. This focus on interiors and accretive exterior improvements will allow Tides Equities to go on offense Day 1, driving up income with minimal transitional friction.
Tides Equities
Tides Equities is a leading Commercial Real Estate Investment Company focused on investments throughout the Western United States. They specialize in well-located, Class-B, and Core Plus multifamily real estate with high value-add upside. Tides Equities brings institutional-grade acquisitions acumen and operational efficiency across all realms of multifamily real estate. One of the primary ways Tides provides value to their partners is through identifying and securing off-market transactions. Tides has acquired 23,300+ multifamily units across Arizona, Texas and Las Vegas with a total acquired portfolio value worth $4.6 billion, with 55% of that portfolio being acquired off-market. Tides has executed 27 dispositions totaling 6,100+ units for a net IRR of 54% and 1.9x MOIC.
Tides Equities has created a programmatic partnership with The Robinson Group, a property management company based in Phoenix. The Robinson Group acts as Tides' onsite arm for the execution of business plans, both on the management and construction management sides. In concert with Tides' expansion into the Dallas and Las Vegas markets, The Robinson Group has opened a Dallas office and relocated team members deeply familiar with the Tides process to Dallas and Las Vegas. In addition to the construction managers at The Robinson Group, Tides works directly with the same pre-approved general contractors, who know exactly how their renovations are done and are ready to start work on Day 1 of ownership with a minimal learning curve. The overarching theme of the Tides execution plan is efficiency by repetition and standardization. Tides now has a symbiotic relationship with the entire chain of vertical integration and can reproduce excellent results at any asset acquired.
https://www.tidesequities.com/-
 Ryan AndradePrincipal
 -
 Sean KiaPrincipal
Ryan Andrade has built a successful real estate career with expertise in acquisitions, investor relations, mortgage financing, sales brokerage, and financial modeling. Prior to his role as Co-Founder and Principal of Tides Equities, LLC, Mr. Andrade held a position as an Acquisitions Manager at TruAmerica Multifamily, one of the premier owners and operators of multifamily real estate in the United States. During his tenure at TruAmerica, Mr. Andrade managed the acquisition of over $2BN of value-add multifamily assets. Prior to TruAmerica, Mr. Andrade financed over $5BN in loan proceeds with Freddie Mac Multifamily, first in an underwriting capacity and later through loan originations. Further relevant past positions include roles with Deloitte & Touche LLP, as well as Sotheby’s International Realty. Mr. Andrade graduated Magna Cum Laude from the University of California, Santa Barbara with a Bachelor of Arts degree in Business-Economics and concentrations in Accounting and Entrepreneurship.
Sean Kia has amassed extensive experience in commercial real estate that covers a wide range of disciplines including sourcing new acquisitions, financial modeling, direct lending, mortgage banking, and asset management. Prior to his role as Co-Founder and Principal of Tides Equities, LLC, Mr. Kia worked for Benedict Canyon Equities (BCE), a national real estate investment company focusing on multifamily value-add acquisitions in the United States. During his tenure at BCE, Mr. Kia was a lead underwriter for new acquisitions and played a significant role in the portfolio management of BCE’s $2BN portfolio. Prior to BCE, Mr. Kia contributed in managing a $4BN dollar portfolio for JRK Property Holdings, another national real estate investment company focusing on multifamily value-add acquisitions in the United States. Mr. Kia holds a Bachelor of Science degree in Business, with a concentration in Finance from Boston University School of Management.
Tides Equities Current Portfolio as of March 2022
| Property Name | Purchase Date | Year Built | Units | State | Purchase Price | Total Cost |
| Tides at 5400 | 3/17/2022 | 1981 | 168 | TX(2) | ||
| Tides on Cave Creek | 3/15/2022 | 1986 | 206 | AZ | $59,000,000 | $66,960,000 |
| Tides on 7th | 3/1/2022 | 1983 | 308 | AZ | $105,000,000 | $115,333,232 |
| Tides on 71st | 2/28/2022 | 1985 | 1,012 | AZ | $255,000,000 | $278,500,000 |
| Tides at North Dallas | 2/17/2022 | 1980 | 232 | TX | ||
| Tides on Esperanza | 2/4/2022 | 1975/1980 | 370 | TX | ||
| Tides at Green Valley | 1/27/2022 | 1988 | 376 | NV | $113,500,000 | $126,495,000 |
| Tides on Trinity | 1/25/2022 | 1996/2000 | 500 | TX | ||
| Tides on Chadwick | 1/21/2022 | 2009 | 264 | TX | ||
| Tides on Gilbert East | 1/18/2022 | 1987 | 152 | AZ | $40,800,000 | $46,660,000 |
| Tides on Gilbert West | 1/18/2022 | 1985 | 113 | AZ | $30,700,000 | $35,300,000 |
| Tides on 44th | 1/18/2022 | 1983 | 256 | AZ | $50,950,000 | $59,434,725 |
| Tides on Copper Creek | 1/13/2022 | 1978/1986/2016 | 636 | TX | ||
| Tides at North Paradise | 1/7/2022 | 1972 | 557 | NV | $105,900,000 | $122,520,000 |
| Tides on Park Lane | 1/7/2022 | 1975 | 343 | TX | ||
| Tides at East Summerlin | 1/5/2022 | 1984 | 168 | NV | $36,900,000 | $43,025,000 |
| Tides at Highland Meadows | 12/22/2021 | 1984 & 1986 | 650 | TX | ||
| Tides on Twain | 12/1/2021 | 1989 | 192 | NV | $40,000,000 | $47,269,000 |
| Tides on Indios | 12/1/2021 | 1990 | 152 | NV | $29,500,000 | $35,492,221 |
| Tides at Papago (1) | 12/1/2021 | 1982 | 199 | AZ | $44,500,000 | $49,136,210 |
| Tides at Lewisville | 12/1/2021 | 1994 | 404 | TX | ||
| Tides on Haverwood | 12/1/2021 | 1994 | 376 | TX | ||
| Tides on Southern | 11/30/2021 | 1984 | 306 | AZ | $84,250,000 | $92,500,000 |
| Tides at Mesa | 11/30/2021 | 1986/1987 | 464 | AZ | $133,250,000 | $145,000,000 |
| Tides at Meadowbrook | 11/29/2021 | 1984 | 154 | TX | ||
| Tides on McDowell | 11/19/2021 | 1985 | 274 | AZ | $59,600,000 | $67,550,000 |
| Tides on East Cactus | 11/17/2021 | 1981 | 179 | AZ | $28,640,000 | $34,400,000 |
| Tides on Wynn | 11/16/2021 | 1979/1980/1983 | 555 | NV | $113,500,000 | $129,490,000 |
| Tides on West Dunlap | 11/16/2021 | 1982 | 137 | AZ | $32,000,000 | $36,700,000 |
| Tides at Eastchase | 10/29/2021 | 1984 | 340 | TX | ||
| Tides on Osborn | 10/22/2021 | 1981 | 185 | AZ | $43,750,000 | $50,615,000 |
| Tides at Park43 | 10/19/2021 | 1998 | 240 | TX | ||
| Tides on Charleston | 10/19/2021 | 1980 | 508 | NV | $110,000,000 | $125,100,000 |
| Tides on Dunlap (1) | 10/18/2021 | 1973 | 288 | AZ | $67,400,000 | $74,855,090 |
| Tides on South Lamar | 10/12/2021 | 1983 | 217 | TX | ||
| Tides on Duneville | 10/8/2021 | 1986 | 228 | NV | $50,250,000 | $56,818,000 |
| Tides on West Cheyenne | 9/30/2021 | 1984 | 180 | NV | $37,050,000 | $42,933,240 |
| Tides at Spring Mountain | 9/23/2021 | 1981 | 225 | NV | $35,500,000 | $42,213,597 |
| Tides on McCallum North | 9/9/2021 | 1988 | 297 | TX | ||
| Tides at Lakewood | 9/2/2021 | 1986 | 252 | TX | ||
| Tides on McCallum South | 8/30/2021 | 1985 | 322 | TX | ||
| Tides on Ranchview | 8/23/2021 | 1999 | 357 | TX | ||
| Tides on East Broadway | 8/18/2021 | 1972 | 262 | AZ | $53,100,000 | $60,509,687 |
| Tides on Mountain Vista | 7/30/2021 | 1979 | 178 | NV | $29,000,000 | $34,700,000 |
| Tides at Plano | 7/13/2021 | 1995 | 167 | TX | ||
| Tides on Overton Ridge | 7/13/2021 | 1985 | 416 | TX | ||
| Tides at Lake Village | 7/1/2021 | 1983 | 321 | TX | ||
| Tides at Woodhaven | 6/30/2021 | 1979 | 332 | TX | ||
| Tides at Palm Valley | 6/30/2021 | 1997 | 264 | AZ | $71,800,000 | $77,300,000 |
| Tides on Green Oaks | 6/30/2021 | 1983 | 188 | TX | ||
| Tides on 51st | 6/28/2021 | 1981 | 264 | AZ | $30,000,000 | $35,057,178 |
| Tides on Glendale | 6/10/2021 | 1983 | 307 | AZ | $47,550,000 | $54,263,840 |
| Tides at Cheyenne | 6/4/2021 | 1999 | 204 | NV | $35,000,000 | $41,283,048 |
| Tides on Post Oak | 5/28/2021 | 1983 | 360 | TX | ||
| Tides on Tropicana | 5/26/2021 | 1995 | 252 | NV | $54,000,000 | $60,853,192 |
| Tides at Valley Ranch | 6/1/2021 | 1998 | 267 | TX | ||
| Tides on Westchester | 5/25/2021 | 1997 | 316 | TX | ||
| Tides at Bear Creek | 5/25/2021 | 1997 | 256 | TX | ||
| Tides on Harwood | 5/25/2021 | 1998 | 424 | TX | ||
| Tides on Randol West | 5/14/2021 | 1984 | 208 | TX | ||
| Tides on West Indian School | 5/11/2021 | 1984 | 213 | AZ | $37,860,000 | $43,246,008 |
| Tides on Rosemeade East | 4/30/2021 | 1991 | 252 | TX | ||
| Tides on Rosemeade West | 4/30/2021 | 1987 | 200 | TX | ||
| Tides at Paradise Valley (1) | 4/29/2021 | 1986 | 380 | AZ | $83,000,000 | $90,387,476 |
| Tides at Deer Valley (1) | 4/29/2021 | 1984 | 436 | AZ | $86,500,000 | $93,785,718 |
| Tides at Spring Valley | 4/29/2021 | 1988 | 218 | NV | $36,900,000 | $42,354,119 |
| Tides on North Collins | 3/29/2021 | 1983 | 296 | TX | ||
| The Tides Waterfront | 3/25/2021 | 1986 | 386 | TX | ||
| Tides on Randol East | 3/22/2021 | 1984 | 356 | TX | ||
| Tides at North Arlington | 2/3/2021 | 1978 | 436 | TX | ||
| Tides on University | 3/31/2021 | 1978 | 286 | AZ | $35,175,000 | $41,964,744 |
| Tides at Downtown Chandler | 1/29/2021 | 1986 | 374 | AZ | $54,250,000 | $62,270,654 |
| Tides on 61st | 12/18/2020 | 1984 | 156 | AZ | $19,750,000 | $23,946,875 |
| Tides at East Glendale | 12/4/2020 | 1987 | 430 | AZ | $53,500,000 | $62,368,020 |
| Tides on Country Club | 11/3/2020 | 1986 | 582 | AZ | $83,000,000 | $95,012,381 |
| Tides on South Mill | 9/24/2020 | 1969 | 515 | AZ | $77,000,000 | $84,815,675 |
| Tides at Chandler | 9/16/2020 | 1985 | 248 | AZ | $46,025,000 | $50,543,000 |
| Tides at South Tempe (1) | 6/23/2020 | 1979 | 442 | AZ | $71,500,000 | $77,614,167 |
| Tides at Grand Terrace | 10/24/2019 | 1986 | 366 | CA | $72,250,000 | $80,258,062 |
| Current Portfolio Total | 24,900 | $4,473,815,220 | $5,124,685,297 |
(1) Denotes asset was recapitalized with a new partner as an arms-length transaction
(2) Tides Equities currently manages 11,100 units in Texas with an aggregate purchase price of $1.67Bn and total cost of $1.96Bn
Tides Equities Dispositions as of March 2022
| Property Name | Purchase Date | Year Built | Units | State | Purchase Price | Total Cost | Sale Date | Disposition Price | IRR | EMx |
| Tides on 61st (1) | 1/29/2021 | 1984 | 156 | AZ | $19,750,000 | $21,033,208 | 4/29/2022 | $38,500,000 | N/A | N/A |
| Tides at North Avondale | 7/24/2020 | 1984 | 120 | AZ | $16,200,000 | $20,666,843 | 12/21/2021 | $32,300,000 | 131.7% | 3.3x |
| Tides at Papago | 11/20/2020 | 1982 | 199 | AZ | $30,100,000 | $34,541,619 | 12/1/2021 | $44,500,000 | 135.2% | 2.4x |
| Tides on 19th | 7/24/2020 | 1973 | 236 | AZ | $27,000,000 | $33,806,098 | 11/30/2021 | $59,080,000 | 159.5% | 3.6x |
| Tides on Main | 10/13/2020 | 1985 | 472 | AZ | $86,500,000 | $94,744,983 | 11/29/2021 | $137,000,000 | 158.0% | 2.9x |
| Tides on Lemon | 5/23/2018 | 1966 | 65 | AZ | $7,500,000 | $9,300,000 | 11/23/2021 | $15,250,000 | 42.4% | 3.1x |
| Tides on Dunlap | 10/15/2020 | 1973 | 288 | AZ | $40,500,000 | $42,653,735 | 10/18/2021 | $67,400,000 | 185.0% | 2.9x |
| Tides Lakeside | 9/1/2018 | 1974 | 244 | AZ | $38,500,000 | $43,045,977 | 8/20/2021 | $64,500,000 | 27.3% | 2.0x |
| Tides on 50th | 12/19/2019 | 1973 / 1996 | 155 | AZ | $21,000,000 | $24,927,551 | 7/23/2021 | $34,275,000 | 99.7% | 3.0x |
| Tides on 17th | 12/11/2019 | 1986 | 160 | AZ | $18,725,000 | $23,214,799 | 6/8/2021 | $27,710,000 | 63.8% | 2.1x |
| Tides on 25th | 8/19/2019 | 1975 | 240 | AZ | $24,500,000 | $32,160,000 | 5/27/2021 | $40,625,000 | 71.2% | 2.6x |
| Tides at Paradise Valley | 8/27/2019 | 1986 | 380 | AZ | $57,250,000 | $59,774,081 | 4/29/2021 | $83,000,000 | 73.6% | 2.5x |
| Tides at Deer Valley | 7/1/2019 | 1984 | 436 | AZ | $56,700,000 | $60,417,548 | 4/29/2021 | $86,500,000 | 69.3% | 2.6x |
| Tides on 28th | 6/28/2019 | 1980 | 224 | AZ | $24,000,000 | $29,730,000 | 2/11/2021 | $34,800,000 | 56.7% | 2.1x |
| Tides on 5th | 12/11/2018 | 1966 | 197 | AZ | $27,500,000 | $33,120,000 | 1/29/2021 | $39,000,000 | 37.1% | 1.9x |
| Tides at Downtown Tempe | 1/18/2019 | 1971 | 227 | AZ | $31,300,000 | $37,690,000 | 1/27/2021 | $44,625,000 | 39.1% | 1.9x |
| Tides on Rail | 5/3/2019 | 1979 | 488 | AZ | $39,750,000 | $45,116,812 | 12/17/2020 | $60,000,000 | 67.9% | 2.3x |
| Tides at East Arcadia | 12/21/2018 | 1980 | 181 | AZ | $26,600,000 | $29,047,282 | 12/16/2020 | $38,000,000 | 44.3% | 2.0x |
| Tides at North Phoenix | 1/2/2019 | 1982 | 316 | AZ | $33,500,000 | $35,763,626 | 12/4/2020 | $54,000,000 | 66.4% | 2.6x |
| Tides on Thomas | 2/22/2018 | 1980 | 187 | AZ | $15,250,000 | $17,699,014 | 7/31/2020 | $24,500,000 | 38.1% | 2.2x |
| Tides at South Tempe | 10/1/2018 | 1979 | 442 | AZ | $55,500,000 | $58,875,456 | 6/23/2020 | $71,500,000 | 38.8% | 1.7x |
| Tides on Thunderbird | 5/23/2018 | 1981 | 376 | AZ | $37,250,000 | $40,639,490 | 2/18/2020 | $55,400,000 | 42.5% | 1.8x |
| Tides on Mill | 8/1/2018 | 1972 | 167 | AZ | $19,000,000 | $20,674,445 | 2/27/2020 | $25,600,000 | 33.5% | 1.6x |
| Tides on Broadway | 5/4/2018 | 1983 | 155 | AZ | $14,500,000 | $15,900,433 | 10/1/2019 | $21,000,000 | 49.2% | 1.8x |
| Tides at Old Town | 6/22/2017 | 1975 | 64 | AZ | $6,900,000 | $8,240,000 | 12/20/2019 | $10,500,000 | 26.2% | 1.8x |
| Tides at Downtown Gilbert | 10/20/2017 | 2005 | 42 | AZ | $6,764,000 | $7,750,000 | 8/16/2019 | $10,540,000 | 42.0% | 2.0x |
| Coronado 137 | 1/19/2018 | 1971 | 43 | AZ | $4,100,000 | $5,340,000 | 10/23/2019 | $7,500,000 | 43.5% | 1.9x |
| Tides at Arcadia | 9/1/2016 | 1965 | 49 | AZ | $3,200,000 | $3,960,000 | 4/12/2018 | $6,300,000 | 83.7% | 2.5x |
| Total Dispositions | 6,309 | $789,339,000 | $889,833,001 | $1,233,905,000 | ||||||
| Total Current Portfolio and Dispositions | 31,209 | $5,263,154,220 | $6,014,518,298 | $6,358,590,297 | ||||||
| Total Transaction Volume | 37,518 | $7,248,423,298 |
(1) Denotes asset was recapitalized with a new partner as an arms-length transaction
Tides' Nearest Assets
The above bios and track record were provided by Tides Equities and have not been independently verified by RealtyMogul.
Built in 1986, the community’s unit mix consists of one-bedroom/one bathroom and two-bedroom/two bathroom floor plans that range in size from ±523 to ±1,079 square feet. Though the property has numerous common area amenities such as a swimming pool, turf soccer field, playground, clubhouse, dog park, and BBQ/Picnic Area, the exterior is primed for a further makeover, and the business plan calls for a full re-branding of the Property, including a name change and design upgrade. The Property features classic and partially renovated units which very much remain a blank canvas. There is ample opportunity to improve upon the existing scope, and planned renovations will follow the Tides Equities brand design, which includes new quartz countertops, stainless steel appliances, upgraded shaker-style cabinets with pulls, brushed nickel hardware, upgraded plumbing & lighting fixtures, a contemporary paint scheme, wood-like flooring and adding washers/dryers. This focus on interiors and accretive exterior improvements will allow Tides Equities to go on offense Day 1, driving up income with minimal transitional friction.
The business plan calls for a capital event to occur within a two-year period, via a sale or a cash-out refinance. Underwritten returns assume a sale in Year Two, though Tides Equities would perform a full-sale vs. refinance analysis upon completion of the renovation program and will elect whichever option is deemed most prudent given market conditions at the time. An additional scenario exists to sell the property partially renovated, with a future buyer paying a premium for the additional upside.
Project Budget
| Acquisition Cost | $ Amount | Per Unit |
| Purchase Price | $33,000,000 | $120,438 |
| Closing Costs(1) | $2,184,402 | $7,972 |
| Mortgage Brokerage Fee | $523,050 | $1,909 |
| Acquisition Fee | $495,000 | $1,807 |
| Prepaid Expenses | $563,145 | $2,055 |
| Total Acquistion Costs | $36,765,597 | $134,181 |
| Interior Capital Expenditures | ||
| Stainless Steel Appliances | $548,000 | $2,000 |
| Light Fixtures | $82,200 | $300 |
| Wood-like Vinyl Roll Flooring | $330,008 | $1,204 |
| Interior Paint | $257,819 | $941 |
| Brushed Nickel Hardware | $82,200 | $300 |
| Updated Countertops | $411,000 | $1,500 |
| Upgraded Cabinets | $548,000 | $2,000 |
| Plumbing Fixtures | $82,200 | $300 |
| Backsplash | $82,200 | $300 |
| Add W/D | $488,200 | $1,782 |
| Miscellaneous | $822,000 | $3,000 |
| Interior Subtotal | $3,733,827 | $13,627 |
| Exterior Capital Expenditure | ||
| Paint | $200,000 | $730 |
| Pool Furnishings | $15,000 | $55 |
| Clubhouse | $50,000 | $182 |
| Lighting | $35,000 | $128 |
| Full Signage Package | $30,000 | $109 |
| Solar Screens | $55,000 | $201 |
| Landscaping | $55,000 | $201 |
| Tides Horizontal Wood | $80,000 | $292 |
| Common Area (BBQ areas, dog park, cornhole, sports courts or other additions) | $75,000 | $274 |
| Miscellaneous | $75,000 | $274 |
| Exterior Subtotal | $670,000 | $2,445 |
| Deferred Maintenance and Fees | ||
| Deferred Maintenance | $1,000,000 | $3,650 |
| CapEx Contingency (5% of CapEx and Deferred Maintenance) | $270,191 | $986 |
| Construction Management Fee (7% of CapEx and Deferred Maintenance) | $378,268 | $1,381 |
| Subtotal | $1,648,459 | $6,016 |
| Capital Expenditure Total | $6,052,286 | $22,089 |
| Grand Total | $42,817,883 | $156,270 |
(1) RM Technologies, LLC, an affiliate of RealtyMogul, operates the RealtyMogul Platform. RM Technologies, LLC charges a fixed, non-percentage-based fee for real estate companies and their sponsors to use the Platform and for Platform-related services. Please see the Fees and Disclaimers sections below for additional information concerning fees paid to RM Technologies, LLC. The Sponsor’s equity contribution may consist of friends and family equity and equity from funds controlled by the Sponsor.
Investor Q&A - 6/14/2022
Tides on Oakland Hills is a rare apartment community located in the East Fort Worth submarket which has immense value-add upside in a strong and upwardly trending location. Situated on approximately twelve acres of land, the Property consists of 17 two- and three-story garden-style buildings, totaling 274 units.
Unit Mix
| Unit Type | # of Units | Avg SF/Unit | Avg Rent (In-Place) | Avg Rent (Stabilized) | Rent per SF (Stabilized) |
| 1x1 | 50 | 523 | $805 | $1,040 | $1.54 |
| 1x1 | 75 | 652 | $865 | $1,110 | $1.33 |
| 1x1 | 43 | 745 | $923 | $1,160 | $1.24 |
| 1x1 | 30 | 748 | $934 | $1,170 | $1.25 |
| 2x2 | 24 | 892 | $1,074 | $1,290 | $1.20 |
| 2x2 | 6 | 948 | $1,111 | $1,360 | $1.17 |
| 2x2 | 46 | 1,079 | $1,186 | $1,440 | $1.10 |
| Total/Averages | 274 | 753 | $948 | $1,188 | $1.58 |
Lease Comparables
| Tides at Meadowbrook | Tides at Woodhaven | The Borough Apartments | Verano Oaks | Bella Via Apartments | Comps Average | Tides on Oakland Hills (Subject) | |
| Year Built | 1984 | 1979 | 1978 | 1985 | 1986 | 1986 | |
| # of Units | 154 | 332 | 208 | 112 | 80 | 274 | |
| Distance from Subject | 0.8 mi | 0.5 mi | 0.3 mi | 4.4 mi | 0.8 mi | ||
| $/Unit (1x1) | $1,065 | $999 | $945 | $955 | $991 | $1,045 | |
| SF (1x1) | 569 | 636 | 502 | 530 | 559 | 523 | |
| $/SF (1x1) | $1.87 | $1.57 | $1.88 | $1.80 | $1.77 | $2.00 | |
| (1x1.5) | |||||||
| $/Unit (1x1) | $1,165 | $1,029 | $1,085 | $1,219 | $1,045 | $1,109 | $1,115 |
| SF (1x1) | 776 | 717 | 674 | 706 | 658 | 706 | 652 |
| $/SF (1x1) | $1.50 | $1.44 | $1.61 | $1.73 | $1.59 | $1.57 | $1.71 |
| $/Unit (1x1) | $1,079 | $1,135 | $1,107 | $1,165 | |||
| SF (1x1) | 786 | 820 | 803 | 745 | |||
| $/SF (1x1) | $1.37 | $1.38 | $1.38 | $1.56 | |||
| (2x1) | (2x1.5) | (2x1) | |||||
| $/Unit (2x2) | $1,295 | $1,169 | $1,075 | $1,190 | $1,182 | $1,295 | |
| SF (2x2) | 929 | 861 | 958 | 860 | 902 | 892 | |
| $/SF (2x2) | $1.39 | $1.36 | $1.12 | $1.38 | $1.31 | $1.45 | |
| (2x1) | |||||||
| $/Unit (2x2) | $1,395 | $1,225 | $1,475 | $1,365 | $1,365 | ||
| SF (2x2) | 1,028 | 955 | 1,050 | 1,011 | 948 | ||
| $/SF (2x2) | $1.36 | $1.28 | $1.40 | $1.35 | $1.44 | ||
| (2x2.5) | |||||||
| $/Unit (2x2) | $1,445 | $1,299 | $1,412 | $1,290 | $1,362 | $1,445 | |
| SF (2x2) | 905 | 1,115 | 1,060 | 1,033 | 1,028 | 1,079 | |
| $/SF (2x2) | $1.60 | $1.17 | $1.33 | $1.25 | $1.32 | $1.34 |
Sales Comparables
| Trinity Heights | Diamond Loch | Barrett Creek | Tides at Meadowbrook | 1505 Exchange | Comps Average | Tides on Oakland Hills (Subject) | |
| Date Sold | Dec-22 | May-22 | Apr-22 | Nov-22 | Jun-22 | ||
| Year Built | 1985 | 1978 | 1985 | 1984 | 1980 | 1982 | 1986 |
| # of Units | 316 | 138 | 256 | 154 | 256 | 224 | 274 |
| Average Unit Size | 843 SF | 1,009 SF | 893 SF | 813 SF | 870 SF | 885 SF | 753 SF |
| Sale Price | $44,000,000 | $19,050,667 | $33,086,667 | $19,600,000 | $31,273,334 | $29,402,133 | $33,000,000 |
| $/Unit | $139,241 | $138,048 | $129,245 | $127,273 | $122,161 | $131,193 | $120,438 |
| $/SF | $165.02 | $136.68 | $144.71 | $157.00 | $140.26 | $148.73 | $160.00 |
| Distance from Subject | 0.6 mi | 4.7 mi | 4.1 mi | 1.1 mi | 1.7 mi | 2.4 mi |
Market Overview
The Dallas/Fort Worth Metroplex is the fourth-most populous metro in the nation with an aggregate of more than 7.1 million residents. It is composed of 13 counties stretching nearly 10,000 square miles. The city of Dallas houses 1.3 million people, followed by Fort Worth with 800,000 residents. Strong job growth continually draws new residents to the region. To accommodate the additional traffic, the region’s transportation network is evolving. Traffic flow is improved as freeways are expanded and miles are being added to tollways and turnpikes. The growth of the transportation network is vital to supporting commuters to the metro’s numerous corporations and growing industries.
- The Metroplex’s temperate climate, no state income tax, and a right-to-work labor policy attract employers.
- Dallas/Fort Worth is one of the nation’s largest employment markets, with nearly 3.6 million jobs.
- The region is home to 21 Fortune 500 companies in a variety of sectors, including ExxonMobil, American Airlines Group, Southwest Airlines, Fluor, AT&T, Tenet Healthcare, Kimberly-Clark and J.C. Penney.
- The area is forecast to add jobs at an annual rate of 1.5 percent through 2021, well above the U.S. level.
- Economic expansion will be further fueled by a rise in financial services and high-tech companies.
Submarket Overview
The East Fort Worth submarket has been one of the top-performing submarkets in all of DFW as it achieved 8.3% rent growth in 2021 and 96.4% occupancy. All of which has been heavily driven by the massive 33% population growth since 2010, which is projected to increase another 10% by 2025. The Real Estate Company believes the strong performance of the submarket, aligned with a comprehensive interior renovation program presents an opportunity to capitalize on loss to lease at the Property. The Property has direct access to I-30 and Highway 820 interchange; which accommodates 225,000 VPD allowing easy access throughout the metroplex. The Property provides tenants with easy access to numerous big box retailers and grocers, the metroplex’s most popular sports and entertainment venues such as the newly developed Texas Live!, and the ability to reach major DFW employment centers within 30 minutes of drive time. Proximity to the I-30 and I-820 interchanges allows residents access to a multitude of DFW’s employment and service providers including River Bend Business Park (6 min), East Chase Shopping Center (11 min), Fort Worth CBD (16 min), Texas Health Harris Methodist Hospital Fort Worth (17 min), American Airlines Headquarters (20 min) and Bank of America Headquarters (20 min). In addition, there are also many big box retailers in the area that include Home Depot, Albertsons, Family Dollar, CVS, Fiesta Mart, Marshalls, Target, Ross Dress for Less, and ALDI less than 15 minutes away from the Property.


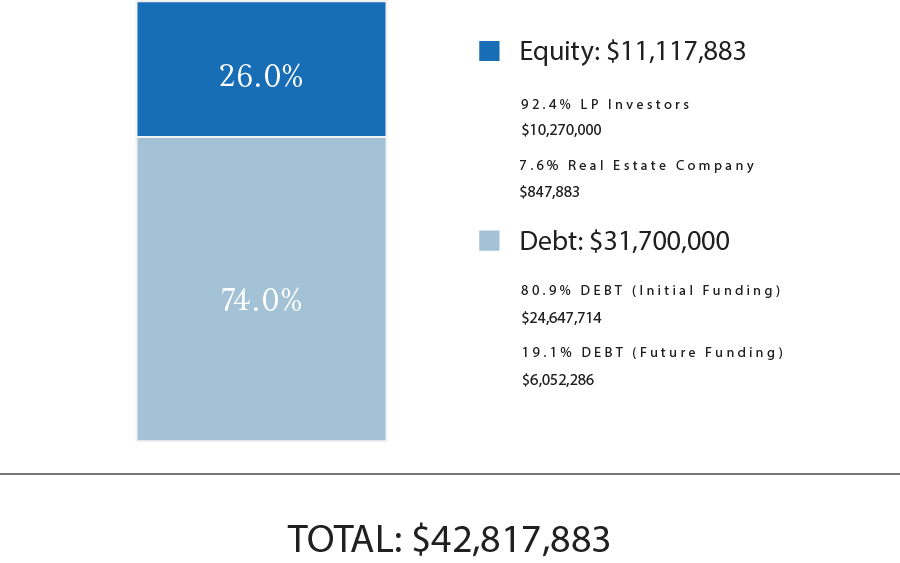
Total Capitalization
| Sources of Funds | $ Amount | $/Unit |
| Debt (Initial Funding) | $25,647,714 | $93,605 |
| Debt (Future Funding) | $6,052,286 | $22,089 |
| GP Investor Equity | $847,883 | $3,094 |
| LP Investor Equity | $10,270,000 | $37,482 |
| Total Sources of Funds | $42,817,883 | $156,270 |
| Uses of Funds | $ Amount | $/Unit |
| Purchase Price | $33,000,000 | $120,438 |
| Closing Costs(1) | $3,202,452 | $11,688 |
| Hard Costs and Deferred Maintenance | $6,052,286 | $22,089 |
| Prepaid Expenses | $563,145 | $2,055 |
| Total Uses of Funds | $42,817,883 | $156,270 |
(1) RM Technologies, LLC, an affiliate of RealtyMogul, operates the RealtyMogul Platform. RM Technologies, LLC charges a fixed, non-percentage-based fee for real estate companies and their sponsors to use the Platform and for Platform-related services. Please see the Fees and Disclaimers sections below for additional information concerning fees paid to RM Technologies, LLC.
The expected terms of the debt financing are as follows:
- Lender: MF1
- Term: 2 years + three 1-year extensions
- LTC: 74.0%
- Estimated Proceeds: $31,700,000
- Interest Type: Floating
- Spread above one-month SOFR: 4.25%
- Interest-Only Period: 60 months
- Amortization: None (Interest-Only)
- Prepayment Terms: 12-month lock-out/yield maintenance in place for the first 12 months
An Exit Fee of 0.50%; provided that the Exit Fee will be waived if the Loan is refinanced with a fixed-rate loan originated by Lender or if the Property is sold. - Extension Requirements: Two years (plus any partial accrual period at the beginning of the term) (the “Initial Term”), with three available 12-month extension terms (each, an “Extension Term”, and together with the Initial Term, the “Term”), subject to Lender’s extension conditions, including the following:
(1) 30-day advanced notice to Lender;
(2) No payment for the first extension. Payment of an extension fee equal to 0.25% of the Loan Amount for the second and third extensions;
(3) No minimum Debt Yield for the first extension. A minimum Debt Yield of 6.50% for the first extension, and 7.00% for the second extension;
(4) Borrower must have completed the Renovation Plan substantially in accordance with the renovation schedule contained in the Renovation Plan; and
(5) Purchase of an acceptable Rate Cap for the applicable Extension Term, in the amount of the Loan, at a Strike Rate that results in a DSCR of not less than 1.0:1.0 based on the ratio of Underwritten NCF to projected debt service. - Modeled Refinance: No
There can be no assurance that the Sponsor will secure debt on the rates and terms noted above, or at all. All of the Sponsor’s estimated rates and terms of the debt financing are subject to lender approval, including but not limited to possible increases in capital reserve requirements for funds to be held in a lender-controlled capital reserve account.
A substantial portion of the total acquisition for the Property will be paid with borrowed funds. The use of borrowed money to acquire real estate is referred to as leveraging. Leveraging increases the risk of loss. If the Sponsor were unable to pay the payments on the borrowed funds (called a "default"), the lender might foreclose, and the Sponsor could lose its investment in its property.
Tides Equities intends to make distributions from Tides on Oakland Hills Investors, LLC as follows:
- To the Investors, pari passu, all operating cash flows to an 8.0% IRR;
- 64.75% / 35.25% (64.75% to Investors / 35.25% to Promoted/Carried Interest) of excess cash flow to a 12.0% IRR;
- 55.50% / 44.50% (55.50% to Investors / 44.50% to Promote/Carried Interest) of excess cash flow to a 18.0% IRR;
- 41.62% / 58.38% (41.62% to Investors / 58.38% to Promote/Carried Interest) of excess cash flow thereafter.
Tides Equities intends to make distributions to investors after the payment of the company's liabilities (loan payments, operating expenses, and other fees as more specifically set forth in the LLC agreements, in addition to any member loans or returns due on member loan).
Distributions are expected to start in July 2024. Distributions are at the discretion of Tides Equities, who may decide to delay distributions for any reason, including maintenance or capital reserves.
Tides Equities will receive a promoted/carried interest as indicated above, and a portion of this promoted/carried interest may be received by RM Admin, LLC.
| Cash Flow Summary | ||||
| Pre-Acquisition | Year 1 | Year 2 | Year 3 | |
| Effective Gross Revenue | $2,986,394 | $3,199,362 | $3,945,442 | $4,393,425 |
| Total Operating Expenses | $1,905,597 | $1,788,719 | $1,931,094 | $1,945,424 |
| Net Operating Income | $1,080,797 | $1,410,643 | $2,014,348 | $2,448,001 |
| Project-Level Cash Flows | ||||
| Year 0 | Year 1 | Year 2 | ||
| Net Cash Flow | ($11,117,883) | $0 | $17,804,690 | |
| Investor-Level Cash Flows(1) | ||||
| Year 0 | Year 1 | Year 2 | ||
| Net Cash Flow | ($10,270,000) | $0 | $14,840,647 | |
| Investor-Level Cash Flows - Hypothetical $50,000 Investment(1) | ||||
| Year 0 | Year 1 | Year 2 | ||
| Net Cash Flow | ($50,000) | $0 | $72,252 | |
(1) Returns are net of all fees. Such Fees include fees paid to RM Admin, an affiliate of RealtyMogul, who charges an annual fixed administrative fee for providing certain ongoing administrative services to the Sponsor. Please see the Fees and Disclaimers sections and Disclaimers sections below for additional information concerning fees paid to RM Admin.
RM Technologies, LLC and its affiliates does not provide any assurance of returns. The content on this Page, including Sponsor’s pro forma projections, was provided by the Sponsor or an affiliate thereof. Although RM Technologies, LLC believes the Sponsor reliably produced this content, RM Technologies, LLC makes no representations or warranties as to the accuracy of such information and accepts no liability therefor. The assumptions and projections included in the content on this Page, including the Sponsor’s pro forma projections, are not reflective of the position of RM Technologies, LLC or any other person or entity other than the Sponsor or its affiliates. There can be no assurances that all or any of the Sponsor’s assumptions will be true, that actual performance will bear any relation to these hypothetical illustrations, or that the Sponsor’s investment objectives will be achieved. For additional information concerning the Sponsor’s assumptions and projections, and the significant risks involved in investing in real estate, please see the Disclaimers section below.
Certain fees and compensation will be paid over the life of the transaction; please refer to Tides Equities' materials for details. The following fees and compensation will be paid(1)(2)(3)(4):
| Real Estate Company Fees: | |||
| Type of Fee | Amount of Fee | Received By | Paid From |
| Guarantor Fee (2) | $75,000 | Tides Equities | Capitalization |
| Acquisition Fee | $495,000 | Tides Equities | Capitalization |
| Recurring Fees: | |||
| Type of Fee | Amount of Fee | Received By | Paid From |
| Administrative Solutions Fee(4) | Flat quarterly fee of $125 per investor services through the Administration Solution | RM Technologies, LLC(3) | Cash Flow |
| Asset Management Fee | 1.5% of Effective Gross Income | Tides Equities | Cash Flow |
| Property Management Fee | 2.5% of Effective Gross Income | Sponsor Affiliate | Cash Flow |
| Construction Management Fee | 7.0% of Renovation and Deferred Maintenance Budget | Sponsor Affiliate | Cash Flow |
(1) Fees may be deferred to reduce impact to investor distributions.
(2) The Guarantee Fee is a flat $75,000 fee paid to the Sponsor in connection with the acquisition loan. The fee is paid irrespective of whether the acquisition loan is recourse or non-recourse.
(3) RM Technologies, LLC, an affiliate of RealtyMogul, operates the RealtyMogul Platform. RM Technologies, LLC charges a fixed, non-percentage-based fee for real estate companies and their sponsors to use the RM Technologies, LLC’s proprietary Platform and receive Platform-related services. An estimate of this fee is included in the Closing Costs above and is intended to be capitalized into the transaction at the discretion of the Sponsor. The Platform fees received by RM Technologies, LLC are disclosed in the relevant operating agreement(s). RM Technologies LLC’s receipt of Platform fees creates a conflict of interest between RealtyMogul and its affiliates, and investors or prospective investors.
(4) Only applies to equity raised through the RealtyMogul Platform
RM Securities, LLC, its registered representatives, affiliates, associated persons, and personnel of its affiliates who may also be associated with it, including our associated persons and personnel of our affiliates who are also be associated with RM Securities, LLC (it (“RM Securities,” “we,” “our,” or “us”) will receive fees, expense reimbursements, and other compensation (“Fees”) from the issuer of this investment offering, its sponsor, or an affiliate thereof (“Sponsor”), or otherwise in connection with Sponsor’s offering. The Fees paid to us are in addition to other fees you will pay to Sponsor or in connection with Sponsor’s investment offering. You will pay Fees to Sponsor, either directly or indirectly as an investor in the Sponsor’s offering. Sponsor will use the Fees you pay, as well as funds you invest in the relevant offering, to compensate us. The Fees paid to us will directly or indirectly be borne by you as the investor (typically, but not always, in the form of an expense of the Sponsor’s offering in which you invest) because such Fees will reduce the proceeds available for distribution to you and reduce the amount you earn over time.
For more information on the Fees paid to us, or any other Fees you will pay in connection with Sponsor’s offering, please carefully review the Sponsor’s Investment Documents. Please also carefully review RM Securities’ Form CRS, Regulation Best Interest Disclosures, and Limited Brokerage Services Agreement.
No Approval, Opinion or Representation, or Warranty by RM Securities, LLCSponsor has provided, approved, and is solely responsible in all aspects for the information on this webpage (“Page”), including Sponsor’s offering documentation, which may include without limitation the Private Placement Memorandum, Operating or Limited Partnership Agreement, Subscription Agreement, the Project Summary and all exhibits and other documents attached thereto or referenced therein (collectively, the “Investment Documents”). The Investment Documents linked on this page have been prepared and posted by Sponsor, and not by RM Securities. We did not assist in preparing, do not adopt or endorse, and we are not otherwise responsible for, the Sponsor’s Investment Documents. We make no representations or warranties as to the accuracy of information on this Page or in the Sponsor’s Investment Documents and we accept no liability therefor. No part of the information on this Page or in the Sponsor’s Investment Documents is intended to be binding on us.
Sponsor’s Information Qualified by Investment DocumentsThe information on this Page is qualified in its entirety by reference to the more complete information about the offering contained in the Sponsor’s Investment Documents. The information on this Page is not complete and subject to change at the Sponsor’s discretion at any time up to the closing date. The Sponsor’s Investment Documents and supplements thereto contain important information about the Sponsor’s offering including relevant investment objectives, the business plan, risks, charges, expenses, and other information, which you should consider carefully before investing. The information on this Page should not be used as a basis for an investor’s decision to invest.
Risk of InvestmentThis investment is speculative, highly illiquid, and involves substantial risk. There can be no assurances that all or any of Sponsor’s assumptions, expectations, estimates, goals, hypothetical illustrations, or other aspects of Sponsor’s business plans (“Assumptions”) will be true or that actual performance will bear any relation to Sponsor’s Assumptions, and no guarantee or representation is made that Sponsor’s Assumptions will be achieved. If Sponsor does not achieve its Assumptions, your investment could be materially and adversely affected. A loss of part or all of the principal value of your investment may occur. You should not invest unless you can readily bear the consequences of such loss. Sponsor’s Assumptions should not be relied upon as the primary basis for your decision to invest.
No Reliance on Forward-Looking Statements; Sponsor AssumptionsSponsor is solely responsible for statements made concerning forward-looking statements and Assumptions, which apply only as of the date made, are preliminary and subject to change, and are expressly qualified in their entirety by the disclosures and cautionary statements included in Sponsor’s Investment Documents, which you should carefully review. Neither RM Securities nor Sponsor are obligated to update or revise such forward-looking statements or Assumptions to reflect events or circumstances that arise after the date made or to reflect the occurrence of unanticipated events. Sponsor’s forward-looking statements and Assumptions are hypothetical, not based on actual investment achievements or events, and are presented solely for purposes of providing insight into the Sponsor’s investment objectives, detailing Sponsor’s anticipated risk and reward characteristics, and establishing a benchmark for future evaluation of actual results; therefore, they are not a predictor, projection, or guarantee of future results. You should not rely on Sponsor’s forward-looking statements as a basis to invest.
Importantly, we do not adopt, endorse, or provide any assurance of returns or as to the accuracy or reasonableness of Sponsor’s Assumptions or forward-looking statements.
No Reliance on Past PerformanceAny description of past performance is not a reliable indicator of future performance and should not be relied upon as the primary basis to invest.
Sponsor’s Use of DebtA substantial portion of the total cost of the real estate asset acquired by the Sponsor with investor funds (“Property”) will be paid with borrowed funds, i.e., debt. Sponsor’s estimated rates and terms of the debt financing are subject to lender approval, and there is no assurance that the Sponsor will secure debt at the rates and terms presented on this Page or in the Sponsor’s Investment Documents, or at all. The use of borrowed money to acquire real estate is referred to as leveraging, which can amplify losses and could result in lender foreclosure. In addition, if the debt includes a variable (or “floating”) interest rate, the total amount of interest paid over the term of the debt will fluctuate and can increase. As a result, Sponsor’s use of debt can result in a loss of some or all of your investment.
Sponsor’s Offering is Not RegisteredSponsor’s securities offering will not be registered under the Securities Act of 1933, as amended (the “Securities Act”), in reliance upon the exemptions from registration pursuant to Rule 506(c) of Regulation D as promulgated under the Securities Act (“Private Placement”). In addition, the offering will not be registered under any state securities laws in reliance on exemptions from state registration. Such securities (your ownership interests) are subject to restrictions on transferability and resale and may not be transferred or resold except as permitted under applicable state and federal securities laws pursuant to registration or an available exemption. All Private Placements on the Platform are intended solely for “Accredited Investors,” as that term is defined in Rule 501(a) under the Securities Act.
No Investment AdviceNothing on this Page should be regarded as investment advice (either with respect to a particular security or regarding an overall investment strategy), a recommendation, an offer to sell, or a solicitation of or an offer to buy any security. Advice from a securities professional is strongly advised to understand and assess the risks associated with real estate or private placement investments. For additional information on RM Securities’ involvement in this offering, please carefully review the Sponsor’s Investment Documents, and RM Securities’ Form CRS, Regulation Best Interest Disclosures, and Limited Brokerage Services Agreement.
1031 Exchange RiskInternal Revenue Code Section 1031 (“Section 1031”) contains complex tax concepts and certain tax consequences may vary depending on the individual circumstances of each investor. RM Securities and its affiliates make no representation or warranty of any kind with respect to the tax consequences of your investment or that the IRS will not challenge any such treatment. You should consult with and rely on your own tax advisor about the tax aspects with respect to your particular circumstances.