The team at our affiliated broker-dealer, RM Securities, conducts diligence on of the issuer, including detailed background checks, criminal checks, bad actor checks, and reference checks on sponsors. In addition to screening for any criminal background, we may also turn down sponsors due to poor reference checks, even if the background and criminal checks are satisfactory.
We require unaffiliated sponsors to use an unaffiliated third-party escrow agent.* When an investor makes an investment with such sponsors using the RealtyMogul platform, the investor’s money is transferred directly into a third-party escrow account. All closing conditions in connection with a sponsor’s contingency offering need to be met before the third-party escrow agent will approve releasing investor funds to the issuer or general partner. For example, if an issuer or general partner plans to use funds for a real estate acquisition that does not ultimately transact, the third-party escrow agent will not transfer investor funds to the issuer or general partner, and funds will be returned to investors.
Unless otherwise disclosed, escrow accounts are not required for some investments that accommodate 1031 investments where the property is already acquired.
Our processes typically includes visiting certain properties (or a subset of properties if it's a fund) to confirm the real estate is what and where the real estate is supposed to be. For certain properties that accommodate 1031 exchange investments, the team will review third-party prepared due diligence reports in lieu of a site visit.
We have formalized processes and checklists for every private placement deal listed on the platform.


Regard presents an attractive opportunity to obtain a well-maintained asset in a high-growth area at a basis well below replacement cost. Compared to similar new construction projects in the region, construction costs are nearing $300k+ a unit, representing a 40%+ premium over the Regard. Frankforter Group (“FG”) was able to get this deal off-market, giving us a tremendous discount from the competition.

Frankforter Group was able to get this deal off-market at a tremendous discount from the competition. This is especially true considering the property next door traded significantly higher than the Regard, while similar assets in the market are now trading at 22%+ premium
The business plan provides bringing in best-in-class management and policies, which will be instrumental in turning this Property around, as well as closing the loss-to-lease gap. Current market conditions are presently showing tremendous rental growth on this Property when compared to the surrounding comps. There is a $491 loss-to-lease that the Sponsor plans to burn off over the investment period.
Frankforter Group
Frankforter Group is a third-generation real estate investment and asset management firm, with a primary focus on acquiring institutional-grade multifamily and commercial real estate across the United States and Canada, with a proven track record of realized returns for their investors.
Frankforter Group was founded in 2012, and since then the company owned and managed over 16,000 units with $2.8B AUM. Dividends to investors averaged 10% Cash Yield and when disposed they realized 2.3x Equity Multiple and 23% gross IRR since inception.
The Sponsor currently invests across the US in 12 states, focusing on the Sun Belt.
https://frankfortergroup.com/-
 Yaakov FrankforterFounder & CEO
Yaakov is the Founder and Chief Executive Officer of Frankforter Group. Through years of mentorship by his late grandfather, Mr. David Rosenberg, Chairman of The Rosdev Group, Yaakov began to venture into partnerships by investing and developing real estate across North America. As an active real estate investor, owner, and operator since 2011, Yaakov has been directly involved in acquiring more than 12,000 multifamily units and has invested across the real estate spectrum including residential, office, hospitality, retail, and industrial properties. Yaakov specializes in multifamily investments, where property performance can be enhanced through multiple operational and strategic capital improvements. His investments have shown a strong history of success in improving both the quality of life for the tenants and returns to investors. Yaakov is responsible for the integration of the firm’s assets, regional management, executive team, and relations with institutional partners, lenders, and investors. Our constant growth has been fueled by his great ability to negotiate, structure, and close even the most complex transactions efficiently.
Frankforter Group Track Record
| Property Type | Location | Asset Type: | # of units: | Purchase price: | Purchase Date: | Current Market Value |
| Value Add | Atlanta, GA | Multi-family | 181 | $10,300,000 | Apr-18 | $23,625,000 |
| Value Add | Tampa, FL | Multi-family | 288 | $35,500,000 | Aug-18 | $72,500,000 |
| Value Add | Atlanta, GA | Multi-family | 204 | $12,500,000 | Apr. 2019 | $25,500,000 |
| Core | Tampa, FL | Multi-family | 448 | $58,500,000 | Jul-19 | $123,200,000 |
| Value Add | Atlanta, GA | Multi-family | 240 | $22,875,000 | Jan-21 | $38,200,000 |
| Value Add | Atlanta, GA | Multi-family | 130 | $6,695,000 | May-21 | $14,650,000 |
| Value Add | Atlanta, GA | Multi-family | 164 | $13,448,000 | Aug-21 | $21,500,000 |
| Core + | Pompano Beach, FL | Multi-family | 144 | $42,850,000 | Jun-21 | $62,760,000 |
| Core + | Orlando, FL | Multi-family | 248 | $62,000,000 | May-21 | $92,480,000 |
| Core + | Orlando, FL | Multi-family | 409 | $142,000,000 | Dec. 2021 | $182,000,000 |
| Core + | Atlanta, GA | Multi-family | 336 | $126,900,000 | Dec. 2021 | $149,800,000 |
| Core | Houston, TX | Multi-family | 319 | $63,000,000 | Jun-22 | $64,500,000 |
| Value Add | Atlanta, GA | Multi-family | 240 | $38,700,000 | Jul-22 | $38,700,000 |
| Total U.S Multifamily Portfolio: | Total Multifamily | 3,351 | $635,268,000 | $909,415,000 | ||
| Total Family Office Portfolio (Residential, Hospitality, Healthcare) | Total Family Office | 10,000 | $1,015,500,709 | $1,454,046,491 | ||
| TOTAL PORTFOLIO | 13,351 | $1,650,768,709 | $2,363,461,491 | |||
| Disposed Assets - Multifamily | ||||||
| Total # of units: | Total Purchase price: | Total Sale Price: | ||||
| 2,566 | $259,568,677 | $495,295,000 | ||||
(1) Track record includes Total Portfolio & Disposed multi-family assets to total $2.8B
The above biography and track record were provided by the Sponsor and have not been independently verified by RM Technologies, LLC or its affiliates. Past performance is not indicative of future results. Please carefully review the Disclaimers section below.
Frankforter Group purchased The Regard at a tremendous discount to market pricing due to their relationship with the seller and the off-market nature of the transaction. The neighboring property recently traded for close to 22% higher while others are now trading in the $260k/unit range, compared to the Regard at $197k/unit range. The Sponsor also foresees far more market rental growth currently in the market and is projecting tremendous upside and growth to the submarket with the $4.25B in development and STEM job creations.
There is also a shortage of supply in Houston by over 17k which will only foster further rental growth.
As part of the business plan for this asset, the Sponsor will be implementing light improvements to the Property in order to optimize resident satisfaction, reduce expenses and increase ancillary revenues. Moreover, the business plan provides bringing in best-in-class management and policies, which will be instrumental in turning the Property around, as well as closing the loss-to-lease gap. In particular, since 2016, about 4,000 residential units have been delivered to this market in anticipation of the PPP investment. However, over the last two years, a combination of temporary over-supply, together with the effects of the COVID-19 pandemic, have placed downward pressure on market rents. Nevertheless, current market conditions are presently showing tremendous rental growth on this property when compared to the surrounding comps, and the Sponsor is seeing a $491 loss-to-lease that they plan on burning off over the investment period.
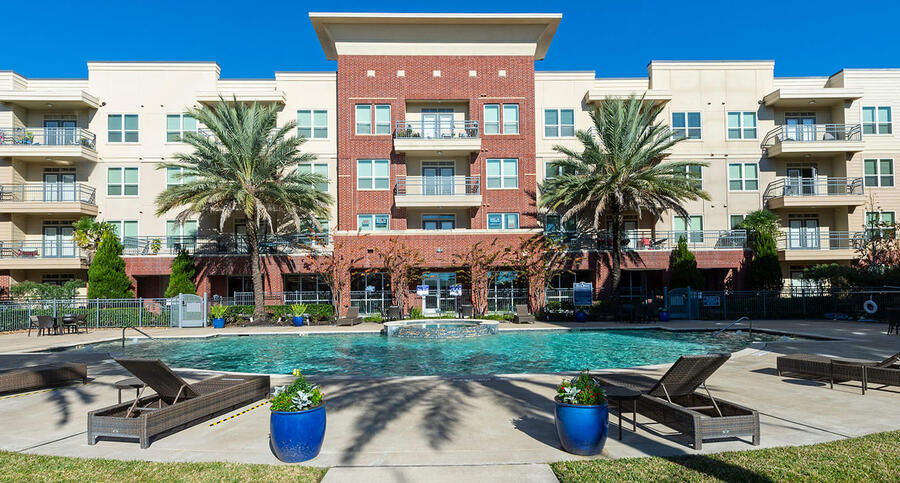
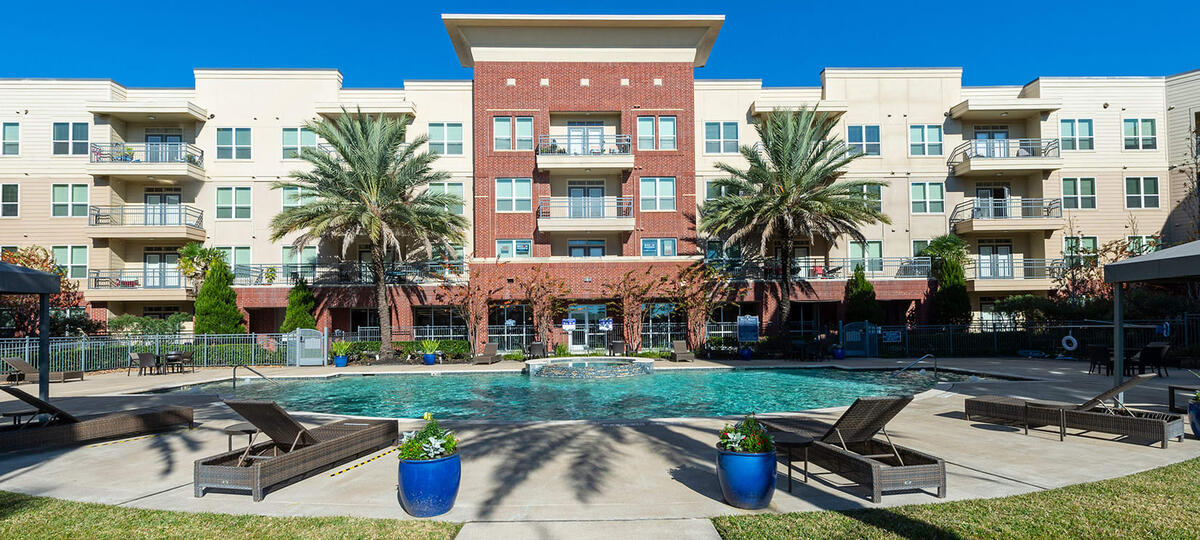
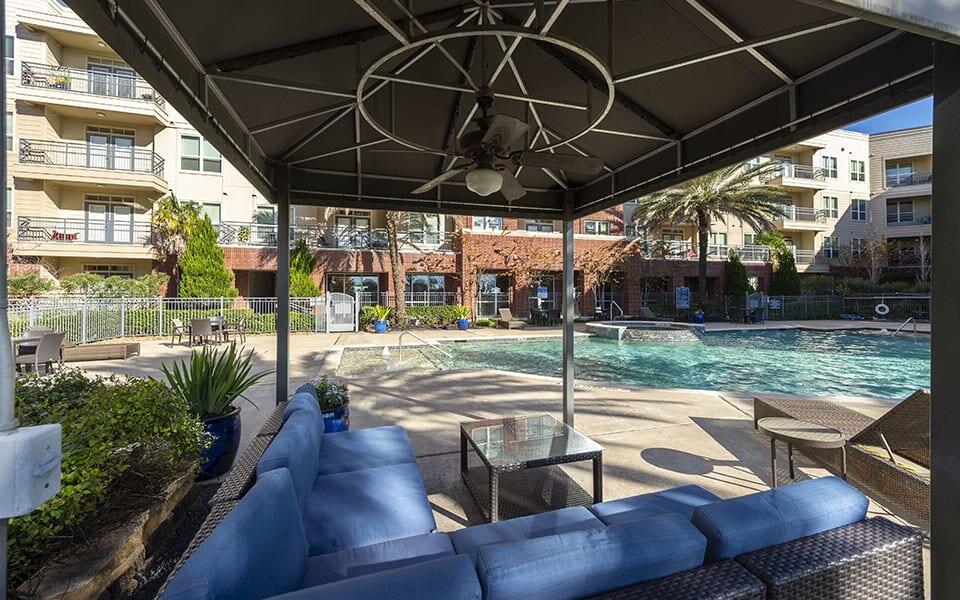
The CapEx budget is $1,943,321 which mainly consists of applying a new paint coating to the building exterior and corridors, common areas upgrading, including the gym, business center, leasing office, outdoor parks and the pool area, curb enhancement, and installing smart-home packages in each unit.
CURRENT OPERATIONS
Frankforter Group acquired the Property on June 30. Throughout the first quarter of ownership, they have achieved a significant rental increase, and it’s 93% leased for November 2022. The Property has started its light CapEx plan by making repairs and upgrading base building systems including maglocks on the doors (entry points to the property), removing dead trees and branches in the pool area, replacing the water pumps, replacing all exterior lights, and overall giving the Property a cleaner appeal. The Sponsor is also in the process of installing a new entry system for all entry points to the Property. The fire inspection was completed, and they are also in the process of repairing sprinklers, fire pumps, and fire alarms, and replacing all expired fire extinguishers for a total amount of $110,065.57 spent.
Since takeover, collections went up by removing the non-paying tenants. The average rent is currently $1,291 with the recent lease trade-outs showing an average of $1,385. This is just organic growth without factoring in the capital improvement projects. To date the Sponsor has already increased the average rents across the whole property above $50 since acquisition, with the majority of the lease expirations terminating in summer 2023, leaving tremendous upside to continue to burn off the loss-to-lease in line with the business plan.
The plan for Q4 2022 is to start upgrading the leasing office, resident lounge, business center, pool area, courtyards, fitness center, and model unit, which brings the total CapEx spent in the first 6-months ownership period to approximately $600,000. This number is based on doing 50% of the improvements over the next 3 months.
The Regard’s management company, Greystar, has been a valuable partner since Day 1. Changing the current staff and replacing them with 6 well-trained staff members brought a whole new culture that put the residents' experience at the core of this community.
| Acquisition Costs | $ Amount |
| Purchase Price | $63,000,000 |
| Cash Reserves | $3,944,475 |
| Closing Costs | $6,773,856 |
| Total Acquisition Costs | $73,718,331 |
| Capital Expenditures | $ Amount |
| Interior Unit Renovations | $154,715 |
| Electrical & HVAC | $34,550 |
| Fire Sprinkler/Fire Alarm | $76,100 |
| Exterior Misc. Repairs | $120,890 |
| Painting | $590,900 |
| Security Cameras | $85,000 |
| Fencing, Paving, and Sidewalks | $57,000 |
| Landscaping/Irrigation/Tree Trim - Removal | $147,500 |
| Amenities | $500,000 |
| Contingency | $88,333 |
| GC/Management Fee | $88,333 |
| Total Capital Expenditures | $1,943,321 |
| Grand Total | $75,661,652 |
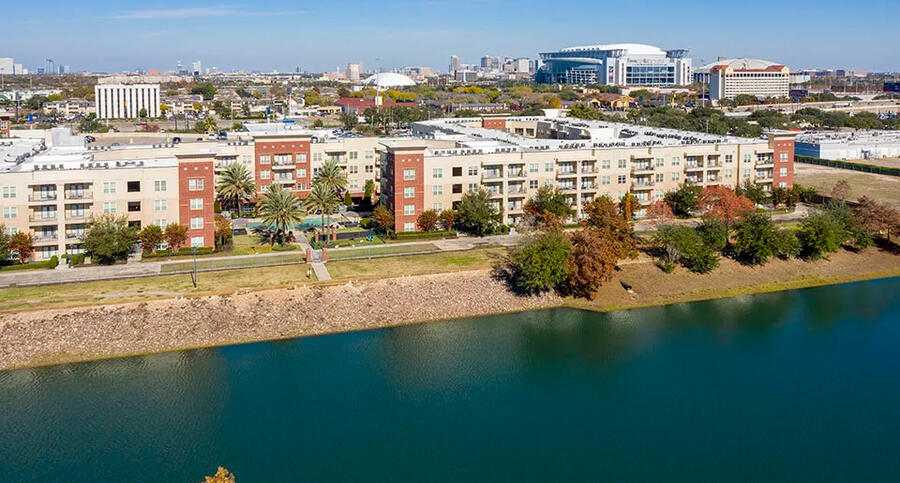
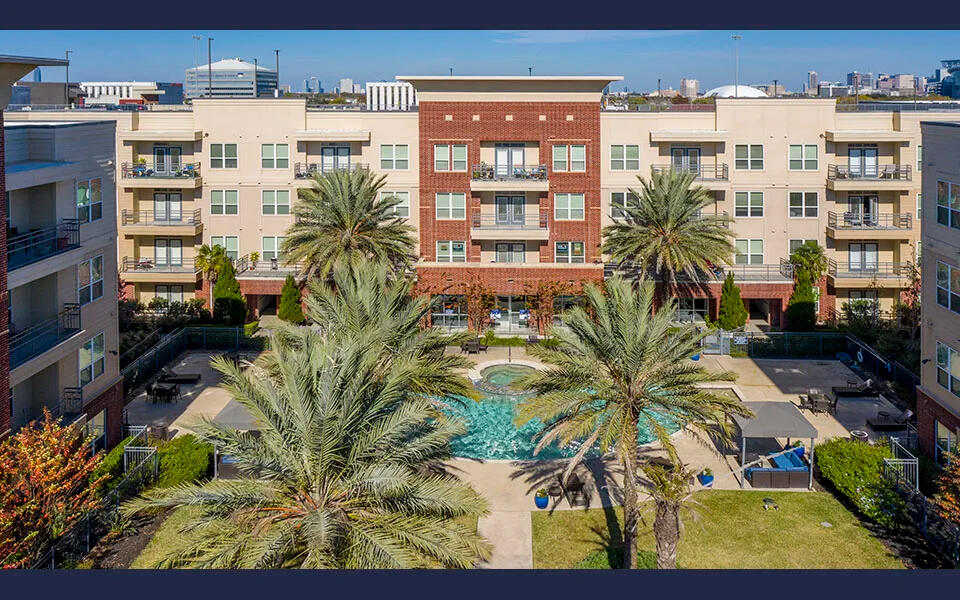
The Regard at Medical Center is a newer vintage, Class A apartment community that has been purchased below replacement cost in an off-market deal. The Property was underperforming due to mismanagement during the previous ownership. By implementing best-in-class strategies, the Frankforter Group plans to unlock its full potential and close the rent gap with neighboring communities. The Houston market and the Texas Medical Center pocket allow for tremendous rental growth and steady occupancy, attracting a high-skilled workforce with high-paying jobs.
| Unit Type | # of Units | Avg SF/Unit | Avg Rent (In-Place) | Avg Rent (Post-Reno) | Avg Rent Per SF (In-Place) | Avg Rent Per SF (Post-Reno) |
| 1BR-1BA | 5 | 638 | $1,158 | $1,425 | $1.81 | $2.23 |
| 1BR-1BA | 7 | 640 | $1,072 | $1,435 | $1.67 | $2.24 |
| 1BR-1BA | 32 | 722 | $1,134 | $1,500 | $1.57 | $2.08 |
| 1BR-1BA | 3 | 735 | $1,017 | $1,525 | $1.38 | $2.07 |
| 1BR-1BA | 3 | 757 | $972 | $1,600 | $1.28 | $2.11 |
| 1BR-1BA | 63 | 826 | $1,172 | $1,650 | $1.42 | $2.00 |
| 1BR-1BA | 26 | 835 | $1,188 | $1,660 | $1.42 | $1.99 |
| 1BR-1BA | 3 | 849 | $1,417 | $1,670 | $1.67 | $1.97 |
| 1BR-1BA | 62 | 854 | $1,192 | $1,680 | $1.40 | $1.97 |
| 1BR-1BA | 19 | 859 | $1,231 | $1,690 | $1.43 | $1.97 |
| 2BR-1BA | 16 | 1,035 | $1,388 | $1,950 | $1.34 | $1.88 |
| 2BR-2BA | 50 | 1,122 | $1,472 | $1,975 | $1.31 | $1.76 |
| 2BR-2BA | 7 | 1,145 | $1,478 | $2,000 | $1.29 | $1.75 |
| 2BR-2BA | 16 | 1,289 | $1,526 | $2,125 | $1.18 | $1.65 |
| 2BR-2BA | 4 | 1,418 | $1,549 | $2,200 | $1.09 | $1.55 |
| 2BR-2BA | 3 | 1,498 | $1,653 | $2,250 | $1.10 | $1.50 |
| Total/Averages | 319 | 916 SF | $1,265 | $1,744 | $1.38/SF | $1.90/SF |
Lease Comparables
| Property | Distance | Unit Type | Square Foot | Market Rent | Rent/Sf | Year Built | Stories | Units |
| Regard at Med Center | NA | 1BR-1BA | 722 | $1,500 | $2.08 | 2013 | 4 | 319 |
| Regard at Med Center | NA | 1BR-1BA | 826 | $1,650 | $2.00 | 2013 | 4 | 319 |
| Regard at Med Center | NA | 1BR-1BA | 854 | $1,680 | $1.97 | 2013 | 4 | 319 |
| Mezzo Kirby Med Center | 1.36 | 1BR-1BA | 615 | $1,688 | $2.74 | 2016 | 5 | 378 |
| Stadia Med Main | 1 | 1BR-1BA | 620 | $1,560 | $2.52 | 2020 | 4 | 338 |
| Beacon at Buffalo Pointe | 1 | 1BR-1BA | 634 | $1,315 | $2.07 | 2017 | 4 | 279 |
| Aspire at 610 | 0.1 | 1BR-1BA | 636 | $1,279 | $2.01 | 2017 | 4 | 282 |
| Orleans at Fannin Station | 1.21 | 1BR-1BA | 636 | $1,515 | $2.38 | 2019 | 4 | 338 |
| Mezzo Kirby Med Center | 1.36 | 1BR-1BA | 655 | $1,439 | $2.20 | 2016 | 5 | 378 |
| Mezzo Kirby Med Center | 1.36 | 1BR-1BA | 658 | $1,477 | $2.24 | 2016 | 5 | 378 |
| Aspire at 610 | 0.1 | 1BR-1BA | 677 | $1,354 | $2.00 | 2017 | 4 | 282 |
| Beacon at Buffalo Pointe | 1 | 1BR-1BA | 681 | $1,438 | $2.11 | 2017 | 4 | 279 |
| Orleans at Fannin Station | 1.21 | 1BR-1BA | 682 | $1,459 | $2.14 | 2019 | 4 | 338 |
| Stadia Med Main | 1 | 1BR-1BA | 709 | $1,582 | $2.23 | 2020 | 4 | 338 |
| Aspire at 610 | 0.1 | 1BR-1BA | 721 | $1,404 | $1.95 | 2017 | 4 | 282 |
| Mezzo Kirby Med Center | 1.36 | 1BR-1BA | 722 | $1,538 | $2.13 | 2016 | 5 | 378 |
| Stadia Med Main | 1 | 1BR-1BA | 789 | $1,793 | $2.27 | 2020 | 4 | 338 |
| Aspire at 610 | 0.1 | 1BR-1BA | 805 | $1,532 | $1.90 | 2017 | 4 | 282 |
| Mezzo Kirby Med Center | 1.36 | 1BR-1BA | 805 | $1,542 | $1.92 | 2016 | 5 | 378 |
| Stadia Med Main | 1 | 1BR-1BA | 845 | $1,827 | $2.16 | 2020 | 4 | 338 |
| Average | 0.92 | 1BR-1BA | 699 | $1,514 | $2.18 | 2018 | 4 | 330 |
| Property | Distance | Unit Type | Square Foot | Market Rent | Rent/Sf | Year Built | Stories | Units |
| Regard at Med Center | NA | 2BR-1BA | 1035 | $1,950 | $1.88 | 2013 | 4 | 319 |
| Regard at Med Center | NA | 2BR-2BA | 1122 | $1,975 | $1.76 | 2013 | 4 | 319 |
| Regard at Med Center | NA | 2BR-2BA | 1289 | $2,125 | $1.65 | 2013 | 4 | 319 |
| Beacon at Buffalo Pointe | 1 | 2BR-2BA | 972 | $1,978 | $2.03 | 2017 | 4 | 279 |
| Mezzo Kirby Med Center | 1.36 | 2BR-2BA | 1028 | $2,164 | $2.11 | 2016 | 5 | 378 |
| Mezzo Kirby Med Center | 1.36 | 2BR-2BA | 1094 | $2,229 | $2.04 | 2016 | 5 | 378 |
| Beacon at Buffalo Pointe | 1 | 2BR-2BA | 1105 | $1,750 | $1.58 | 2017 | 4 | 279 |
| Aspire at 610 | 0.1 | 2BR-2BA | 1108 | $1,982 | $1.79 | 2017 | 4 | 282 |
| Mezzo Kirby Med Center | 1.36 | 2BR-2BA | 1184 | $2,618 | $2.21 | 2016 | 5 | 378 |
| Orleans at Fannin Station | 1.21 | 2BR-2BA | 1190 | $1,969 | $1.65 | 2019 | 4 | 338 |
| Orleans at Fannin Station | 1.21 | 2BR-2BA | 1207 | $2,080 | $1.72 | 2019 | 4 | 338 |
| Stadia Med Main | 1 | 2BR-2BA | 1228 | $2,365 | $1.93 | 2020 | 4 | 338 |
| Orleans at Fannin Station | 1.21 | 2BR-2BA | 1253 | $2,160 | $1.72 | 2019 | 4 | 338 |
| Stadia Med Main | 1 | 2BR-2BA | 1264 | $2,395 | $1.89 | 2020 | 4 | 338 |
| Stadia Med Main | 1 | 2BR-2BA | 1270 | $2,465 | $1.94 | 2020 | 4 | 338 |
| Average | 1.07 | 2BR-2BA | 1159 | $2,180 | $1.89 | 2018 | 4 | 334 |
Sales Comparables
| Property | Units | Price | Price per unit | Year Built |
| Regard at Med Center | 319 | $63,000,000 | $197,492 | 2013 |
| Arrive Upper Kirby | 199 | $108,975,000 | $547,613 | 2018 |
| The Kirby | 305 | $94,500,000 | $309,836 | 2015 |
| The Millennium High Street | 340 | $101,000,000 | $297,059 | 2013 |
| Stadia Med Main | 338 | $79,800,000 | $236,095 | 2020 |
| Venue Museum District | 224 | $76,000,000 | $339,286 | 2009 |
| The Flats at West Alabama | 304 | $67,000,000 | $220,395 | 2021 |
| Bellrock Sawyer Yards | 327 | $86,200,000 | $263,609 | 2020 |
| Aspire at 610 | 282 | $66,000,000 | $234,043 | 2018 |
| Average | 290 | $84,934,375 | $305,992 | 2017 |
Market Information
Heading into the second half of 2022, investment activity in Houston’s multifamily market is poised for another record year. Multifamily investment volume during the first half of 2022 totaled nearly $9 billion, according to CoStar estimates. That marks the highest total ever for the first half of a year.
For reference, investment volume totaled $18 billion during 2021, according to CoStar estimates. That's more than three times the yearly volume of $5 billion recorded between 2010 and 2019. Between 2019 and 2021, portfolio sales captured 16% of the total sales on average during the first half of each year. By comparison, they have made up about 20%, or more than 12,000 units, during the first half of 2022.
Source: CoStar
Submarket Information
The Texas Medical Center (“TMC”) is continuing its expansion with the TMC3 Campus, a $3.25B development project which is expected to serve as TMC’s medical research and commercialization cornerstone. Spanning across 37-Acres, TMC3 will be a world-class, life science complex consisting of research centers, laboratories, healthcare institutions, a hotel, a conference center, retail shops, and a park. Moreover, adjacent to the TMC, will be the site of the Levit-Green Development; a $1B, 53-acre life science innovation district, which will further fuel the positive job migration in this market. Collectively, the foregoing represents an aggregate $4.25B investment, which is expected to generate a significant amount of high-paying jobs in STEM-related fields of employment.


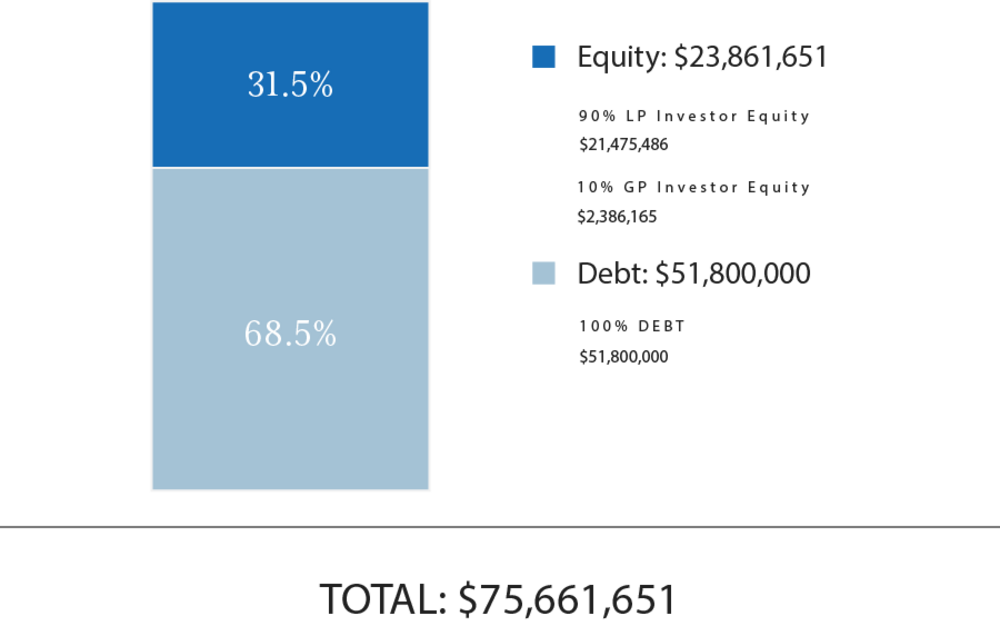
Total Capitalization
| Sources of Funds | $ Amount | $/Unit |
| Debt | $51,800,000 | $162,382 |
| GP Investor Equity(1) | $2,386,165 | $7,480 |
| LP Investor Equity | $21,475,486 | $67,321 |
| Total Sources of Funds | $75,661,651 | $237,184 |
| Uses of Funds | $ Amount | $/Unit |
| Purchase Price | $63,000,000 | $197,492 |
| Acquisition Fee | $787,500 | $2,469 |
| Loan Fees | $1,036,000 | $3,248 |
| Closing Costs | $4,457,689 | $13,974 |
| CapEx | $1,943,321 | $6,092 |
| Working Capital | $500,000 | $1,567 |
| Loan Reserve | $1,547,142 | $4,850 |
| Rate Cap | $2,390,000 | $7,492 |
| Total Uses of Funds | $75,661,651 | $237,184 |
(1) The Sponsor’s equity contribution may consist of friends and family equity and equity from funds controlled by the Sponsor.
The in-place debt terms are as follows:
- Lender: Arbor
- Recourse or Non-Recourse: Non-recourse
- Term: 3 Years + Two 1-Year Extensions
- Loan to Cost: 68.5%
- Estimated Proceeds: $51,800,000
- Interest Type: Floating
- Spread Above SOFR: 4.375%
- Interest-Only Period: 3 Years
- Amortization: 30 Years
- Prepayment Terms: 1% exit fee
- Extension Requirements: 0.25% fee
- Rate Cap & Terms: Strike Rate: Year 1 = 0.50%; Year 2 = 1.00% (Sponsor has budgeted a year 3 rate cap extension fee reserve of $950,000 in closing costs.)
(1) A substantial portion of the total acquisition for the Property will be paid with borrowed funds, i.e., debt. Please carefully review the Disclaimers section below for additional information concerning the Sponsors use of debt.
Frankforter Group intends to make distributions as follows:
- At least quarterly, distributions should be received by each Partner to a cumulative, preferred return of 8%.
- Second to all Partners pro-rata based on Partner's percentage interest until all capital is returned.
- Third, 70% of any remaining available will be distributed to the Partners, and the remaining 30% remaining available cash will be distributed to the General Partner.
Frankforter Group intends to make distributions to investors after the payment of the company's liabilities (loan payments, operating expenses, and other fees as more specifically set forth in the LLC agreements, in addition to any member loans or returns due on member loan).
Distributions are expected to start in May 2023 and are projected to continue on a quarterly basis thereafter. Distributions are at the discretion of Frankforter Group, who may decide to delay distributions for any reason, including maintenance or capital reserves.
Frankforter Group will receive a promoted/carried interest as indicated above.
| Cash Flow Summary | ||||||
| Year 1 | Year 2 | Year 3 | ||||
| Effective Gross Revenue | $5,561,806 | $6,525,961 | $7,059,970 | |||
| Total Operating Expenses | $2,972,934 | $3,259,039 | $3,362,634 | |||
| Net Operating Income | $2,588,872 | $3,266,922 | $3,697,336 | |||
| Project-Level Cash Flows | ||||||
| Year 0 | Year 1 | Year 2 | Year 3 | |||
| Net Cash Flow | ($23,861,651) | $1,135,432 | $923,501 | $38,080,409 | ||
| Investor-Level Cash Flows(1) | ||||||
| Year 0 | Year 1 | Year 2 | Year 3 | |||
| Net Cash Flow | ($7,170,000) | $341,177 | $277,495 | $10,491,376 | ||
| Investor-Level Cash Flows - Hypothetical $50,000 Investment(1) | ||||||
| Year 0 | Year 1 | Year 2 | Year 3 | |||
| Net Cash Flow | ($50,000) | $2,379 | $1,935 | $73,162 | ||
(1) RM Technologies, LLC and its affiliates do not provide any assurance of returns. Returns presented are net of all fees. Please carefully review the Fees and Disclaimers sections below for additional information concerning Sponsor’s use or projected returns and fees paid to Sponsor and RM Technologies, LLC.
Certain fees and compensation will be paid over the life of the transaction; please refer to Frankforter Group's materials for details. The following fees and compensation will be paid(1)(2):
| One-Time Fees: | |||
| Type of Fee | Amount of Fee | Received By | Paid From |
| Acquisition Fee | 1.25% of Purchase Price | Frankforter Group | Property |
| Construction Management Fee | 5.0% of Completed Capital Projects | Greystar | Cash Flow |
| Technology Solution Licensing Fee(2) | Flat one-time licensing fees of $15,000 plus $1,500 per each prospective investor onboarded by Sponsor through its license and use of RM Technologies’ Technology Solution | RM Technologies, LLC |
Capitalization (at Sponsor’s discretion) |
| Recurring Fees: | |||
| Type of Fee | Amount of Fee | Received By | Paid From |
| Asset Management Fee | 2.25% of Effective Gross Income | Frankforter Group | Cash Flow |
| Property Management Fee | 2.5% of Effective Gross Income | Greystar | Cash Flow |
| Administration Solution Licensing Fee(2) | Flat quarterly licensing fee of $125 per investor serviced by Sponsor through the license and use of RM Technologies’ Administration Solution | RM Technologies, LLC | Cash Flow |
(1) Fees may be deferred to reduce impact to investor distributions.
(2) Please see the Fees and Disclaimers sections below for additional information concerning fees paid to RM Technologies, LLC.
.
RM Securities, LLC, its registered representatives, affiliates, associated persons, and personnel of its affiliates who may also be associated with it, including our associated persons and personnel of our affiliates who are also be associated with RM Securities, LLC (it (“RM Securities,” “we,” “our,” or “us”) will receive fees, expense reimbursements, and other compensation (“Fees”) from the issuer of this investment offering, its sponsor, or an affiliate thereof (“Sponsor”), or otherwise in connection with Sponsor’s offering. The Fees paid to us are in addition to other fees you will pay to Sponsor or in connection with Sponsor’s investment offering. You will pay Fees to Sponsor, either directly or indirectly as an investor in the Sponsor’s offering. Sponsor will use the Fees you pay, as well as funds you invest in the relevant offering, to compensate us. The Fees paid to us will directly or indirectly be borne by you as the investor (typically, but not always, in the form of an expense of the Sponsor’s offering in which you invest) because such Fees will reduce the proceeds available for distribution to you and reduce the amount you earn over time.
For more information on the Fees paid to us, or any other Fees you will pay in connection with Sponsor’s offering, please carefully review the Sponsor’s Investment Documents. Please also carefully review RM Securities’ Form CRS, Regulation Best Interest Disclosures, and Limited Brokerage Services Agreement.
No Approval, Opinion or Representation, or Warranty by RM Securities, LLCSponsor has provided, approved, and is solely responsible in all aspects for the information on this webpage (“Page”), including Sponsor’s offering documentation, which may include without limitation the Private Placement Memorandum, Operating or Limited Partnership Agreement, Subscription Agreement, the Project Summary and all exhibits and other documents attached thereto or referenced therein (collectively, the “Investment Documents”). The Investment Documents linked on this page have been prepared and posted by Sponsor, and not by RM Securities. We did not assist in preparing, do not adopt or endorse, and we are not otherwise responsible for, the Sponsor’s Investment Documents. We make no representations or warranties as to the accuracy of information on this Page or in the Sponsor’s Investment Documents and we accept no liability therefor. No part of the information on this Page or in the Sponsor’s Investment Documents is intended to be binding on us.
Sponsor’s Information Qualified by Investment DocumentsThe information on this Page is qualified in its entirety by reference to the more complete information about the offering contained in the Sponsor’s Investment Documents. The information on this Page is not complete and subject to change at the Sponsor’s discretion at any time up to the closing date. The Sponsor’s Investment Documents and supplements thereto contain important information about the Sponsor’s offering including relevant investment objectives, the business plan, risks, charges, expenses, and other information, which you should consider carefully before investing. The information on this Page should not be used as a basis for an investor’s decision to invest.
Risk of InvestmentThis investment is speculative, highly illiquid, and involves substantial risk. There can be no assurances that all or any of Sponsor’s assumptions, expectations, estimates, goals, hypothetical illustrations, or other aspects of Sponsor’s business plans (“Assumptions”) will be true or that actual performance will bear any relation to Sponsor’s Assumptions, and no guarantee or representation is made that Sponsor’s Assumptions will be achieved. If Sponsor does not achieve its Assumptions, your investment could be materially and adversely affected. A loss of part or all of the principal value of your investment may occur. You should not invest unless you can readily bear the consequences of such loss. Sponsor’s Assumptions should not be relied upon as the primary basis for your decision to invest.
No Reliance on Forward-Looking Statements; Sponsor AssumptionsSponsor is solely responsible for statements made concerning forward-looking statements and Assumptions, which apply only as of the date made, are preliminary and subject to change, and are expressly qualified in their entirety by the disclosures and cautionary statements included in Sponsor’s Investment Documents, which you should carefully review. Neither RM Securities nor Sponsor are obligated to update or revise such forward-looking statements or Assumptions to reflect events or circumstances that arise after the date made or to reflect the occurrence of unanticipated events. Sponsor’s forward-looking statements and Assumptions are hypothetical, not based on actual investment achievements or events, and are presented solely for purposes of providing insight into the Sponsor’s investment objectives, detailing Sponsor’s anticipated risk and reward characteristics, and establishing a benchmark for future evaluation of actual results; therefore, they are not a predictor, projection, or guarantee of future results. You should not rely on Sponsor’s forward-looking statements as a basis to invest.
Importantly, we do not adopt, endorse, or provide any assurance of returns or as to the accuracy or reasonableness of Sponsor’s Assumptions or forward-looking statements.
No Reliance on Past PerformanceAny description of past performance is not a reliable indicator of future performance and should not be relied upon as the primary basis to invest.
Sponsor’s Use of DebtA substantial portion of the total cost of the real estate asset acquired by the Sponsor with investor funds (“Property”) will be paid with borrowed funds, i.e., debt. Sponsor’s estimated rates and terms of the debt financing are subject to lender approval, and there is no assurance that the Sponsor will secure debt at the rates and terms presented on this Page or in the Sponsor’s Investment Documents, or at all. The use of borrowed money to acquire real estate is referred to as leveraging, which can amplify losses and could result in lender foreclosure. In addition, if the debt includes a variable (or “floating”) interest rate, the total amount of interest paid over the term of the debt will fluctuate and can increase. As a result, Sponsor’s use of debt can result in a loss of some or all of your investment.
Sponsor’s Offering is Not RegisteredSponsor’s securities offering will not be registered under the Securities Act of 1933, as amended (the “Securities Act”), in reliance upon the exemptions from registration pursuant to Rule 506(c) of Regulation D as promulgated under the Securities Act (“Private Placement”). In addition, the offering will not be registered under any state securities laws in reliance on exemptions from state registration. Such securities (your ownership interests) are subject to restrictions on transferability and resale and may not be transferred or resold except as permitted under applicable state and federal securities laws pursuant to registration or an available exemption. All Private Placements on the Platform are intended solely for “Accredited Investors,” as that term is defined in Rule 501(a) under the Securities Act.
No Investment AdviceNothing on this Page should be regarded as investment advice (either with respect to a particular security or regarding an overall investment strategy), a recommendation, an offer to sell, or a solicitation of or an offer to buy any security. Advice from a securities professional is strongly advised to understand and assess the risks associated with real estate or private placement investments. For additional information on RM Securities’ involvement in this offering, please carefully review the Sponsor’s Investment Documents, and RM Securities’ Form CRS, Regulation Best Interest Disclosures, and Limited Brokerage Services Agreement.
1031 Exchange RiskInternal Revenue Code Section 1031 (“Section 1031”) contains complex tax concepts and certain tax consequences may vary depending on the individual circumstances of each investor. RM Securities and its affiliates make no representation or warranty of any kind with respect to the tax consequences of your investment or that the IRS will not challenge any such treatment. You should consult with and rely on your own tax advisor about the tax aspects with respect to your particular circumstances.