The team at our affiliated broker-dealer, RM Securities, conducts diligence on of the issuer, including detailed background checks, criminal checks, bad actor checks, and reference checks on sponsors. In addition to screening for any criminal background, we may also turn down sponsors due to poor reference checks, even if the background and criminal checks are satisfactory.
We require unaffiliated sponsors to use an unaffiliated third-party escrow agent.* When an investor makes an investment with such sponsors using the RealtyMogul platform, the investor’s money is transferred directly into a third-party escrow account. All closing conditions in connection with a sponsor’s contingency offering need to be met before the third-party escrow agent will approve releasing investor funds to the issuer or general partner. For example, if an issuer or general partner plans to use funds for a real estate acquisition that does not ultimately transact, the third-party escrow agent will not transfer investor funds to the issuer or general partner, and funds will be returned to investors.
Unless otherwise disclosed, escrow accounts are not required for some investments that accommodate 1031 investments where the property is already acquired.
Our processes typically includes visiting certain properties (or a subset of properties if it's a fund) to confirm the real estate is what and where the real estate is supposed to be. For certain properties that accommodate 1031 exchange investments, the team will review third-party prepared due diligence reports in lieu of a site visit.
We have formalized processes and checklists for every private placement deal listed on the platform.


There is an extreme shortage of new for-sale housing in Los Angeles. There are currently no actively selling new townhome competitors in the San Fernando Valley, and only one detached. A declining supply of land available for new home development, combined with rapid new home sales, and a lack of political will to approve new home communities, has resulted in the number of active new home communities in Los Angeles plunging to one of the lowest levels in the past 30 years There are now just 76 active projects in the county, down 56% from the average since 1994 (174).

There is a high demand for modern new construction housing in Los Angeles. The market is clearly under-supplied relative to historical levels and can support new projects such as the Valley Villas coming to market. Valley Villas will provide much needed affordably priced homes to a very supply-constrained market.

The project Sponsor has a very strong 26-year track record, building and selling over 2,500 homes with a total sales value of nearly $1.4 billion and returning an average 22% annualized return to its investors.
Williams Homes
Co-Founded in 1996 by Lance and Sadie Williams. Williams Communities and Williams Homes (collectively “Williams”) primary focus is the development and sale of single-family attached and detached homes in communities targeted to entry-level, move-up, and luxury homebuyers in California, Idaho, Texas, and Montana. Williams consistently lands in the top ten most active for-sale homebuilders in its established markets. Over the past quarter century, Lance Williams has come to be recognized as a leader in the housing industry in the West. Lance K. Williams is the Chief Executive Officer of Williams Communities, LLC. Mr. Williams, in addition to the individuals listed in the management profile herein, will be responsible for managing the day-to-day business of the Company. In 2021 Williams delivered 398 homes for nearly $300 million in revenue with an average sales price of $760,000. Over its twenty-five-year history, Williams has delivered over 2,500 homes in 60 communities worth in excess of $1.3 billion and currently has in process or under construction over 3,300 homes with a completed value of approximately $2.2 billion. Williams has a perfect record of project completion. Williams has historically capitalized its projects with traditional commercial bank financing, institutional equity, and high net worth individual equity.
To date, Williams’ equity partners have invested over $400 million in Williams projects with completed projects having averaged a 23% annualized internal rate of return and a 1.4 multiple.
https://www.williamshomes.com/-
 Lance K WilliamsCEO
 -
 Sadie WilliamsOwner, Product Development Director
 -
 Matt KleinChief Financial Officer
 -
 Dan FainaChief Marketing Officer
Lance Williams has been in the construction industry for more than 35 years. Founding the company that bears his name alongside housing legend Ray Watt in 1996, Mr. Williams' experience encompasses all disciplines of residential real estate. Mr. Williams is widely recognized as a housing industry leader in the West. As Chairman and CEO, Mr. Williams has directly overseen the acquisition, entitlement, financing, construction, sales, and delivery of over 2,500 homes in 55 communities, worth in excess of $1.3 billion, and currently has in development or under construction an additional 30 projects for 3,500 plus homes with a completed value of approximately $2.2 billion. Prior to founding Williams Homes, Inc., Mr.Williams was employed by Watt Housing Corporation and Beazer Homes, Inc. where he served in multiple management roles. Mr.Williams received his bachelor's degree in Finance, Real Estate, and Law from California Polytechnic University, Pomona in 1990. Mr. Williams is a licensed real estate broker, general contractor, and jet pilot. Mr. Williams is an active member of the California Building Industry Association, where he has acted in a variety of functions including serving as chair of the government affairs committee as well as on the board of directors of the Los Angeles/Ventura chapter of the BIA. Through the years, he has shared his expertise by serving on multiple industry boards, chairing committees, and guest speaking, in addition to lending his time and efforts to many worthy community endeavors. Mr. Williams has also been recognized by his alma mater as distinguished alumni for outstanding early career success and outstanding entrepreneurship.
Raised in a real estate development family, (Sadie’s grandfather was legendary real estate developer Ray Watt) Sadie went to work for Watt Companies where she developed robust marketing and public relations experience. Sadie left the corporate world to lovingly raise her children. It was Sadie’s passion for creativity that drove her back into homebuilding. Sadie created Williams Homes’ first in-house design team, which spearheads home design, product development, and model merchandising. Over the past ten years, Sadie has overseen 60+ sales office and model home installations. Furthermore, Sadie brings her decades of industry knowledge and insight to the Board of Directors for Watt Ventures and Williams Homes. Sadie Williams is the Product Development Director, but more than that she exudes grace, grit, and the heart of Williams Homes.
Mr. Klein originally joined Williams in 2004 as the SVP of Finance and Operations. In 2009, Mr. Klein relocated to the east coast where he spent over ten years in both consulting and private equity, including the completion of several real estate and real estate service company transactions. In 2019, Mr. Klein moved to Austin, Texas and began consulting for Williams on land acquisition efforts, and rejoined Williams in 2020 as the Texas Division President. During his original tenure with Williams, Mr. Klein oversaw acquisition, development, construction, and financing alongside Mr. Williams and he will perform the same functions for the Texas Division while building a physical base of operations for Williams in Texas. In 2021, Mr. Klein took on the role of Chief Financial Officer in addition to his Texas Division President position. Mr. Klein received his bachelor’s degree in Finance, Real Estate and Law from California State Polytechnic University, Pomona in 1993 and his master’s degree in Business Administration from the University of Texas at Austin in 1999.
As both the Chief Marketing Officer and Southern California Division President of Williams Homes, Daniel Faina provides strategic leadership and plays an integral role in all aspects of operations within Williams Homes' growing portfolio of communities including acquisitions, design, and development. During his tenure at Williams, Dan has played an active part in the development of numerous communities in Southern and Central Coast California, Idaho, Montana, and now in Northern California and Texas. Along with Williams Homes’ executive management team, Dan is continually expanding and redefining the company’s business plan to satisfy everchanging homebuyer demands and market opportunities. He bases the foundation of each new community on the company’s mission statement, which is a commitment to building communities and creating homes with a family approach. In his current role as well as throughout his history at the company, Dan has taken part in developing the right people, processes, and technology to deliver the highest level of quality, reliability, and attainability for Williams’ homeowners. Dan joined Williams Homes in 2007 and has served as Southern California Division President since 2019 after serving as Vice President of Sales and Marketing. He is passionate about sharing his industry insights and expertise through his involvement with the Building Industry Association of Southern California, the Greater Sales and Marketing Council, local chambers of commerce, advisory councils, and numerous other industry and community affiliations. Thanks to his strong leadership role at Williams Homes and the industry at large, Dan was recognized in 2018 by Professional Builder magazine in its annual list of 40 Under 40 Superstars in the homebuilding industry. Dan and his family reside in Santa Clarita, California.
Track Record - Completed Deals
| Property | City, State | Asset Type | Initial Funding Date | Final Distribution Date | Investor Equity | Investor Returns | Equity Multiple | IRR |
| Righetti Arroyos 53 | San Luis Obispo, CA | MU | 1/1/2020 | 6/1/2022 | $9,800,000 | $4,167,064 | 1.43 | 22% |
| Righetti SLO43 | San Luis Obispo, CA | MU | 12/1/2019 | 4/1/2022 | $6,000,000 | $2,264,890 | 1.38 | 13% |
| Willson 16 | Bozeman, MT | LUX | 6/1/2018 | 4/1/2022 | $2,700,000 | $421,875 | 1.16 | 4% |
| Righetti SLO86 | San Luis Obispo, CA | MU | 6/1/2018 | 9/1/2021 | $10,084,000 | $6,836,925 | 1.68 | 26% |
| Hermitage | Los Angeles, CA | MU | 8/1/2019 | 12/1/2021 | $5,000,000 | $2,673,000 | 1.53 | 28% |
| Arroyos @ Righetti | San Luis Obispo, CA | MU | 8/1/2018 | 12/1/2021 | $12,200,000 | $4,109,000 | 1.34 | 38% |
| Paseos @ Righetti | San Luis Obispo, CA | MU | 3/1/2018 | 9/1/2021 | $13,000,000 | $5,191,000 | 1.40 | 24% |
| 24 on Centre | Los Angeles, CA | MU | 1/1/2017 | 1/1/2021 | $3,600,000 | - | 1.00 | 0% |
| Cobalt 12 | Los Angeles, CA | EL | 8/1/2019 | 11/1/2021 | $1,800,000 | $835,678 | 1.46 | 28% |
| Tovara West | Los Angeles, CA | EL | 12/1/2016 | 10/1/2020 | $10,250,000 | $4,923,624 | 1.48 | 12% |
| Rosewood | Santa Paula, CA | EL | 9/1/2018 | 9/1/2020 | $5,000,000 | $1,990,000 | 1.40 | 28% |
| Forsythia | Boise, ID | MU | 2/1/2019 | 5/1/2020 | $3,100,000 | $712,741 | 1.23 | 18% |
| Falcon Heights Encore | Lompoc, CA | MU | 8/1/2018 | 3/1/2020 | $3,500,000 | $985,814 | 1.28 | 15% |
| The Farm | Ventura, CA | EL & MU | 1/1/2014 | 10/1/2019 | $20,500,000 | $8,226,000 | 1.40 | 16% |
| Palmilla | Los Angeles, CA | MU | 5/1/2017 | 9/1/2019 | $2,000,000 | $423,000 | 1.14 | 6% |
| Pacific Villas | Baldwin Park, CA | MU | 1/1/2017 | 9/1/2019 | $7,730,000 | $3,112,000 | 1.40 | 19% |
| Echo 24 | Los Angeles, CA | MU | 11/1/2014 | 9/1/2019 | $2,950,000 | $966,200 | 1.33 | 19% |
| Bridewell | Los Angeles, CA | MU | 4/1/2016 | 7/1/2019 | $1,850,000 | - | 1.00 | 0% |
| Senna | Azusa, CA | EL | 4/1/2016 | 5/1/2019 | $9,250,000 | $4,052,020 | 1.44 | 18% |
| Cielo | Los Angeles, CA | EL | 10/1/2016 | 3/1/2019 | $2,660,000 | $1,236,000 | 1.46 | 19% |
| Indigo | Baldwin Park, CA | MU | 6/1/2015 | 3/1/2019 | $7,290,000 | $3,520,000 | 1.48 | 16% |
| Tovara East | Los Angeles, CA | EL | 8/1/2014 | 9/1/2018 | $6,525,000 | $2,898,000 | 1.44 | 15% |
| Reseda Ranch | Los Angeles, CA | MU | 12/1/2014 | 3/1/2019 | $1,200,000 | $532,000 | 1.44 | 9% |
| Woodridge | Atascadero, CA | EL | 10/1/2014 | 5/1/2018 | $3,000,000 | $1,210,000 | 1.40 | 10% |
| Phantom Trail | Santa Clarita, CA | MU | 4/1/2014 | 9/1/2017 | $3,359,000 | $2,755,000 | 1.82 | 29% |
| Arbor Ridge | Paso Robles | EL | 12/1/2014 | 10/1/2017 | $1,800,000 | $322,000 | 1.18 | 7% |
| La Barranca | Ventura, CA | LUX | 1/1/2013 | 9/1/2017 | $3,600,000 | ($453,000) | 0.87 | -12% |
| Country Ridge | Calabasas, CA | LUX | 6/1/2013 | 9/1/2017 | $11,259,000 | ($220,000) | 0.98 | -2% |
| Trestles | Santa Clarita, CA | EL | 5/1/2013 | 10/1/2017 | $9,770,000 | $8,474,000 | 1.87 | 21% |
| Agave | Los Angeles, CA | MU | 3/1/2013 | 7/1/2017 | $10,000,000 | $6,031,000 | 1.60 | 28% |
| Savannah | Simi Valley, CA | EL | 4/1/2013 | 12/1/2016 | $4,100,000 | $3,750,000 | 1.91 | 23% |
| Falcon Heights | Lompoc, CA | MU | 12/1/2013 | 6/1/2016 | $4,000,000 | $813,000 | 1.20 | 11% |
| Oakridge | Santa Clarita, CA | LUX | 12/1/2013 | 3/1/2016 | $5,820,000 | $3,013,000 | 1.52 | 26% |
| Parkland Cottages | Santa Maria, CA | EL | 11/1/2013 | 3/1/2016 | $1,500,000 | $586,000 | 1.39 | 18% |
| Edgewood | Fillmore, CA | MU | 8/1/2013 | 12/1/2015 | $4,000,000 | $2,255,000 | 1.56 | 23% |
| Terraces | Agoura Hills, CA | MU | 3/1/2013 | 11/1/2015 | $8,393,000 | $1,816,000 | 1.22 | 13% |
| Valle Di Oro | Santa Clarita, CA | EL | 7/1/2012 | 2/1/2015 | $5,000,000 | $4,707,738 | 1.94 | 41% |
| Park 9 | Los Angeles, CA | MU | 6/1/2012 | 7/1/2014 | $1,700,000 | $826,792 | 1.49 | 21% |
| Ridgeview | Santa Paula, CA | MU | 9/1/2011 | 7/1/2014 | $3,650,000 | $3,049,562 | 1.84 | 29% |
| Oak Haven | Fillmore, CA | EL | 7/1/2011 | 5/1/2014 | $1,550,000 | $849,397 | 1.55 | 18% |
| Ivy | Monrovia, CA | MU | 12/1/2012 | 5/1/2014 | $3,240,000 | $2,625,000 | 1.81 | 81% |
| Lone Hill | San Dimas, CA | MU | 7/1/2011 | 4/1/2014 | $7,160,000 | $1,619,000 | 1.23 | 14% |
| Olive Glen | Los Angeles, CA | EL | 5/1/2011 | 10/1/2013 | $8,631,000 | $3,725,000 | 1.43 | 36% |
| Fairways | Glendora, CA | EL | 1/1/2011 | 1/1/2014 | $1,600,000 | $666,955 | 1.42 | 13% |
| Falcon Ridge | Barstow, CA | EL | 5/1/2010 | 9/1/2014 | $800,000 | $832,511 | 2.04 | 21% |
| Chapel Lane | Ventura, CA | EL | 1/1/2010 | 5/1/2012 | $1,500,000 | $395,880 | 1.26 | 11% |
| Rosa De Castilla & Hidden Creek | MU | 7/1/2009 | 10/1/2011 | $1,800,000 | $1,545,000 | 1.86 | 37% | |
| Solstice | Santa Clarita, CA | EL | 11/1/2006 | 6/1/2011 | $1,100,000 | ($912,500) | 0.17 | -83% |
| Stratara | Santa Clarita, CA | EL | 8/1/2005 | 10/1/2008 | $2,250,000 | $100,000 | 1.04 | 2% |
| Bella Vida | Santa Clarita, CA | MU | 5/1/2005 | 6/1/2007 | $1,900,000 | $723,629 | 1.38 | 22% |
| Sonrisa | Santa Clarita, CA | EL | 5/1/2004 | 7/1/2006 | $1,650,000 | $1,126,804 | 1.68 | 47% |
| Big Sky Ranch | Santa Clarita, CA | MU | 8/1/2002 | 8/1/2003 | $800,000 | $435,491 | 1.54 | 69% |
| Apple Street | Santa Clarita, CA | EL | 8/1/2002 | 12/1/2003 | $500,000 | $755,324 | 2.51 | 123% |
| Walnut Street | Santa Clarita, CA | EL | 9/1/2001 | 12/1/2002 | $200,000 | $215,264 | 2.08 | 80% |
| Elliott Lane | Santa Clarita, CA | MU | 6/1/1999 | 2/1/2001 | $400,000 | $68,099 | 1.17 | 10% |
| Town & Country | Santa Clarita, CA | MU | 2/1/1997 | 12/1/1998 | $850,000 | $323,302 | 1.38 | 19% |
| Lola Lane | Santa Clarita, CA | MU | 3/1/1996 | 7/1/1997 | $460,000 | $451,269 | 1.98 | 63% |
| Total | $265,331,000 | $114,558,348 | 1.45 | 22% | ||||
Track Record - Ongoing Deals
| Active Project | Location | Project Completion | Homes | Revenue |
| Northwest Crossing | Bozeman, MT | 2026 | 155 | $112,400,000 |
| Valley Villas | Los Angeles, CA | 2025 | 58 | $37,100,000 |
| Floating Feather | Eagle, ID | 2025 | 139 | $129,000,000 |
| Sandpoint | Sandpoint, ID | 2024 | 49 | $40,600,000 |
| Highland Meadows II | East Helena, MT | 2024 | 59 | $28,400,000 |
| Southpark | Boise, ID | 2024 | 26 | $20,100,000 |
| Copper Ridge 54 | Billings, MT | 2023 | 54 | $27,200,000 |
| Plaza Del Amo | Torrance, CA | 2023 | 39 | $31,500,000 |
| Lancaster Towns | Lancaster | 2025 | 162 | $79,500,000 |
| Camarillo Village | Camarillo | 2026 | 285 | $178,000,000 |
| Park Place | Santa Clarita, CA | 2026 | 492 | $338,000,000 |
| Copper Ridge | Billings, MT | 2025 | 217 | $86,300,000 |
| Star 203 | Star, ID | 2025 | 203 | $101,800,000 |
| San Luis Ranch Lofts | San Luis Obispo, CA | 2024 | 120 | $49,600,000 |
| Piru | Piru, Ca | 2024 | 169 | $93,850,000 |
| Palo Verde | La Quinta, CA | 2024 | 37 | $35,600,000 |
| Campanile | Cathedral City, CA | 2024 | 141 | $84,600,000 |
| Williams Ranch | Santa Clarita, CA | 2024 | 497 | $440,400,000 |
| Portisol | Natomas, CA | 2023 | 95 | $41,000,000 |
| Point Happy | La Quinta, CA | 2023 | 29 | $25,500,000 |
| San Luis Ranch Heirloom | San Luis Obispo, CA | 2023 | 83 | $56,200,000 |
| San Luis Ranch Fig | San Luis Obispo, CA | 2023 | 80 | $50,300,000 |
| Bridger Heights | Belgrade, MT | 2023 | 72 | $26,300,000 |
| Bridger Vale | Bozeman, MT | 2023 | 20 | $27,600,000 |
| Enclave | Georgetown, TX | 2023 | 64 | $20,100,000 |
| Magnolia Village | Lincoln, CA | 2023 | 32 | $15,000,000 |
| Creekside | Filmore | 2023 | 131 | $52,200,000 |
| High Sierra | Billings, MT | 2022 | 60 | $16,000,000 |
| Highland Meadows | East Helena, MT | 2022 | 34 | $12,600,000 |
| West Winds | Bozeman, MT | 2022 | 42 | $21,400,000 |
| Oxnard Shores | Oxnard,CA | 2021 | 50 | $42,670,000 |
| Total | 3,694 | $2,320,820,000 |
The above biography and track record were provided by the Sponsor and have not been independently verified by RM Technologies, LLC or its affiliates. Past performance is not indicative of future results. Please carefully review the Disclaimers section below.
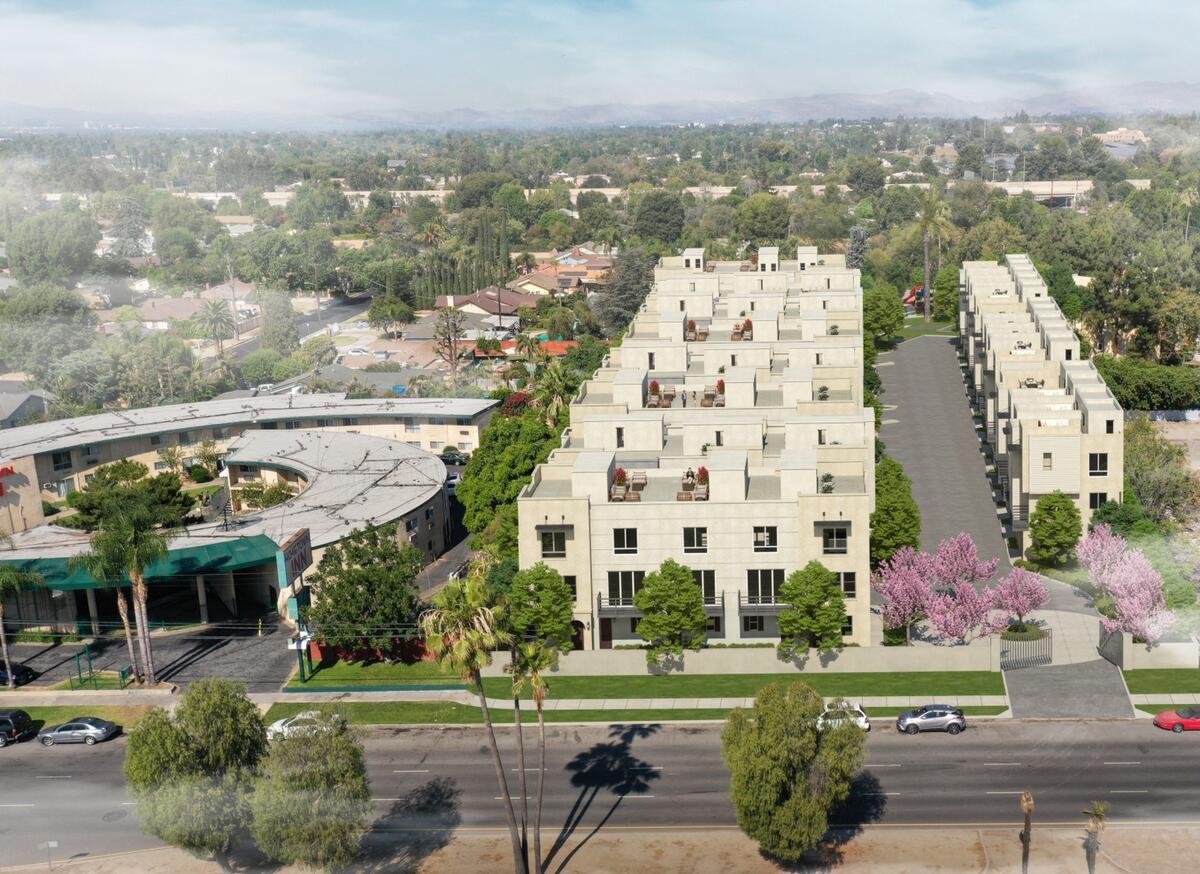
This is a rare opportunity to build and sell 58 market-rate, single-family attached homes with no entitlement risk in the City of Los Angeles, California. The Project has all required entitlements. The plan approvals are in-process, and development is expected to begin in the third quarter of 2022. The Property is owned by the Company, and financing has been arranged and recorded with Farmers and Merchants bank to fund the remaining development and construction costs.
The land plan includes fifty-eight two and three-story attached condominium homes. The final subdivision map is being processed with the City, and the final improvement plans are in plan check. The architectural plans have begun, and the homes will be permit-ready in approximately six months when the site improvements are nearing completion.
| Total | Per Unit | Percent | Per Sq. Ft. | |
| Lots | 58 | |||
| House Square Footage | 81,101 | 1,398 | ||
| Base Revenue | $36,941,000 | $636,914 | 100.4% | $455.49 |
| Model Recovery | $157,500 | $2,716 | 0.4% | $1.94 |
| Concessions | ($290,000) | ($5,000) | -0.8% | ($3.58) |
| Net Sales Revenues | $36,808,500 | $634,629 | 100.0% | $453.86 |
| Land Acquisition | $7,250,000 | $125,000 | 19.7% | $89.39 |
| Engineering, Consultants & Permits | $839,247 | $14,470 | 2.3% | $10.35 |
| Impact Fees | $997,900 | $17,205 | 2.7% | $12.30 |
| Offsite Improvements | $3,483,508 | $60,060 | 9.5% | $42.95 |
| Direct Construction Costs | $11,167,401 | $192,541 | 30.3% | $137.70 |
| Building Permits | $332,514 | $5,733 | 0.9% | $4.10 |
| Due Diligence | $15,000 | $259 | 0.0% | $0.18 |
| Architecture and Engineering | $454,400 | $7,834 | 1.2% | $5.60 |
| Indirects and Onsite Supervision | $1,148,531 | $19,802 | 3.1% | $14.16 |
| Legal, DRE, HOA | $154,407 | $2,662 | 0.4% | $1.90 |
| Insurance | $579,288 | $9,988 | 1.6% | $7.14 |
| Property Tax | $172,434 | $2,973 | 0.5% | $2.13 |
| General and Administrative | $1,472,340 | $25,385 | 4.0% | $18.15 |
| General Contingency | $368,085 | $6,346 | 1.0% | $4.54 |
| Model Park | $315,000 | $5,431 | 0.9% | $3.88 |
| Sales Office Maintenance/Salary | $166,081 | $2,863 | 0.5% | $2.05 |
| Advertising | $180,000 | $3,103 | 0.5% | $2.22 |
| Commissions | $927,463 | $15,991 | 2.5% | $11.44 |
| Closing Costs | $18,549 | $320 | 0.1% | $0.23 |
| Warranty | $368,085 | $6,346 | 1.0% | $4.54 |
| Finance Costs | $210,000 | $3,621 | 0.6% | $2.59 |
| Third-Party Interest | $676,478 | $11,663 | 1.8% | $8.34 |
| Total Project Costs | $31,296,711 | $539,598 | 85.0% | $385.90 |
| Profit Before Preferred Return | $5,511,789 | $95,031 | 15.0% | $67.96 |
| Preferred Return | $1,192,598 | $20,562 | 3.2% | $14.71 |
| Net Profit after Preferred Return | $4,319,191 | $74,469 | 11.7% | $53.26 |
| Total Project Costs | $31,296,711 | $539,598 | 85.0% | $385.90 |
| Less Comm., Closing Costs, Wty., Commit. | ($1,314,097) | ($22,657) | -3.6% | ($16.20) |
| Less Costs Funded From Proceeds/Loan | ($4,829,119) | ($83,261) | -13.1% | ($59.54) |
| Less Member Equity | ($8,500,000) | ($146,552) | -23.1% | ($104.81) |
| Total Loan Request | $16,653,495 | $287,129 | 45.2% | $205.34 |
This is a rare opportunity to build and sell 58 market-rate, single-family attached homes with no entitlement risk in the City of Los Angeles, California. The Project has all required entitlements. The plan approvals are in-process, and development is expected to begin in the third quarter of 2022. The Property is owned by Williams Homes, and financing has been arranged and recorded with Farmers and Merchants bank to fund the remaining development and construction costs.
| Unit Type | # of Units | Avg SF/Unit | $ / Unit | $ / SF | $ / Unit | $ / SF | % of Total | ||
| Plan 1 | Townhome | 18 | 1350 | $520,979 | $385.91 | $619,778 | $459.09 | 84% | |
| Plan 1A | Townhome | 3 | 1056 | $407,521 | $385.91 | $557,000 | $527.46 | 73% | |
| Plan 1B | Townhome | 3 | 1329 | $512,874 | $385.91 | $620,000 | $466.52 | 83% | |
| Plan 2 | Townhome | 12 | 1425 | $549,922 | $385.91 | $638,000 | $447.72 | 86% | |
| Plan 3 | Townhome | 14 | 1465 | $565,358 | $385.91 | $657,286 | $448.66 | 86% | |
| Plan 4 | Townhome | 6 | 1675 | $646,399 | $385.91 | $712,000 | $425.07 | 91% | |
| Plan 4A | Townhome | 2 | 993 | $383,209 | $385.91 | $562,000 | $565.96 | 68% | |
| Total/Averages | 58 | 1398 | $539,615 | 385.91 | $636,914 | $455.49 | 85% | ||
Sales Comparables
| Address | 9516 Corterra Ln, Panorama City, CA 91402 | 9037 Noble Ave North Hills, CA 91343 |
19535 Cardin Pl, Northridge, CA 91324 | 9850 N Lassen Ct, North Hills, CA 91343 | 19509 Astor Pl, Northridge, CA 91324 | Average | 9433 Sepulveda Blvd, North Hills, CA 91343 (Subject) |
| Date Sold | 5/27/2022 | 8/8/2022 | 7/8/2022 | 4/26/2022 | 7/8/2022 | New | |
| Year Built | 2022 | 2022 | 2018 | 2018 | 2018 | 2020 | 2023 |
| # of Units | 1 | 1 | 1 | 1 | 1 | 1 | 58 |
| Average Unit Size | 1805 SF | 1750 SF | 1188 SF | 1811 SF | 1645 SF | 1,640 SF | 1398 SF |
| Sale Price | $850,000 | $820,000 | $715,000 | $715,000 | $850,000 | $790,000 | $636,914 |
| $/Unit | $850,000 | $820,000 | $715,000 | $715,000 | $850,000 | $790,000 | $636,914 |
| $/SF | $470.91 | $468.57 | $601.85 | $394.81 | $516.72 | $490.57 | $458.31 |
| Building Size | 1,805 SF | 1,750 SF | 1,188 SF | 1,811 SF | 1,645 SF | 1,640 SF | 1,398 SF |
| Distance from subject | 0.9 mi | 1 mile | 6.1 mi | 0.7 mi | 6.1 mi | 3.5 mi |
Positive Location / Site & Market Attributes:
- Great regional location. Valley Villas is located just east of the I-405 fwy and minutes from the I-5 and 118 fwys, providing access to the major employment centers throughout the region. Major film studios such as Warner Bros. Studio and Walt Disney Studios are within a 15-minute drive and Downtown Los Angeles is about ±25 – 30 minutes away.
- Proximate to numerous services and amenities. Valley Villas is within a short drive to several big box retailers and two large chain grocery stores. A new shopping center, Olivo at Mission Hills (Target, 24 Hour Fitness, etc.), is located just one mile north of the site. Cal State Northridge is just 3 miles west of the site. The attended elementary and middle schools are within walking distance.
- Affordable price points. Recommended total prices range from $552K to $707K, averaging $632K. The median home price in Los Angeles County is $865K; so the Valley Villas average price is 27% below the County. In addition, recommended prices are well below the FHA loan limit ($970,800). Valley Villas will likely offer the most affordable new homes in the San Fernando Valley.
- COVID-19 has increased the demand for new housing. More people are working from home, home-schooling, or housing extended family. Many households living in apartments are reassessing their current living situation. Households who otherwise were not in the market for a new home are now deciding to move, increasing the demand for new construction homes.
- New home sales are strong in the region. After a COVID-related sharp drop in sales in March and April 2020, sales in Los Angeles have been consistently above the long-term average for the market. The average new home sales rate during the first three months of 2022 is 3.5/mo, which is slightly below 2021 and similar to 2017 – 2018. The only new home competitor, Corterra, is averaging 4.8 sales/mo at a much higher average price point than Valley Villas ($865K vs. $632K).
San Fernando Valley New Townhomes
Limited new home competition. There are currently no actively selling new townhome competitors in the San Fernando Valley, and only one detached. A declining supply of land available for new home development, combined with rapid new home sales, and a lack of political will to approve new home communities, has resulted in the number of active new home communities in Los Angeles plunging to one of the lowest levels in the past 30+ years. There are now just 76 active projects in the county, down 56% from the average since 1994 (174). The market is clearly under-supplied relative to historical levels and can support new projects such as the Valley Villas coming to market. Valley Villas will provide much needed affordably priced homes to a very supply constrained market.


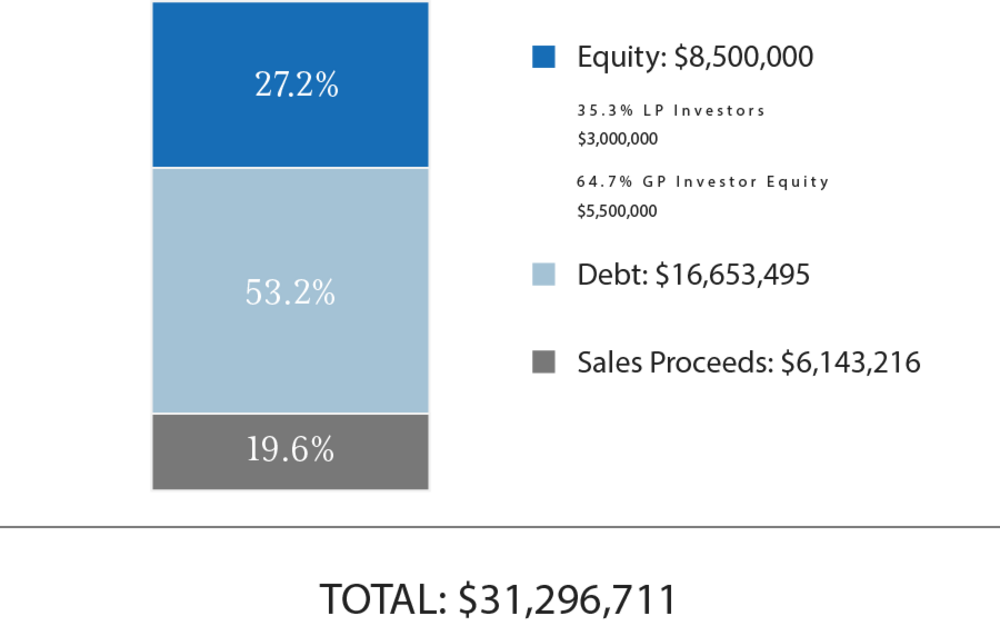
Total Capitalization
| Sources of Funds | $ Amount | $/Unit |
| Debt | $16,653,495 | $287,129 |
| GP Investor Equity(1) | $5,500,000 | $94,828 |
| LP Investor Equity | $3,000,000 | $51,724 |
| Sales Proceeds | $6,143,216 | $105,918 |
| Total Sources of Funds | $31,296,711 | $539,598 |
| Uses of Funds | $ Amount | $/Unit |
| Land Acquisition Price | $7,250,000 | $125,000 |
| Development Fee | $1,239,696 | $21,374 |
| Loan Fee | $210,000 | $3,621 |
| Closing Costs | $15,000 | $259 |
| Hard Costs | $14,175,991 | $244,414 |
| Hard Cost Contingency | $474,918 | $8,188 |
| Soft Costs | $3,272,012 | $56,414 |
| Soft Cost Contingency | $535,098 | $9,226 |
| G & A Costs | $1,472,340 | $25,385 |
| Financing Costs Interest | $676,478 | $11,663 |
| Warranty | $368,085 | $6,346 |
| Other Costs - Marketing & Sales | $1,607,093 | $27,709 |
| Total Uses of Funds | $31,296,711 | $539,598 |
(1) The Sponsor’s equity contribution may consist of friends and family equity and equity from funds controlled by the Sponsor.
The expected terms of the debt financing are as follows:
- Lender: Farmers & Merchants Bank
- Term: 3 Years
- Loan-to-Cost(2): 55.0%
- Estimated Proceeds: $16,653,495
- Interest Type: Fixed
- Annual Interest Rate: 4.50%
- Interest-Only Period: 3 Years
- Amortization: None
- Prepayment Terms: Repaid at par from each home closing.
- Extension Requirements: One-year extension available. Must have no defaults and pay fee.
(1) A substantial portion of the total acquisition for the Property will be paid with borrowed funds, i.e., debt. Please carefully review the Disclaimers section below for additional information concerning the Sponsors use of debt.
(2) The loan-to-cost ratio in debt assumptions reflects a requirement of the lender. It is pertaining to funding the construction costs, which is different from the debt percentage in the capital stack on both the online Offering Page and the Project Summary.
Williams Homes intends to make distributions as follows:
- First, to the Members, pro rata, based on their respective unreturned Capital Contributions until fully paid and returned;
- Second, to the Members, pro rata, based on their respective Capital Contributions, the Preferred Return thereon until said Preferred Return is fully paid;
- Third, the remaining Distributable Cash shall be distributed as follows:
- Fifty percent (50%) to the Members, pro rata, based on their respective Percentage Interests; and
- Fifty percent (50%) to the Manager.
"Preferred Return" shall mean and refer to a return of ten percent (10%) per annum, cumulative but not compounded, on unreturned Capital Contributions from the date on which the Capital Contributions are funded.
Williams Homes intends to make distributions to investors after the payment of the company's liabilities (loan payments, operating expenses, and other fees as more specifically set forth in the LLC agreements, in addition to any member loans or returns due on member loan).
Distributions are expected to start in August 2023 and are projected to continue on a monthly basis thereafter. Distributions are at the discretion of Williams Homes, who may decide to delay distributions for any reason, including maintenance or capital reserves.
Williams Homes will receive a promoted/carried interest as indicated above.
| Project-Level Cash Flows | |||||
| Year 0 | Year 1 | Year 2 | |||
| Net Cash Flow | ($8,500,000) | $2,337,976 | $11,673,814 | ||
| RM Platform Investor-Level Cash Flows¹ | |||||
| Year 0 | Year 1 | Year 2 | |||
| Net Cash Flow | ($3,000,000) | $788,978 | $3,276,835 | ||
| RM Platform Investor-Level Cash Flows - Hypothetical $50,000 Investment¹ | |||||
| Year 0 | Year 1 | Year 2 | |||
| Net Cash Flow | ($50,000) | $13,150 | $54,614 | ||
(1) RM Technologies, LLC and its affiliates do not provide any assurance of returns. Returns presented are net of all fees. Please carefully review the Fees and Disclaimers sections below for additional information concerning Sponsor’s use or projected returns and fees paid to Sponsor and RM Technologies, LLC.
Certain fees and compensation will be paid over the life of the transaction; please refer to Williams Homes' materials for details. The following fees and compensation will be paid(1)(2):
| One-Time Fees: | |||
| Type of Fee | Amount of Fee | Received By | Paid From |
| G&A Fee | 4.0% of Gross Revenue | Williams Homes | Upfront Capitalization |
| Sales Commission Fee | 1.5% of Gross Revenue | Williams Homes | Closing Proceeds |
| Warranty Fee | 1.0% of Gross Revenue | Williams Homes | Closing Proceeds |
| Technology Solution Licensing Fee(2) | Flat one-time licensing fees of $15,000 plus $1,500 per each prospective investor onboarded by Sponsor through its license and use of RM Technologies’ Technology Solution | RM Technologies, LLC |
Capitalization (at Sponsor’s discretion) |
| Recurring Fees: | |||
| Type of Fee | Amount of Fee | Received By | Paid From |
| Administration Solution Licensing Fee(2) | Flat quarterly licensing fee of $125 per investor serviced by Sponsor through the license and use of RM Technologies’ Administration Solution | RM Technologies, LLC | Cash Flow |
(1) Fees may be deferred to reduce impact to investor distributions.
(2) Please see the Fees and Disclaimers sections below for additional information concerning fees paid to RM Technologies, LLC.
.
RM Securities, LLC, its registered representatives, affiliates, associated persons, and personnel of its affiliates who may also be associated with it, including our associated persons and personnel of our affiliates who are also be associated with RM Securities, LLC (it (“RM Securities,” “we,” “our,” or “us”) will receive fees, expense reimbursements, and other compensation (“Fees”) from the issuer of this investment offering, its sponsor, or an affiliate thereof (“Sponsor”), or otherwise in connection with Sponsor’s offering. The Fees paid to us are in addition to other fees you will pay to Sponsor or in connection with Sponsor’s investment offering. You will pay Fees to Sponsor, either directly or indirectly as an investor in the Sponsor’s offering. Sponsor will use the Fees you pay, as well as funds you invest in the relevant offering, to compensate us. The Fees paid to us will directly or indirectly be borne by you as the investor (typically, but not always, in the form of an expense of the Sponsor’s offering in which you invest) because such Fees will reduce the proceeds available for distribution to you and reduce the amount you earn over time.
For more information on the Fees paid to us, or any other Fees you will pay in connection with Sponsor’s offering, please carefully review the Sponsor’s Investment Documents. Please also carefully review RM Securities’ Form CRS, Regulation Best Interest Disclosures, and Limited Brokerage Services Agreement.
No Approval, Opinion or Representation, or Warranty by RM Securities, LLCSponsor has provided, approved, and is solely responsible in all aspects for the information on this webpage (“Page”), including Sponsor’s offering documentation, which may include without limitation the Private Placement Memorandum, Operating or Limited Partnership Agreement, Subscription Agreement, the Project Summary and all exhibits and other documents attached thereto or referenced therein (collectively, the “Investment Documents”). The Investment Documents linked on this page have been prepared and posted by Sponsor, and not by RM Securities. We did not assist in preparing, do not adopt or endorse, and we are not otherwise responsible for, the Sponsor’s Investment Documents. We make no representations or warranties as to the accuracy of information on this Page or in the Sponsor’s Investment Documents and we accept no liability therefor. No part of the information on this Page or in the Sponsor’s Investment Documents is intended to be binding on us.
Sponsor’s Information Qualified by Investment DocumentsThe information on this Page is qualified in its entirety by reference to the more complete information about the offering contained in the Sponsor’s Investment Documents. The information on this Page is not complete and subject to change at the Sponsor’s discretion at any time up to the closing date. The Sponsor’s Investment Documents and supplements thereto contain important information about the Sponsor’s offering including relevant investment objectives, the business plan, risks, charges, expenses, and other information, which you should consider carefully before investing. The information on this Page should not be used as a basis for an investor’s decision to invest.
Risk of InvestmentThis investment is speculative, highly illiquid, and involves substantial risk. There can be no assurances that all or any of Sponsor’s assumptions, expectations, estimates, goals, hypothetical illustrations, or other aspects of Sponsor’s business plans (“Assumptions”) will be true or that actual performance will bear any relation to Sponsor’s Assumptions, and no guarantee or representation is made that Sponsor’s Assumptions will be achieved. If Sponsor does not achieve its Assumptions, your investment could be materially and adversely affected. A loss of part or all of the principal value of your investment may occur. You should not invest unless you can readily bear the consequences of such loss. Sponsor’s Assumptions should not be relied upon as the primary basis for your decision to invest.
No Reliance on Forward-Looking Statements; Sponsor AssumptionsSponsor is solely responsible for statements made concerning forward-looking statements and Assumptions, which apply only as of the date made, are preliminary and subject to change, and are expressly qualified in their entirety by the disclosures and cautionary statements included in Sponsor’s Investment Documents, which you should carefully review. Neither RM Securities nor Sponsor are obligated to update or revise such forward-looking statements or Assumptions to reflect events or circumstances that arise after the date made or to reflect the occurrence of unanticipated events. Sponsor’s forward-looking statements and Assumptions are hypothetical, not based on actual investment achievements or events, and are presented solely for purposes of providing insight into the Sponsor’s investment objectives, detailing Sponsor’s anticipated risk and reward characteristics, and establishing a benchmark for future evaluation of actual results; therefore, they are not a predictor, projection, or guarantee of future results. You should not rely on Sponsor’s forward-looking statements as a basis to invest.
Importantly, we do not adopt, endorse, or provide any assurance of returns or as to the accuracy or reasonableness of Sponsor’s Assumptions or forward-looking statements.
No Reliance on Past PerformanceAny description of past performance is not a reliable indicator of future performance and should not be relied upon as the primary basis to invest.
Sponsor’s Use of DebtA substantial portion of the total cost of the real estate asset acquired by the Sponsor with investor funds (“Property”) will be paid with borrowed funds, i.e., debt. Sponsor’s estimated rates and terms of the debt financing are subject to lender approval, and there is no assurance that the Sponsor will secure debt at the rates and terms presented on this Page or in the Sponsor’s Investment Documents, or at all. The use of borrowed money to acquire real estate is referred to as leveraging, which can amplify losses and could result in lender foreclosure. In addition, if the debt includes a variable (or “floating”) interest rate, the total amount of interest paid over the term of the debt will fluctuate and can increase. As a result, Sponsor’s use of debt can result in a loss of some or all of your investment.
Sponsor’s Offering is Not RegisteredSponsor’s securities offering will not be registered under the Securities Act of 1933, as amended (the “Securities Act”), in reliance upon the exemptions from registration pursuant to Rule 506(c) of Regulation D as promulgated under the Securities Act (“Private Placement”). In addition, the offering will not be registered under any state securities laws in reliance on exemptions from state registration. Such securities (your ownership interests) are subject to restrictions on transferability and resale and may not be transferred or resold except as permitted under applicable state and federal securities laws pursuant to registration or an available exemption. All Private Placements on the Platform are intended solely for “Accredited Investors,” as that term is defined in Rule 501(a) under the Securities Act.
No Investment AdviceNothing on this Page should be regarded as investment advice (either with respect to a particular security or regarding an overall investment strategy), a recommendation, an offer to sell, or a solicitation of or an offer to buy any security. Advice from a securities professional is strongly advised to understand and assess the risks associated with real estate or private placement investments. For additional information on RM Securities’ involvement in this offering, please carefully review the Sponsor’s Investment Documents, and RM Securities’ Form CRS, Regulation Best Interest Disclosures, and Limited Brokerage Services Agreement.
1031 Exchange RiskInternal Revenue Code Section 1031 (“Section 1031”) contains complex tax concepts and certain tax consequences may vary depending on the individual circumstances of each investor. RM Securities and its affiliates make no representation or warranty of any kind with respect to the tax consequences of your investment or that the IRS will not challenge any such treatment. You should consult with and rely on your own tax advisor about the tax aspects with respect to your particular circumstances.