The team at our affiliated broker-dealer, RM Securities, conducts diligence on of the issuer, including detailed background checks, criminal checks, bad actor checks, and reference checks on sponsors. In addition to screening for any criminal background, we may also turn down sponsors due to poor reference checks, even if the background and criminal checks are satisfactory.
We require unaffiliated sponsors to use an unaffiliated third-party escrow agent.* When an investor makes an investment with such sponsors using the RealtyMogul platform, the investor’s money is transferred directly into a third-party escrow account. All closing conditions in connection with a sponsor’s contingency offering need to be met before the third-party escrow agent will approve releasing investor funds to the issuer or general partner. For example, if an issuer or general partner plans to use funds for a real estate acquisition that does not ultimately transact, the third-party escrow agent will not transfer investor funds to the issuer or general partner, and funds will be returned to investors.
* Unless otherwise disclosed, escrow accounts are not required for some investments that accommodate 1031 investments where the property is already acquired.
Our processes typically includes visiting certain properties (or a subset of properties if it's a fund) to confirm the real estate is what and where the real estate is supposed to be. For certain properties that accommodate 1031 exchange investments, the team will review third-party prepared due diligence reports in lieu of a site visit.
We have formalized processes and checklists for every private placement deal listed on the platform.


Durable cash flow from day one by the strength of the exceptional basis ($156k/unit), fixed-rate financing at 4.95%, and below market in-place rents allowing for a projected Year 1 cap rate (5.65%) without the need to be overly aggressive on rent growth.

Superior proforma returns as the Sponsor is purchasing the Property at a very favorable price per unit. The average sales price is over $200,000/unit in the area, and Sponsor is purchasing the Property at $156,000/unit.

The Property provides relatively low-cost value-add opportunities, such as burning off concessions, increasing occupancy, and catching up rents to past 60-day numbers.
Prism Multi Family Group
Prism Multi Family Group is a Canadian-based real estate investment and asset management company specializing in acquiring value-add multifamily residences in the United States. The goal of the Company is to bring these properties up to par operationally for tenants while maximizing the NOI of the Property, thereby increasing value for investors. They do this by hiring best-in-class management companies, eliminating unnecessary expenses, and maximizing potential market rent. The Company currently has ~$268M in AUM with properties spanning the southern United States, in Florida, Arizona, Texas, Nevada, and California.
https://prismmf.com/-
 Mark ZoltyPresident
 -
 Mitch ZoltyPartner
 -
 Bernard HeitnerPartner
Mark Zolty has extensive residential real estate experience, having been in the industry for over 15 years. Prior to founding Prism, Mark held the title of Principal and Managing Director at Brass Enterprises Inc., a real estate investment company focused exclusively on multifamily properties. He was responsible for overseeing all of Brass’s asset management, acquisitions, and financing functions totaling $450,000,000 in AUM. Prior to joining Brass in 2009, Mark served as a Property Manager at MetCap Living Management, one of Canada’s largest private property management firms.
Since co-founding Prism 4 years ago Mitch has been instrumental in the acquisition of over $250 million in properties. Mitch harnesses his keen business acumen and operational knowledge, overseeing the company’s asset management, acquisition closings, and the implementation of Prism’s signature value-add strategy across the portfolio. A third-generation property operator, Mitch has spent much of his life learning from his family’s 65 years in the multifamily industry.
Bernard is a seasoned businessman with global experience. He founded Cambridge Global Payments in 1992 and turned it into the largest private foreign exchange house in North America. With his business acumen, he grew Cambridge from a 4-person office to a 400-person company with offices in North and South America, Europe, Asia, and Australia. He expanded the company from its roots in forex to a global payment service. In 2017 he sold the company for $900M. At Prism, Bernard is focused on growing the portfolio by enabling strategic partnerships.
Prism Multi Family Group Track Record
| Property | City, State | Asset Type | Acq Date | Units | Purchase Price | Sale Price |
| Las Vegas Portfolio (3 properties) | Las Vegas, NV | Multifamily | 12/1/2018 | 390 | $43,000,000 | $72,000,000 |
| Spectra at Reno | Las Vegas, NV | Multifamily | 12/2/2018 | 90 | $9,000,000 | $12,250,000 |
| Latitude 33 | Palm Springs, CA | Multifamily | 1/1/2018 | 121 | $16,625,000 | N/A |
| 72 West | Tamarac, FL | Multifamily | 10/1/2019 | 291 | $47,000,000 | N/A |
| Hamlet & Continental | Plantation and Lauderhill, FL | Multifamily | 5/1/2020 | 399 | $53,500,000 | N/A |
| Lakehouse Apartments | Lake Elsinore, CA | Multifamily | 12/1/2020 | 128 | $23,500,000 | N/A |
| Ridgeway Village | Glendale, AZ | Multifamily | 8/1/2021 | 200 | $28,500,000 | N/A |
| Spectra Parks (formally Citizen House Decker) | Austin, TX | Multifamily | 12/8/2021 | 324 | $77,100,000 | N/A |
| Spectra Paradise | Las Vegas, NV | Multifamily | 3/1/2022 | 205 | $22,500,000 | N/A |
| Total | 2,148 | $320,725,000 |
The above bios and track record were provided by Prism Multi Family Group and have not been independently verified by RealtyMogul.
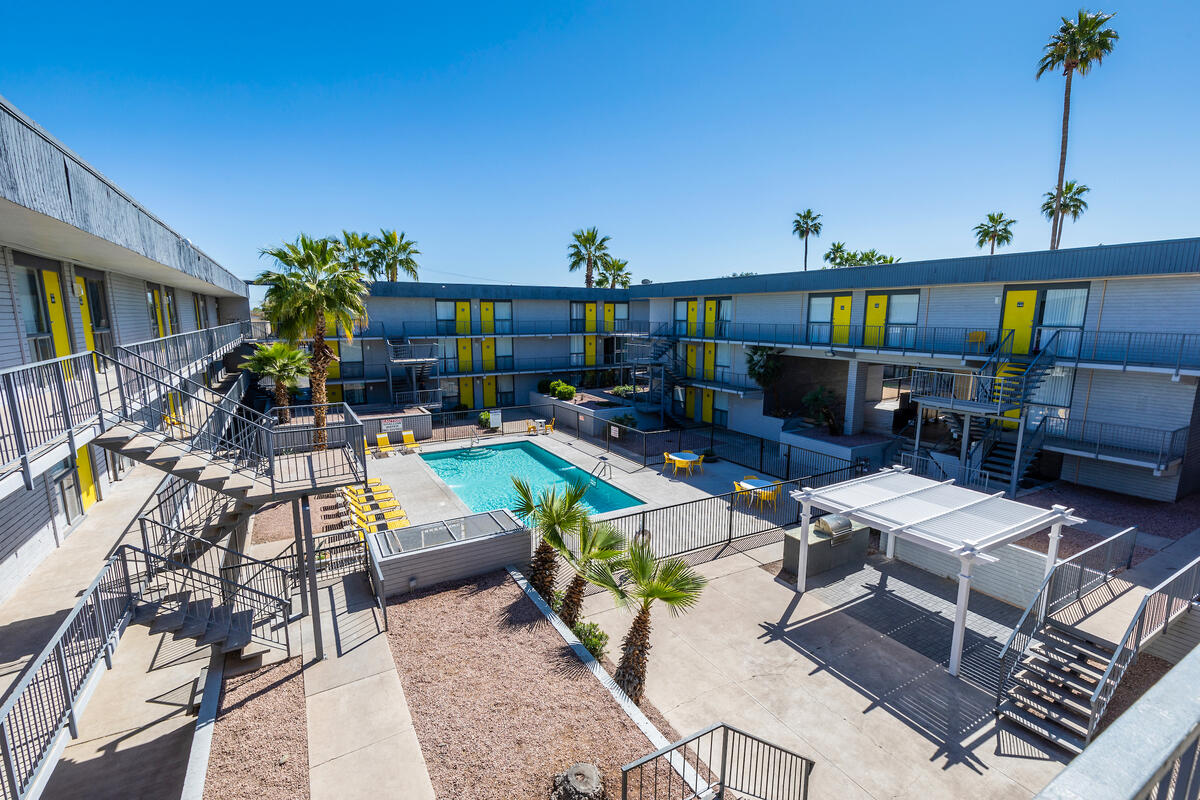
Flats at 2030 is a value-add property totaling 237 units located in the West submarket of Phoenix. The Property experienced a fire and roof collapse in the last year and a half, and ownership has had to offer significant discounts and concessions to get occupancy into the mid-80 % range. The rental rates achieved at the asset over the past 60-days have been 10.16% over the current in-place rents (without factoring in new rents receiving 1 month free as a move-in concession), so there is room for natural rent growth.
The plan is to burn off the existing loss-to-lease, taper off the move-in concessions, and increase the occupancy from the current 81.4%. The Sponsor also plans on renovating 50% of the remaining unrenovated units (59 units to be renovated) at an average of $7,700/unit. The Sponsor will also have a $1,000,000 common area CapEx budget for projected roof section replacements, as well as any contingencies required throughout the Property. The Sponsor expects to achieve market rent growth of 3% annually throughout. The deal is a 5-year projected hold.
Budget
| Acquisition Cost | Total Amount | Per Unit |
| Purchase Price | $37,000,000 | $156,118 |
| Closing Costs | $317,500 | $1,340 |
| Mortgage Brokerage Fee | $222,000 | $937 |
| Total Acquisition Costs | $37,539,500 | $158,395 |
| Capital Expenditures | ||
| Unit Renovations (59 units) | $453,760 | $1,915 |
| Property-Wide CapEx | $1,000,000 | $4,219 |
| Total Capital Expenditures | $1,453,760 | |
| Grand Total | $38,993,260 | $164,529 |
The Sponsor is acquiring the asset at an exceptional basis ($156k/unit) due to the Property's significantly below market rents. Two years ago, the Property experienced a fire and roof collapse in one of the buildings. While the Property has been fully repaired, the fire led to a distressing situation where the current owner was forced to offer significant pricing discounts and concessions, and occupancy dipped to 81%. Prism will institute a strategic multi-pronged value-add plan to increase occupancy, end concessions, and bring rents in line with the current market.
Unit Mix
| # of Units | Avg SF/Unit | Avg Rent | Rent PSF | Stab Rent | Rent PSF | |
| Studio | 107 | 409 | $964 | $2.36 | $1,057 | $2.58 |
| 1 Bed/1 Bath | 128 | 575 | $1,151 | $2.00 | $1,238 | $2.15 |
| 2 Bed/1 Bath | 2 | 700 | $1,500 | $2.14 | $1,500 | $2.14 |
| Total/Averages | 237 | 501 | $1,070 | $2.13 | $1,298 | $2.59 |
Lease Comparables
| Sandpainter Apartments | Urban 188 | GC Square | The Villages at Metro Center | 2025 West Apartments | U at 19th Apartments | Comp Averages | Flats at 2030 | |
| Address | 2225 West Indian School Rd, Pheonix, AZ, 85015 | 1601 West Camelback Rd, Phoenix, AZ, 85015 | 3535 West Camelback Rd, Phoenix, AZ, 85019 | 3106 West Vogel Ave, Phoenix, AZ, 85051 | 2025 W Indian School Road, Phoenix, AZ 85015 | 4802 N 19th Avenue, Phoenix, AZ 85015 | 2030 West Indian School Rd, Phoenix, AZ 85015 | |
| Year Built | 1978 | 1970 | 1976 | 1979 | 1973 | 1973 | 1971 | |
| Units | 116 | 188 | 165 | 290 | 280 | 236 | 212 | 237 |
| Average Rental Rate | $1,340 | $1,092 | $1,078 | $1,116 | $1,149 | $1,547 | $1,244 | $1,070 |
| Average SF | 580 | 506 | 438 | 770 | 476 | 877 | 623 | 504 |
| Average $/SF | $2.31 | $2.16 | $2.46 | $1.45 | $2.41 | $1.76 | $2.00 | $2.20 |
| # Units (Studio) | 24 | 92 | 112 | 24 | 128 | N/A | 76 | 107 |
| $ (Studio) | $1,185 | $1,030 | $850 | $906 | $1,220 | N/A | $1,038 | $964 |
| SF (Studio) | 379 | 470 | 405 | 400 | 380 | N/A | 410 | 410 |
| $/SF (Studio) | $3.13 | $2.19 | $2.10 | $2.27 | $3.21 | N/A | $2.53 | $2.35 |
| # Units (1x1) | 64 | 96 | 52 | 121 | 144 | 20 | 83 | 128 |
| $ (1x1) | $1,485 | $1,150 | $1,025 | $1,035 | $1,355 | $1,395 | $1,241 | $1,151 |
| SF (1x1) | 700 | 540 | 510 | 575 | 540 | 677 | 571 | 575 |
| $/SF (1x1) | $2.12 | $2.13 | $2.01 | $1.80 | $2.51 | $2.06 | $2.17 | $2.00 |
| # Units (2x1) | 20 | N/A | N/A | 96 | 4 | 30 | 38 | 2 |
| $ (2x1) | $1,650 | N/A | N/A | $1,177 | $1,585 | $1,650 | $1,516 | $1,500 |
| SF (2x1) | 829 | N/A | N/A | 835 | 866 | 925 | 853 | 700 |
| $/SF (3x2) | $1.99 | N/A | N/A | $1.41 | $1.83 | $1.78 | $1.78 | $2.14 |
| Distance to Subject | 0.2 miles | 1.6 miles | 2.7 miles | 6.5 miles | 0.1 miles | 1.3 miles | 2.1 miles |
Sales Comparables
| Sandpainter Apartments | Urban 188 | GC Square | The Villages at Metro Center | Total/Averages | Flats at 2030 | |
| Date | Apr '22 | Jan '22 | Mar '22 | Apr '22 | Oct '22 | |
| Submarket | Pheonix | Pheonix | Pheonix | Pheonix | Pheonix | |
| Year Built | 1978 | 1970 | 1976 | 1979 | 1976 | 1971, Renov 2018 |
| SF | 67,180 | 95,080 | 72,335 | 223,080 | 114,419 | 119,448 |
| Units | 116 | 188 | 165 | 290 | 190 | 237 |
| Average SF | 580 | 506 | 438 | 770 | 574 | 501 |
| Sale Price | $27,000,000 | $35,000,000 | $31,000,000 | $80,000,000 | $43,250,000 | $37,000,000 |
| $/Unit | $235,000 | $186,170 | $188,000 | $275,862 | $221,258 | $156,118 |
| $/SF | $406 | $317 | $425 | $359 | $377 | $311 |
| Distance from Subject | 0.2 miles | 1.6 miles | 2.7 miles | 6.6 miles | 2.2 miles |
Market Overview
Population growth, a diversifying economy, relative affordability, and business-friendly regulation have strengthened the Phoenix value proposition. Corporate taxes are minimal, local infrastructure provides access to national and international markets, and the city’s numerous colleges and universities provide companies with an educated talent pool. As a result, dozens of businesses have moved to Phoenix. Digital technology, financial services, aerospace, defense, electronics ‒ the city’s capital investment is staggering, and its job opportunities have skyrocketed, drawing in hundreds of workers eager to grow their careers.
Despite the robust population growth over the past several years, single-family development has not kept pace, and pricing has soared. Phoenix has been a top market for home price appreciation for the past few years. This low inventory and unwavering price escalation continues to force some would-be homeowners into the renter pool, leading to record-low vacancy rates and accelerated rent growth, even as the market receives a record level of new supply. Less than 10% of communities are offering concessions, down from 25% one year ago.
Investors are taking notice; Phoenix has become one of the top markets in the nation for investment volume, ahead of core markets including New York and Los Angeles (CoStar). About $17.8 billion worth of apartments has traded in Phoenix in the past 12 months. Sales volume in 2021 hit an all-time annual high and ranked second in the U.S. behind Atlanta. Key economic drivers, capital investments, and a growing amenity base will continue to generate housing demand in the submarket.
Submarket Overview
The Property is situated between Downtown Phoenix and the burgeoning Grand Canyon University. Significant employers within 11 minutes of the Property include Grand Canyon University, Kenyon Plastering Inc., and Empire Power Systems. Those are in addition to the numerous companies located in Midtown, Downtown, and the Camelback Corridor, including Banner Health, St. Joseph’s Hospital, U-Haul International, Wells Fargo, JP Morgan Chase, and Phoenix Children’s Hospital. The light rail began operation in 2008. With 20 stops in the submarket, residents have easy access to Uptown, Phoenix Sky Harbor Airport, and parts of the East Valley. It has also attracted new businesses.


Total Capitalization
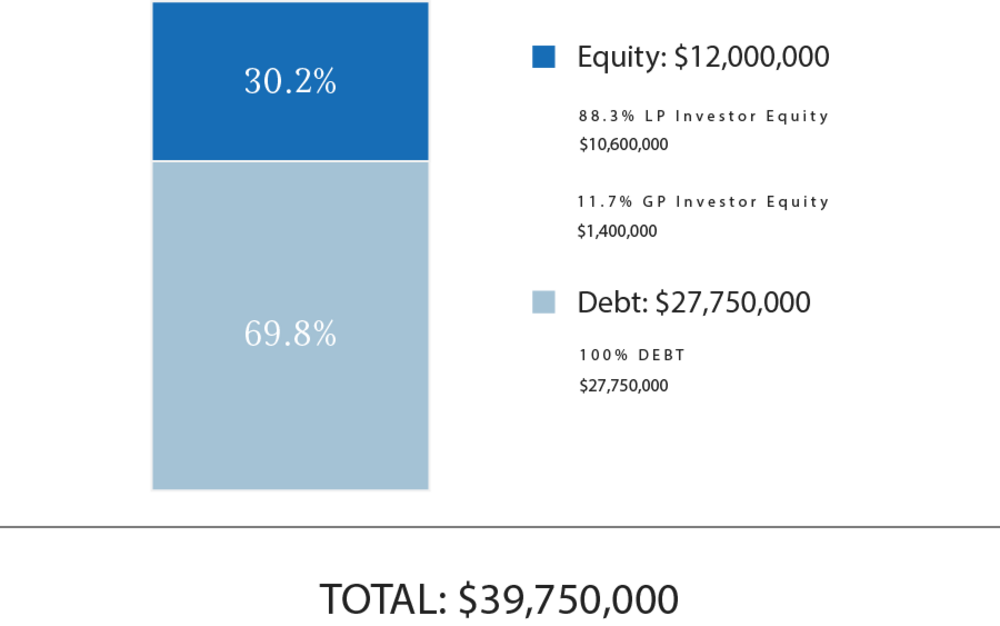
| Sources of Funds | $ Amount | $/Unit |
| Debt | $27,750,000 | $117,088 |
| GP Investor Equity(1) | $1,400,000 | $5,907 |
| LP Investor Equity | $10,600,000 | $44,725 |
| Total Sources of Funds | $39,750,000 | $167,722 |
| Uses of Funds | $ Amount | $/Unit |
| Purchase Price | $37,000,000 | $156,118 |
| Closing Costs | $317,500 | $1,340 |
| Reserves for Prog Capital Exp | $1,453,760 | $6,134 |
| Loan Closing Costs | $222,000 | $937 |
| Funding of Reserves | $201,740 | $851 |
| Acquisition Fee | $555,000 | $2,342 |
| Total Uses of Funds | $39,750,000 | $167,722 |
(1) The Sponsor’s equity contribution may consist of friends and family equity and equity from funds controlled by the Sponsor.
The expected terms of the debt financing are as follows:
- Lender: New York Community Bank
- Term: 5 years (+5 year extension option)
- LTV: 75.0%
- Estimated Proceeds: $27,750,000
- Interest Type: Fixed
- Annual Interest Rate: 4.95%
- Interest-Only Period: 2 years
- Amortization: 30 years
- Prepayment Terms: 5% year 1, 4% year 2, 2% year 3, 1% thereafter
- Extension Requirements: None
- Modeled Refinance: No
(1) A substantial portion of the total acquisition for the Property will be paid with borrowed funds, i.e., debt. Please carefully review the Disclaimers section below for additional information concerning the Sponsors use of debt.
Prism Multi Family Group intends to make distributions from Prism ISR LP as follows:
- To the Investors, pari passu, all operating cash flows to an 8.0% IRR;
- 80% / 20% (80% to Investors / 20% to Promoted/Carried Interest) of excess cash flow to a 12.0% IRR;
- 70% / 30% (70% to Investors / 30% to Promote/Carried Interest) of excess cash flow thereafter.
Prism Multi Family Group intends to make distributions to investors after the payment of the company's liabilities (loan payments, operating expenses, and other fees as more specifically set forth in the LLC agreements, in addition to any member loans or returns due on member loan).
Distributions are expected to start in June 2023 and are projected to continue on a quarterly basis thereafter. Distributions are at the discretion of Prism Multi Family Group, who may decide to delay distributions for any reason, including maintenance or capital reserves.
Prism Multi Family Group will receive a promoted/carried interest as indicated above.
| Cash Flow Summary | |||||||
| Year 1 | Year 2 | Year 3 | Year 4 | Year 5 | |||
| Effective Gross Revenue | $3,380,560 | $3,757,522 | $3,996,839 | $4,111,574 | $4,229,648 | ||
| Total Operating Expenses | $1,230,756 | $1,287,239 | $1,329,654 | $1,357,291 | $1,385,512 | ||
| Capital Reserves | $59,250 | $61,620 | $63,469 | $64,738 | $66,033 | ||
| Net Operating Income | $2,090,554 | $2,408,663 | $2,603,716 | $2,689,545 | $2,778,103 | ||
| Project-Level Cash Flows | |||||||
| Year 0 | Year 1 | Year 2 | Year 3 | Year 4 | Year 5 | ||
| Net Cash Flow | ($12,000,000) | $802,247 | $984,638 | $775,862 | $861,691 | $28,843,518 | |
| RM Platform Investor-Level Cash Flows(1) | |||||||
| Year 0 | Year 1 | Year 2 | Year 3 | Year 4 | Year 5 | ||
| Net Cash Flow | ($3,159,629) | $170,562 | $216,160 | $163,966 | $185,423 | $6,133,230 | |
| Investor-Level Cash Flows - Hypothetical $50,000 Investment(1) | |||||||
| Year 0 | Year 1 | Year 2 | Year 3 | Year 4 | Year 5 | ||
| Net Cash Flow | ($50,000) | $2,699 | $3,421 | $2,595 | $2,934 | $97,056 | |
(1) RM Technologies, LLC and its affiliates do not provide any assurance of returns. Returns presented are net of all fees. Please carefully review the Fees and Disclaimers sections below for additional information concerning Sponsor’s use or projected returns and fees paid to Sponsor and RM Technologies, LLC.
Certain fees and compensation will be paid over the life of the transaction; please refer to Prism Multi Family Group's materials for details. The following fees and compensation will be paid(1)(2):
| One-Time Fees: | |||
| Type of Fee | Amount of Fee | Received By | Paid From |
| Acquisition Fee | 1.5% of Purchase Price ($555,000) | Prism Multi Family Group | Escrow at Closing |
| Technology Solution Licensing Fee(2) | Flat one-time licensing fees of $15,000 plus $1,500 per each prospective investor onboarded by Sponsor through its license and use of RM Technologies’ Technology Solution | RM Technologies, LLC |
Capitalization (at Sponsor’s discretion) |
| Recurring Fees: | |||
| Type of Fee | Amount of Fee | Received By | Paid From |
| Asset Management Fee | 1.5% of Gross Receipts | Prism Multi Family Group | Prism ISR LP |
| Administration Solution Licensing Fee(2) | Flat quarterly licensing fee of $125 per investor serviced by Sponsor through the license and use of RM Technologies’ Administration Solution | RM Technologies, LLC | Cash Flow |
(1) Fees may be deferred to reduce impact to investor distributions.
(2) Please see the Fees and Disclaimers sections below for additional information concerning fees paid to RM Technologies, LLC.
.
RM Securities, LLC, its registered representatives, affiliates, associated persons, and personnel of its affiliates who may also be associated with it, including our associated persons and personnel of our affiliates who are also be associated with RM Securities, LLC (it (“RM Securities,” “we,” “our,” or “us”) will receive fees, expense reimbursements, and other compensation (“Fees”) from the issuer of this investment offering, its sponsor, or an affiliate thereof (“Sponsor”), or otherwise in connection with Sponsor’s offering. The Fees paid to us are in addition to other fees you will pay to Sponsor or in connection with Sponsor’s investment offering. You will pay Fees to Sponsor, either directly or indirectly as an investor in the Sponsor’s offering. Sponsor will use the Fees you pay, as well as funds you invest in the relevant offering, to compensate us. The Fees paid to us will directly or indirectly be borne by you as the investor (typically, but not always, in the form of an expense of the Sponsor’s offering in which you invest) because such Fees will reduce the proceeds available for distribution to you and reduce the amount you earn over time.
For more information on the Fees paid to us, or any other Fees you will pay in connection with Sponsor’s offering, please carefully review the Sponsor’s Investment Documents. Please also carefully review RM Securities’ Form CRS, Regulation Best Interest Disclosures, and Limited Brokerage Services Agreement.
No Approval, Opinion or Representation, or Warranty by RM Securities, LLCSponsor has provided, approved, and is solely responsible in all aspects for the information on this webpage (“Page”), including Sponsor’s offering documentation, which may include without limitation the Private Placement Memorandum, Operating or Limited Partnership Agreement, Subscription Agreement, the Project Summary and all exhibits and other documents attached thereto or referenced therein (collectively, the “Investment Documents”). The Investment Documents linked on this page have been prepared and posted by Sponsor, and not by RM Securities. We did not assist in preparing, do not adopt or endorse, and we are not otherwise responsible for, the Sponsor’s Investment Documents. We make no representations or warranties as to the accuracy of information on this Page or in the Sponsor’s Investment Documents and we accept no liability therefor. No part of the information on this Page or in the Sponsor’s Investment Documents is intended to be binding on us.
Sponsor’s Information Qualified by Investment DocumentsThe information on this Page is qualified in its entirety by reference to the more complete information about the offering contained in the Sponsor’s Investment Documents. The information on this Page is not complete and subject to change at the Sponsor’s discretion at any time up to the closing date. The Sponsor’s Investment Documents and supplements thereto contain important information about the Sponsor’s offering including relevant investment objectives, the business plan, risks, charges, expenses, and other information, which you should consider carefully before investing. The information on this Page should not be used as a basis for an investor’s decision to invest.
Risk of InvestmentThis investment is speculative, highly illiquid, and involves substantial risk. There can be no assurances that all or any of Sponsor’s assumptions, expectations, estimates, goals, hypothetical illustrations, or other aspects of Sponsor’s business plans (“Assumptions”) will be true or that actual performance will bear any relation to Sponsor’s Assumptions, and no guarantee or representation is made that Sponsor’s Assumptions will be achieved. If Sponsor does not achieve its Assumptions, your investment could be materially and adversely affected. A loss of part or all of the principal value of your investment may occur. You should not invest unless you can readily bear the consequences of such loss. Sponsor’s Assumptions should not be relied upon as the primary basis for your decision to invest.
No Reliance on Forward-Looking Statements; Sponsor AssumptionsSponsor is solely responsible for statements made concerning forward-looking statements and Assumptions, which apply only as of the date made, are preliminary and subject to change, and are expressly qualified in their entirety by the disclosures and cautionary statements included in Sponsor’s Investment Documents, which you should carefully review. Neither RM Securities nor Sponsor are obligated to update or revise such forward-looking statements or Assumptions to reflect events or circumstances that arise after the date made or to reflect the occurrence of unanticipated events. Sponsor’s forward-looking statements and Assumptions are hypothetical, not based on actual investment achievements or events, and are presented solely for purposes of providing insight into the Sponsor’s investment objectives, detailing Sponsor’s anticipated risk and reward characteristics, and establishing a benchmark for future evaluation of actual results; therefore, they are not a predictor, projection, or guarantee of future results. You should not rely on Sponsor’s forward-looking statements as a basis to invest.
Importantly, we do not adopt, endorse, or provide any assurance of returns or as to the accuracy or reasonableness of Sponsor’s Assumptions or forward-looking statements.
No Reliance on Past PerformanceAny description of past performance is not a reliable indicator of future performance and should not be relied upon as the primary basis to invest.
Sponsor’s Use of DebtA substantial portion of the total cost of the real estate asset acquired by the Sponsor with investor funds (“Property”) will be paid with borrowed funds, i.e., debt. Sponsor’s estimated rates and terms of the debt financing are subject to lender approval, and there is no assurance that the Sponsor will secure debt at the rates and terms presented on this Page or in the Sponsor’s Investment Documents, or at all. The use of borrowed money to acquire real estate is referred to as leveraging, which can amplify losses and could result in lender foreclosure. In addition, if the debt includes a variable (or “floating”) interest rate, the total amount of interest paid over the term of the debt will fluctuate and can increase. As a result, Sponsor’s use of debt can result in a loss of some or all of your investment.
Sponsor’s Offering is Not RegisteredSponsor’s securities offering will not be registered under the Securities Act of 1933, as amended (the “Securities Act”), in reliance upon the exemptions from registration pursuant to Rule 506(c) of Regulation D as promulgated under the Securities Act (“Private Placement”). In addition, the offering will not be registered under any state securities laws in reliance on exemptions from state registration. Such securities (your ownership interests) are subject to restrictions on transferability and resale and may not be transferred or resold except as permitted under applicable state and federal securities laws pursuant to registration or an available exemption. All Private Placements on the Platform are intended solely for “Accredited Investors,” as that term is defined in Rule 501(a) under the Securities Act.
No Investment AdviceNothing on this Page should be regarded as investment advice (either with respect to a particular security or regarding an overall investment strategy), a recommendation, an offer to sell, or a solicitation of or an offer to buy any security. Advice from a securities professional is strongly advised to understand and assess the risks associated with real estate or private placement investments. For additional information on RM Securities’ involvement in this offering, please carefully review the Sponsor’s Investment Documents, and RM Securities’ Form CRS, Regulation Best Interest Disclosures, and Limited Brokerage Services Agreement.
1031 Exchange RiskInternal Revenue Code Section 1031 (“Section 1031”) contains complex tax concepts and certain tax consequences may vary depending on the individual circumstances of each investor. RM Securities and its affiliates make no representation or warranty of any kind with respect to the tax consequences of your investment or that the IRS will not challenge any such treatment. You should consult with and rely on your own tax advisor about the tax aspects with respect to your particular circumstances.