The team at our affiliated broker-dealer, RM Securities, conducts diligence on of the issuer, including detailed background checks, criminal checks, bad actor checks, and reference checks on sponsors. In addition to screening for any criminal background, we may also turn down sponsors due to poor reference checks, even if the background and criminal checks are satisfactory.
We require unaffiliated sponsors to use an unaffiliated third-party escrow agent.* When an investor makes an investment with such sponsors using the RealtyMogul platform, the investor’s money is transferred directly into a third-party escrow account. All closing conditions in connection with a sponsor’s contingency offering need to be met before the third-party escrow agent will approve releasing investor funds to the issuer or general partner. For example, if an issuer or general partner plans to use funds for a real estate acquisition that does not ultimately transact, the third-party escrow agent will not transfer investor funds to the issuer or general partner, and funds will be returned to investors.
* Unless otherwise disclosed, escrow accounts are not required for some investments that accommodate 1031 investments where the property is already acquired.
Our processes typically includes visiting certain properties (or a subset of properties if it's a fund) to confirm the real estate is what and where the real estate is supposed to be. For certain properties that accommodate 1031 exchange investments, the team will review third-party prepared due diligence reports in lieu of a site visit.
We have formalized processes and checklists for every private placement deal listed on the platform.


The Royce at Trumbull was purchased off-market at a price of $101,100,000 which equates to $297,000/unit. This basis is well below comparative sales in Fairfield County which has seen several other assets sell for $400,000 - $500,000/unit. At a total all-in basis of $333,225 per unit, the Property is still well below recent sales comps allowing for tremendous intrinsic value on day one.

The investment is well capitalized with a strong and experienced institutional preferred joint venture partner who provided ~50% of the required equity. The equity from the preferred joint venture partner is structured to allow all cash flow to go to the Limited Partners over and above a 6% current pay. Per the Sponsor, this deal structure allows for outsized return metrics to the Limited Partners that are above current market rate returns.
Trumbull is an affluent town located in Fairfield County with an average income of $150k+ and where home prices range from $400k to $1+ million. With the high cost of ownership, The Royce at Trumbull is one of the most compelling options in the submarket for families to rent because it has the largest average unit sizes amongst its competitors at 1,116 SF and is one of the only apartment communities to offer 3BR unit floorplans.
Colony Hills Capital
Colony Hills Capital offers a specialized focus on one market segment, value-add multifamily housing; mismanaged, underperforming, and undervalued Class A- through B- multifamily assets in growing markets. Their extensive and worldwide network of relationships uncovers significant opportunities, allowing them to respectfully achieve a “win-win” on investing in multifamily properties. Each business plan is property specific; targeted capital improvements and strong hands-on management throughout the hold period maximize asset value and investor returns.
https://www.colonyhillscapital.com/-
 Glenn HansonFounder & Chief Executive Officer
 -
 David KaufmanPresident & Chief Investment Officer
Glenn Hanson, the Founder and majority shareholder of Colony Hills Capital, LLC has over 30 years of experience managing complex organizations. His experience has led to the successful completion of 27 properties since October 2011, which included originating and closing debt and equity, syndication, and collaborative team supervision.
Glenn understands the critical components of a successful commercial real estate team. In just a few years he built a cohesive, productive team. In the past 7 years, under his direction, the team at Colony Hills has sourced and structured 8,700+ units totaling $545 million across the United States. To date, Colony Hills has exited its portfolio investments with every transaction being profitable.
As the primary fund-raiser for Colony Hills, Glenn has built an impressive personal network built on a 35-year career of successful deal flow and continues to cultivate a strong network of business partners from around the globe. This influential network is a result of his persistent quest for dedicated and uncompromising business partners working together to get the deal done.
David Kaufman is the President, Chief Investment Officer, and a Managing Partner of Colony Hills. He has over 25 years of real estate, capital markets, and operational experience gained from working as a risk-arbitrage analyst for a US-based hedge fund, working for a privately held national real estate firm as an acquisition analyst, and as an owner-operator of his own real estate investment and management business. David has a keen eye for underperforming and undervalued investment opportunities.
Under David’s leadership, the Company has experienced tremendous growth, nearly tripling the assets under management. His brilliant sense for off-market, under-performing, and under-valued investment opportunities has led to the successful purchase and profitable close of all of Colony Hills' real estate investments. He continues to fill their pipeline with well-located assets that offer real opportunities for superior returns. To this day, David holds real estate investments that date back to 1990 and continues to personally invest in the future of Colony Hills.
| Properties Owned and Managed | State | Asset Type | Acq Date | # of Units | Total Capitalization | Sale Price |
| Riverchase Landing | AL | Multifamily | 10/6/2011 | 468 | $31,914,292 | $35,650,000 |
| Wynthrope Forest | GA | Multifamily | 8/17/2012 | 270 | $15,188,369 | $20,600,000 |
| Canterbury Townhomes | GA | Multifamily | 10/1/2015 | 160 | $9,259,460 | $12,500,000 |
| Cabana | AL | Multifamily | 5/17/2013 | 545 | $22,219,387 | $26,093,250 |
| Pathways | AL | Multifamily | 5/17/2013 | 244 | $15,530,724 | $20,943,750 |
| Sandpiper | AL | Multifamily | 5/17/2013 | 253 | $9,553,469 | $13,263,000 |
| Windsor Place | AL | Multifamily | 5/17/2013 | 384 | $23,321,832 | $30,900,000 |
| Yester Oaks | AL | Multifamily | 5/17/2013 | 587 | $34,165,750 | $43,100,000 |
| Key Vista | FL | Multifamily | 8/10/2018 | 244 | $17,650,000 | $27,250,000 |
| Windfield Estates | MA | Multifamily | 10/23/2019 | 160 | $15,976,815 | TBD |
| Lakeshire Village | GA | Multifamily | 9/1/2020 | 284 | $26,564,050 | TBD |
| Nottingham Village | TX | Multifamily | 5/28/2021 | 317 | $54,679,560 | TBD |
| Chapel Run | GA | Multifamily | 7/15/2021 | 172 | $22,850,000 | TBD |
| Fields at Peachtree | GA | Multifamily | 9/15/2021 | 240 | $42,646,162 | TBD |
| City West | TX | Multifamily | 10/20/2021 | 510 | $82,500,000 | TBD |
| City Park | TX | Multifamily | 1/21/2022 | 308 | $78,762,786 | TBD |
| Paramount at Kingwood | TX | Multifamily | 3/7/2022 | 372 | $73,489,250 | TBD |
| Sub Total | 5,518 | $576,271,906 | $230,300,000 | |||
| Properties Assigned for Fee | ||||||
| Houston Portfolio (9 Properties) | TX | Multifamily | 12/12/2013 | 2,594 | $250,000,000 | Fee Income |
| Bristol Place (1 Property) | LA | Multifamily | 7/14/2014 | 312 | $38,250,000 | Fee Income |
| Indianapolis Portfolio (7 Properties) | IN | Multifamily | 2/18/2016 | 2,517 | $84,050,000 | Fee Income |
| Sub Total | 5,423 | $372,300,000 | ||||
| Total | 10,941 | $948,571,906 |
The bio and track record were provided by the Sponsor and have not been verified by RealtyMogul.
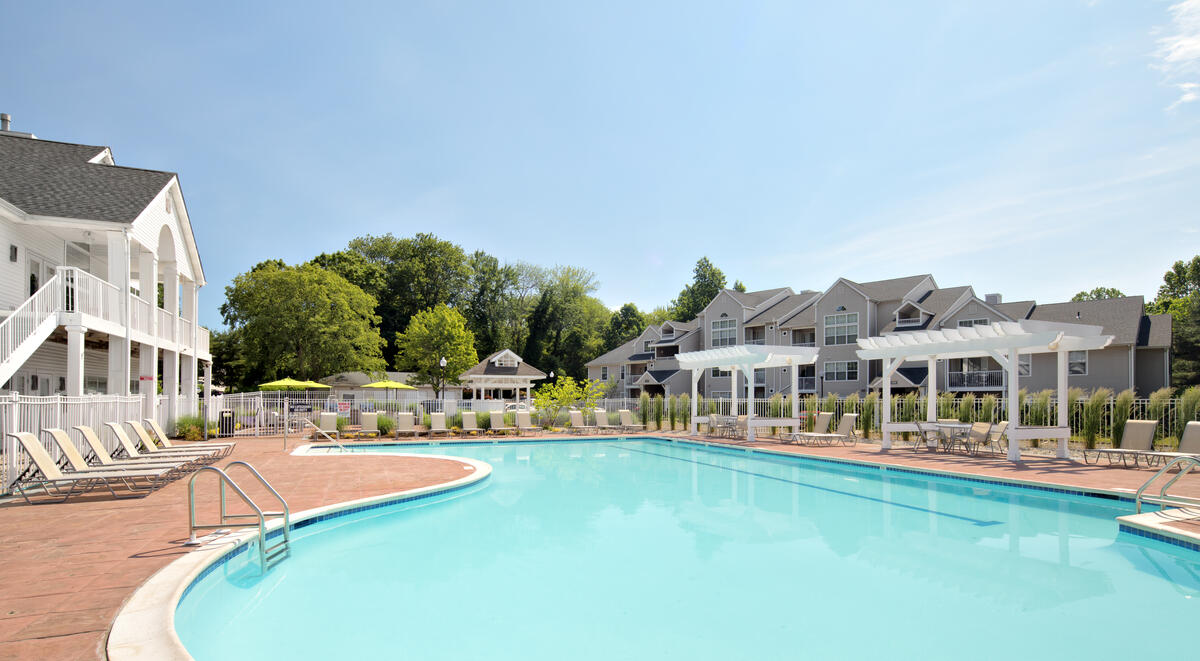
The Royce at Trumbull is a garden-style, workforce housing acquisition strategically located in the affluent town of Trumbull, CT between the employment centers of New Haven and Stamford, CT. The Property is ideally located near top-rated retail, schooling, strong employment, and recreation and it is situated right next to Route 25.
The Royce is positioned to benefit in a major way from interior and exterior value add investments. The Seller has renovated 30 units and has made some minor updates to prior renovations. The Property requires some polishing to several of its amenities and renovation to 91% of the units in order to compete in the submarket. Per extensive analysis of the Property economics and the market competition, and consistent with their successful model, CHC has underwritten a projected, average $464/unit lift to the current rents post interior and exterior renovations.
Built in 1997, the current Seller has spent approximately $1.8 million in capital improvements on the Property, which includes the renovation of 30 units. The Property is currently 99% occupied. Interior Property improvements will include substantial renovations ($15,000/unit) to 50% of the units and partial renovations ($7,500/unit) to 41% of the units. The weighted average capex will be approximately $10,590/unit for the interiors. Exterior Property improvements will include ($5,147/unit) the enhancement of the clubhouse, pool area refurbishment/resurfacing, installment of a package locker system, significant landscaping, and the improvement of the current signage.
The current seller has left rents at rates that were appropriate for the beginning of COVID while all of The Royce's rental comps have skyrocketed 30%+. The Seller has only woken up to this fact three months ago and has begun to mark rents to market which is validation for CHC's strategy and benefits the Property's underwriting for fixed-rate agency financing. Furthermore, the Property is awkwardly overstaffed and has inappropriately run below-the-line expense items through repairs and maintenance. CHC will almost immediately be able to remedy the two aforementioned expenses by reducing them by a combined $460,000.
Lastly, Trumbull, CT put into place a moratorium on new development in 2000 which was briefly lifted in 2019 for two new developments (The Royce's only two rental comps), but the moratorium was put back into place until 2023. The absence of new development has created a dearth of multifamily housing supply in Trumbull but with a strong and increasing demand.
Development Budget
| Acquisition Cost | $ Amount | Per Unit | Per SF |
| Purchase Price | $101,100,000 | $297,353 | $266.56 |
| Loan Origination Fee / Assumption Fee | $650,000 | $1,912 | $1.71 |
| Acquisition / Equity Fee | $1,856,821 | $5,461 | $4.90 |
| Guarantor Fee | $650,000 | $1,912 | $1.71 |
| Stub Interest Paid at Closing | $300,000 | $882 | $0.79 |
| Due Diligence | $102,025 | $300 | $0.27 |
| Title Insurance | $125,000 | $368 | $0.33 |
| Insurance Premium (Provider) | $170,000 | $500 | $0.45 |
| Operations Reserve | $500,000 | $1,471 | $1.32 |
| Contingency | $370,281 | $1,089 | $0.98 |
| Total Acquisition Costs | $105,824,127 | $311,248 | $279.02 |
| Capital Expenditures - Hard Costs | |||
| CapEx | $6,870,000 | $20,206 | $18.11 |
| Total Hard Costs | $6,870,000 | $20,206 | $18.11 |
| Capital Expenditures - Soft Costs | |||
| Legal Fees | $205,000 | $603 | $0.54 |
| Loan Costs | $20,000 | $59 | $0.05 |
| Utility Deposits | $75,000 | $221 | $0.20 |
| Working Capital | $100,000 | $294 | $0.26 |
| Real Estate Tax Reserve | $171,654 | $505 | $0.45 |
| Prepaid Insurance | $30,633 | $90 | $0.08 |
| Total Soft Costs | $602,287 | $1,771 | $1.59 |
| Grand Total | $113,296,414 | $333,225 | $298.71 |
The Royce at Trumbull is a garden-style, value add acquisition strategically located in the affluent town of Trumbull, CT, between the employment centers of New Haven and Stamford, CT. The Property is ideally located near top-rated retail, schooling, strong employment, recreation, and it is situated right next to Route 25, a major transportation corridor allowing easy access to Hartford, New Haven, Stamford, and New York City. The Royce is positioned to benefit in a major way from interior and exterior value-add investments. The previous owner had renovated 30 units and had made some minor updates to prior renovations. The Property requires some polishing to several of its amenities and renovation to 91% of the units in order to compete in the submarket. Per extensive analysis of the Property economics and the market competition, post-renovated rents are projected to increase by $400-$500 per unit on average per month.
Unit Mix
| Partially Renovated (Current) | # of Units | Avg SF/Unit | Avg Rent | Rent per SF |
| 1x1 | 20 | 713 | $1,654 | $2.32 |
| 1x1 | 12 | 849 | $1,758 | $2.07 |
| 1x1 | 24 | 853 | $1,733 | $2.03 |
| 2x1 | 8 | 1,003 | $1,831 | $1.83 |
| 2x2 | 32 | 1,186 | $2,095 | $1.77 |
| 2x2 | 43 | 1,246 | $2,256 | $1.81 |
| 2x2 | 15 | 1,331 | $2,302 | $1.73 |
| 2x2 | 20 | 1,415 | $2,323 | $1.64 |
| 3x2 | 33 | 1,298 | $2,370 | $1.83 |
| Classic (Current) | ||||
| 1x1 | 20 | 713 | $1,548 | $2.17 |
| 1x1 | 4 | 849 | $1,704 | $2.01 |
| 1x1 | 22 | 853 | $1,523 | $1.79 |
| 2x1 | 12 | 1,003 | $1,659 | $1.65 |
| 2x2 | 20 | 1,186 | $1,879 | $1.58 |
| 2x2 | 21 | 1,246 | $1,950 | $1.57 |
| 2x2 | 9 | 1,331 | $2,053 | $1.54 |
| 2x2 | 8 | 1,415 | $2,064 | $1.46 |
| 3x2 | 17 | 1,298 | $2,081 | $1.60 |
| Total/Averages | 340 | 1,116 | $1,982 | $1.78 |
| Proforma Rents | # of Units | Avg SF/Unit | Upgraded Rent | Rent per SF |
| 1x1 | 40 | 713 | $1,950 | $2.73 |
| 1x1 | 16 | 849 | $2,050 | $2.41 |
| 1x1 | 46 | 853 | $2,125 | $2.49 |
| 2x1 | 20 | 1,003 | $2,300 | $2.29 |
| 2x2 | 52 | 1,186 | $2,500 | $2.11 |
| 2x2 | 64 | 1,246 | $2,600 | $2.09 |
| 2x2 | 24 | 1,331 | $2,800 | $2.10 |
| 2x2 | 28 | 1,415 | $2,875 | $2.03 |
| 3x2 | 50 | 1,298 | $3,000 | $2.31 |
| Total/Averages | 340 | 1,116 | $2,496 | $2.24 |
Lease Comparables
| Woodside Trumbull | Ten Trumbull | Merion Stratford | 1111 Stratford | Empire 225 | The Mark Apartments | The Renaissance | Comp Averages | The Royce at Trumbull | |
| Address | 2300 Reservoir Ave | 100 Oakview Dr | 1000 Avalon Way | 1111 Stratford Ave | 225 Lordship Blvd | 7 Acadia Ln | 100 Parrott Dr | 100 Avalon Gates | |
| Year Built | 2021 | 2020 | 2014 | 2014 | 2019 | 2016 | 2007 | 2016 | 1997 |
| Units | 199 | 202 | 130 | 128 | 69 | 228 | 126 | 155 | 340 |
| Occupancy | 90.9% | Not Available | 99.3% | 97.7% | Not Available | 93.3% | Not Available | 95.3% | 99.1% |
| Average Rental Rate | $3,086 | $2,792 | $3,073 | $2,195 | $1,890 | $3,069 | $2,519 | $2,778 | $1,982 |
| Average SF | 1042 | 1,020 | 1,160 | 750 | 806 | 1,031 | 1,051 | 980 | 1,116 |
| Average $/SF | $2.96 | $2.74 | $2.65 | $2.93 | $2.34 | $2.98 | $2.40 | $2.83 | $1.78 |
| Distance to Subject | 0.5 miles | 0.7 miles | 3.3 miles | 4.1 miles | 4.2 miles | 4.7 miles | 4.7 miles | 3.2 miles | |
| # Units (1x1) | 104 | 87 | 80 | 67 | 30 | 96 | 40 | 72 | 102 |
| $ (1x1) | $2,607 | $2,525 | $2,886 | $2,042 | $1,806 | $2,425 | $2,205 | $2,448 | $1,638 |
| SF (1x1) | 803 | 829 | 1,058 | 692 | 728 | 854 | 830 | 841 | 797 |
| $/SF (1x1) | $3.25 | $3.05 | $2.73 | $2.95 | $2.48 | $2.84 | $2.66 | $2.91 | $2.05 |
| # Units (2x1) | - | - | - | - | 29 | - | 28 | 29 | 20 |
| $ (2x1) | - | - | - | - | $2,095 | - | $2,411 | $2,250 | $1,728 |
| SF (2x1) | - | - | - | - | 1,010 | - | 1,005 | 1,008 | 1,003 |
| $/SF (2x1) | - | - | - | - | $2.07 | - | $2.40 | $2.23 | $1.72 |
| # Units (2x2) | 95 | 115 | 40 | 31 | - | 132 | 48 | 77 | 168 |
| $ (2x2) | $3,610 | $2,994 | $3,274 | $2,915 | - | $3,538 | $3,055 | $3,302 | $2,134 |
| SF (2x2) | 1,303 | 1,165 | 1,309 | 1,061 | - | 1,160 | 1,365 | 1,218 | 1,268 |
| $/SF (2x2) | $2.77 | $2.57 | $2.50 | $2.75 | - | $3.05 | $2.24 | $2.71 | $1.68 |
| # Units (3x2) | - | - | 10 | - | - | - | - | 10 | 50 |
| $ (3x2) | - | - | $3,760 | - | - | - | - | $3,760 | $2,272 |
| SF (3x2) | - | - | 1,384 | - | - | - | - | 1,384 | 1,298 |
| $/SF (3x2) | - | - | $2.72 | - | - | - | - | $2.72 | $1.75 |
Sales Comparables
| Norwalk Collection | Avalon East Norwalk | Woodside Trumbull | Comp Averages | The Royce at Trumbull | |
| Date Sold | May-22 | Mar-22 | Dec-21 | Aug-22 | |
| Year Built | 2014-2016 | 2013 | 2021 | 2017 | 1997 |
| # of Units | 662 | 240 | 199 | 367 | 340 |
| Average Unit Size | N/A | 916 SF | 1,042 SF | 979 SF | 1116 SF |
| Sale Price | $293,500,000 | $90,000,000 | $98,000,000 | $160,500,000 | $101,100,000 |
| $/Unit | $443,353 | $375,000 | $492,462 | $436,939 | $297,353 |
| Cap Rate | 4.68% | 4.42% | 4.75% | 4.62% | 4.12% |
| Distance from Subject | 14.2 miles | 14.5 miles | 0.9 miles | 14.2 miles |
Market Overview
Due to the increasingly expensive rents in Manhattan, the mass migration from Manhattan to CT, NJ, MA, TX, and FL, and the work-from-home culture since the pandemic, rent growth has increased tremendously in Fairfield County. More businesses have also moved to the immediate area. According to the Bureau of Labor Statistics, job growth in Bridgeport-Stamford Norwalk, CT was 3.3% in November 2021, reflecting 12,400 jobs added during a 12-month period.
Submarket Overview
Trumbull, Connecticut is a very affluent submarket with an average family income exceeding $140,000 within a one-mile radius, and with average home values over $1 million dollars. There was a moratorium on new development put in place in 2000 that was then lifted in 2019 but then put back in place during the pandemic until 2023. There have only been two new developments in Trumbull since 2000. There is a clear dearth of supply in the submarket.


Total Capitalization
| Sources of Funds | $ Amount | $/Unit |
| Senior Debt | $65,000,000 | $191,176 |
| Preferred Equity | $25,432,847 | $74,802 |
| GP Investor Equity(1) | $14,863,567 | $43,716 |
| LP Investor Equity(2) | $8,000,000 | $23,529 |
| Total Sources of Funds | $113,296,414 | $333,225 |
| Uses of Funds | $ Amount | $/Unit |
| Purchase Price | $101,100,000 | $297,353 |
| Closing Costs | $4,724,127 | $13,894 |
| Hard Costs | $6,870,000 | $20,206 |
| Soft Costs | $602,287 | $1,771 |
| Total Uses of Funds | $113,296,414 | $333,225 |
(1) The Sponsor’s equity contribution may consist of friends and family equity and equity from funds controlled by the Sponsor.
(2) Refer to the Offering Documents for more details.
The expected terms of the debt financing are as follows:
- Lender: Freddie Mac
- Term: 10 years
- LTV: 62.5%
- Estimated Proceeds: $65,000,000
- Interest Type: Fixed
- Annual Interest Rate: 4.48%
- Interest-Only Period: 60 months
- Amortization: 35 years
- Prepayment Terms: Yield Maintenance
- Modeled Refinance: No
Preferred Equity Assumptions
- Estimated Proceeds: $25,432,847
- Total Interest Rate(1): 13%
- Current Interest Rate: 6.00%
- Accrued Interest Rate: 7.00%
(1) 13% per annum compounded monthly using a 360-day year (the "Total Preferred Equity Interest Rate"). 6% current portion and 7% will be accrued. The current portion of the Total Preferred Equity Interest Rate will be due and paid monthly from operating cash flow, with any shortfalls accruing.
A substantial portion of the total acquisition for the Property will be paid with borrowed funds, i.e., debt. Please carefully review the Disclaimers section below for additional information concerning the Sponsors use of debt.
Colony Hills Capital intends to make distributions as follows:
- To the Investors, pari passu, all operating cash flows to a 10.0% IRR;
- 85% / 15% (85% to Investors / 15% to Promote/Carried Interest) of excess cash flow thereafter.
Colony Hills Capital intends to make distributions to investors after the payment of the company's liabilities (loan payments, preferred equity interest, operating expenses, and other fees as more specifically set forth in the LLC agreements, in addition to any member loans or returns due on member loan).
Distributions are expected to start in August 2023 and are projected to continue on a quarterly basis thereafter. Distributions are at the discretion of Colony Hills Capital, who may decide to delay distributions for any reason, including maintenance or capital reserves.
Colony Hills Capital will receive a promoted/carried interest as indicated above.
| Cash Flow Summary from Operations | ||||||
| Year 1 | Year 2 | Year 3 | Year 4 | Year 5 | ||
| Effective Gross Income | $8,783,985 | $10,069,402 | $11,271,410 | $12,284,574 | $12,653,111 | |
| Total Operating Expenses | ($3,951,227) | ($4,179,865) | ($4,376,137) | ($4,568,052) | ($4,747,088) | |
| Net Operating Income | $4,832,758 | $5,889,536 | $6,895,273 | $7,716,523 | $7,906,023 | |
| Debt Service to Lender | ($2,952,444) | ($2,960,533) | ($2,952,444) | ($2,952,444) | ($2,952,444) | |
| Partnership Costs & Fees | ($127,840) | ($140,694) | ($152,714) | ($162,846) | ($166,531) | |
| Current Pay Return to Preferred Partner (6%)(1) | ($1,476,076) | ($1,551,404) | ($1,547,165) | ($1,547,165) | ($1,547,165) | |
| Net Cash Flow from Operations | $276,398 | $1,236,905 | $2,242,950 | $3,054,068 | $3,239,883 | |
| Cash Flow Summary from Property Sale | ||||||
| Year 0 | Year 1 | Year 2 | Year 3 | Year 4 | Year 5 | |
| Net Proceeds from Property Sale | - | - | - | - | - | $54,535,568 |
| Net Cash Flow(2) | ($22,863,567) | $276,398 | $1,236,905 | $2,242,950 | $3,054,068 | $57,775,451 |
| Investor-Level Cash Flows(3)(4) | ||||||
| Year 0 | Year 1 | Year 2 | Year 3 | Year 4 | Year 5 | |
| Net Cash Flow | ($8,330,000) | $50,842 | $352,795 | $704,812 | $988,632 | $18,589,846 |
| Investor-Level Cash Flows - Hypothetical $50,000 Investment(3)(4) | ||||||
| Year 0 | Year 1 | Year 2 | Year 3 | Year 4 | Year 5 | |
| Net Cash Flow | ($50,000) | $305 | $2,118 | $4,231 | $5,934 | $111,584 |
(1) The Preferred Partner refers to the Preferred Equity and is not a part of the offering.
(2) Investors will not receive distributions until debt service and preferred equity current interest have been paid (including preferred equity accrued interest upon Property Sale). For example, year 1 distributions to LP Investor Equity are calculated based on the “Net Operating Income” of $4,832,758, reduced by the “Debt Service to Lender” of $2,952,444, “Partnership Costs & Fees” of $127,840, and “Current Pay Return to Preferred Partner (6%)” of $1,476,076. The prior calculation totals $276,398 to be distributed to LP Investor Equity.
(3) RM Technologies, LLC and its affiliates do not provide any assurance of returns. Returns presented are net of all fees. Please carefully review the Fees and Disclaimers sections below for additional information concerning Sponsor’s use or projected returns and fees paid to Sponsor and RM Technologies, LLC.
(4) Refer to the Offering Documents for more details.
Certain fees and compensation will be paid over the life of the transaction; please refer to Colony Hills Capital's materials for details. The following fees and compensation will be paid(1)(2):
| One-Time Fees: | |||
| Type of Fee | Amount of Fee | Received By | Paid From |
| Acquisition Fee | 1.0% of Purchase Price | Colony Hills Capital, LLC | Settlement Statement |
| Guarantor Fee | 1.0% of Debt | Colony Hills Capital, LLC | Settlement Statement |
| Technology Solution Licensing Fee(1) | Flat one-time licensing fees of $15,000 plus $1,500 per each prospective investor onboarded by Sponsor through its license and use of RM Technologies’ Technology Solution | RM Technologies, LLC |
Capitalization (at Sponsor’s discretion) |
| Recurring Fees: | |||
| Type of Fee | Amount of Fee | Received By | Paid From |
| Asset Management Fee | 1.0% of EGI | Colony Hills Capital, LLC | Cash Flow |
| Construction Management Fee | 6% of Construction Budget | Colony Hills Capital, LLC | Cash Flow |
| Administration Solution Licensing Fee(1) | Flat quarterly licensing fee of $125 per investor serviced by Sponsor through the license and use of RM Technologies’ Administration Solution | RM Technologies, LLC | Cash Flow |
(1) Please see the Fees and Disclaimers sections below for additional information concerning fees paid to RM Technologies, LLC.
(2) Fees may be deferred to reduce impact to investor distributions.
RM Securities, LLC, its registered representatives, affiliates, associated persons, and personnel of its affiliates who may also be associated with it, including our associated persons and personnel of our affiliates who are also be associated with RM Securities, LLC (it (“RM Securities,” “we,” “our,” or “us”) will receive fees, expense reimbursements, and other compensation (“Fees”) from the issuer of this investment offering, its sponsor, or an affiliate thereof (“Sponsor”), or otherwise in connection with Sponsor’s offering. The Fees paid to us are in addition to other fees you will pay to Sponsor or in connection with Sponsor’s investment offering. You will pay Fees to Sponsor, either directly or indirectly as an investor in the Sponsor’s offering. Sponsor will use the Fees you pay, as well as funds you invest in the relevant offering, to compensate us. The Fees paid to us will directly or indirectly be borne by you as the investor (typically, but not always, in the form of an expense of the Sponsor’s offering in which you invest) because such Fees will reduce the proceeds available for distribution to you and reduce the amount you earn over time.
For more information on the Fees paid to us, or any other Fees you will pay in connection with Sponsor’s offering, please carefully review the Sponsor’s Investment Documents. Please also carefully review RM Securities’ Form CRS, Regulation Best Interest Disclosures, and Limited Brokerage Services Agreement.
No Approval, Opinion or Representation, or Warranty by RM Securities, LLCSponsor has provided, approved, and is solely responsible in all aspects for the information on this webpage (“Page”), including Sponsor’s offering documentation, which may include without limitation the Private Placement Memorandum, Operating or Limited Partnership Agreement, Subscription Agreement, the Project Summary and all exhibits and other documents attached thereto or referenced therein (collectively, the “Investment Documents”). The Investment Documents linked on this page have been prepared and posted by Sponsor, and not by RM Securities. We did not assist in preparing, do not adopt or endorse, and we are not otherwise responsible for, the Sponsor’s Investment Documents. We make no representations or warranties as to the accuracy of information on this Page or in the Sponsor’s Investment Documents and we accept no liability therefor. No part of the information on this Page or in the Sponsor’s Investment Documents is intended to be binding on us.
Sponsor’s Information Qualified by Investment DocumentsThe information on this Page is qualified in its entirety by reference to the more complete information about the offering contained in the Sponsor’s Investment Documents. The information on this Page is not complete and subject to change at the Sponsor’s discretion at any time up to the closing date. The Sponsor’s Investment Documents and supplements thereto contain important information about the Sponsor’s offering including relevant investment objectives, the business plan, risks, charges, expenses, and other information, which you should consider carefully before investing. The information on this Page should not be used as a basis for an investor’s decision to invest.
Risk of InvestmentThis investment is speculative, highly illiquid, and involves substantial risk. There can be no assurances that all or any of Sponsor’s assumptions, expectations, estimates, goals, hypothetical illustrations, or other aspects of Sponsor’s business plans (“Assumptions”) will be true or that actual performance will bear any relation to Sponsor’s Assumptions, and no guarantee or representation is made that Sponsor’s Assumptions will be achieved. If Sponsor does not achieve its Assumptions, your investment could be materially and adversely affected. A loss of part or all of the principal value of your investment may occur. You should not invest unless you can readily bear the consequences of such loss. Sponsor’s Assumptions should not be relied upon as the primary basis for your decision to invest.
No Reliance on Forward-Looking Statements; Sponsor AssumptionsSponsor is solely responsible for statements made concerning forward-looking statements and Assumptions, which apply only as of the date made, are preliminary and subject to change, and are expressly qualified in their entirety by the disclosures and cautionary statements included in Sponsor’s Investment Documents, which you should carefully review. Neither RM Securities nor Sponsor are obligated to update or revise such forward-looking statements or Assumptions to reflect events or circumstances that arise after the date made or to reflect the occurrence of unanticipated events. Sponsor’s forward-looking statements and Assumptions are hypothetical, not based on actual investment achievements or events, and are presented solely for purposes of providing insight into the Sponsor’s investment objectives, detailing Sponsor’s anticipated risk and reward characteristics, and establishing a benchmark for future evaluation of actual results; therefore, they are not a predictor, projection, or guarantee of future results. You should not rely on Sponsor’s forward-looking statements as a basis to invest.
Importantly, we do not adopt, endorse, or provide any assurance of returns or as to the accuracy or reasonableness of Sponsor’s Assumptions or forward-looking statements.
No Reliance on Past PerformanceAny description of past performance is not a reliable indicator of future performance and should not be relied upon as the primary basis to invest.
Sponsor’s Use of DebtA substantial portion of the total cost of the real estate asset acquired by the Sponsor with investor funds (“Property”) will be paid with borrowed funds, i.e., debt. Sponsor’s estimated rates and terms of the debt financing are subject to lender approval, and there is no assurance that the Sponsor will secure debt at the rates and terms presented on this Page or in the Sponsor’s Investment Documents, or at all. The use of borrowed money to acquire real estate is referred to as leveraging, which can amplify losses and could result in lender foreclosure. In addition, if the debt includes a variable (or “floating”) interest rate, the total amount of interest paid over the term of the debt will fluctuate and can increase. As a result, Sponsor’s use of debt can result in a loss of some or all of your investment.
Sponsor’s Offering is Not RegisteredSponsor’s securities offering will not be registered under the Securities Act of 1933, as amended (the “Securities Act”), in reliance upon the exemptions from registration pursuant to Rule 506(c) of Regulation D as promulgated under the Securities Act (“Private Placement”). In addition, the offering will not be registered under any state securities laws in reliance on exemptions from state registration. Such securities (your ownership interests) are subject to restrictions on transferability and resale and may not be transferred or resold except as permitted under applicable state and federal securities laws pursuant to registration or an available exemption. All Private Placements on the Platform are intended solely for “Accredited Investors,” as that term is defined in Rule 501(a) under the Securities Act.
No Investment AdviceNothing on this Page should be regarded as investment advice (either with respect to a particular security or regarding an overall investment strategy), a recommendation, an offer to sell, or a solicitation of or an offer to buy any security. Advice from a securities professional is strongly advised to understand and assess the risks associated with real estate or private placement investments. For additional information on RM Securities’ involvement in this offering, please carefully review the Sponsor’s Investment Documents, and RM Securities’ Form CRS, Regulation Best Interest Disclosures, and Limited Brokerage Services Agreement.
1031 Exchange RiskInternal Revenue Code Section 1031 (“Section 1031”) contains complex tax concepts and certain tax consequences may vary depending on the individual circumstances of each investor. RM Securities and its affiliates make no representation or warranty of any kind with respect to the tax consequences of your investment or that the IRS will not challenge any such treatment. You should consult with and rely on your own tax advisor about the tax aspects with respect to your particular circumstances.