The team at our affiliated broker-dealer, RM Securities, conducts diligence on of the issuer, including detailed background checks, criminal checks, bad actor checks, and reference checks on sponsors. In addition to screening for any criminal background, we may also turn down sponsors due to poor reference checks, even if the background and criminal checks are satisfactory.
We require unaffiliated sponsors to use an unaffiliated third-party escrow agent.* When an investor makes an investment with such sponsors using the RealtyMogul platform, the investor’s money is transferred directly into a third-party escrow account. All closing conditions in connection with a sponsor’s contingency offering need to be met before the third-party escrow agent will approve releasing investor funds to the issuer or general partner. For example, if an issuer or general partner plans to use funds for a real estate acquisition that does not ultimately transact, the third-party escrow agent will not transfer investor funds to the issuer or general partner, and funds will be returned to investors.
Unless otherwise disclosed, escrow accounts are not required for some investments that accommodate 1031 investments where the property is already acquired.
Our processes typically includes visiting certain properties (or a subset of properties if it's a fund) to confirm the real estate is what and where the real estate is supposed to be. For certain properties that accommodate 1031 exchange investments, the team will review third-party prepared due diligence reports in lieu of a site visit.
We have formalized processes and checklists for every private placement deal listed on the platform.


Low leverage of 60.5% loan-to-cost and positive leverage with a purchase capitalization rate of 5.02%. Further, the Property closed August 8th, 2022 with secured bank financing at low rate (given the current interest rate environment) of term SOFR + 200bps with a 200bps cap leading to a maximum all-in rate of 4%.
The Property has a strong history of operational performance including rent growth and strong occupancy. There is also significant upside through continuing the renovation program on the remaining 190 unrenovated units where each renovated unit provides an additional $201 in monthly premium. Renovation premiums have led to an increase in rent by roughly 20% and have been proven on previous renovations completed by the seller.

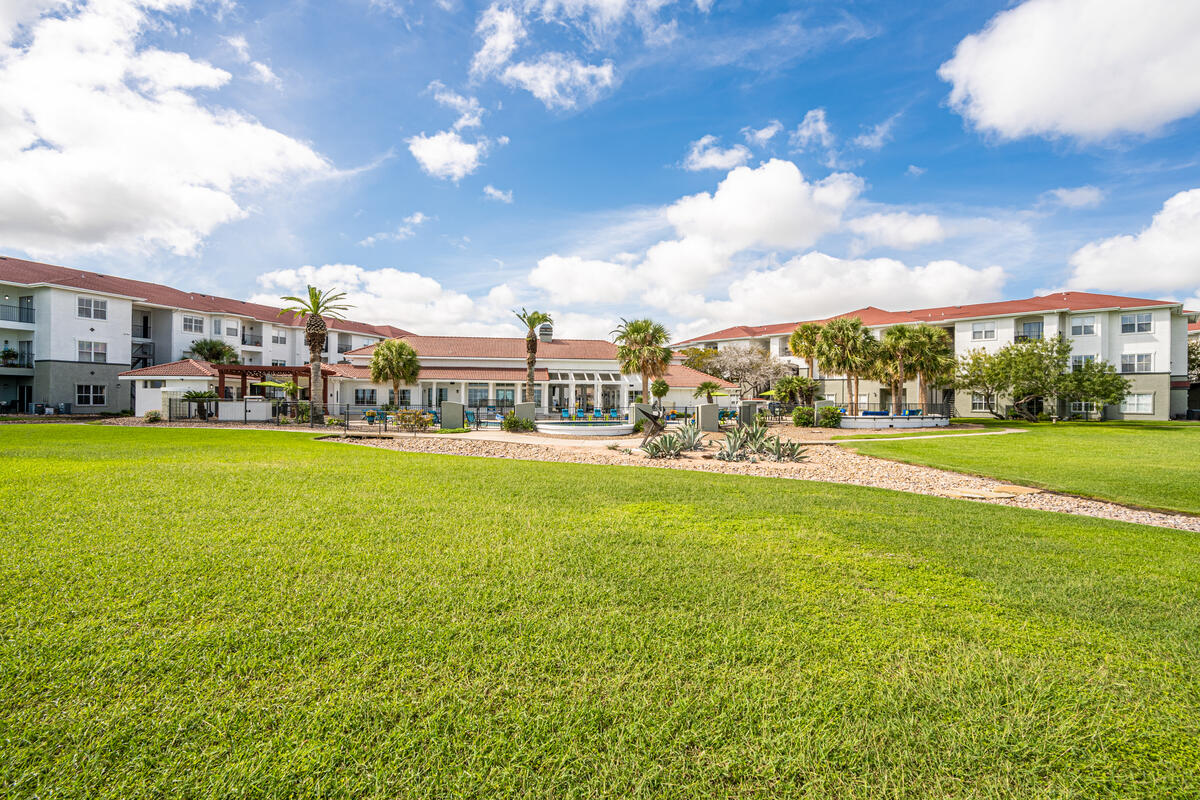
The Property is a unique, waterfront asset with 1,800 feet of direct frontage on Oso Bay. Additionally, the community is low density for the area, with 12 units per acre, and has unique amenities such as a climate-controlled storage facility, boat parking, the largest dog park in the market, bayside sports courts, gym with Peloton bikes and CrossFit equipment, and “Concerts on the Green”.
Pegasus Real Estate
Pegasus Real Estate is a Dallas-based private commercial real estate investment firm primarily focused on the acquisition and repositioning of properties located in major metropolitan markets. Pegasus is led by two senior professionals with a combined +30 years of experience in commercial real estate investments. The firm targets properties with unique attributes in strategic locations with favorable supply/demand fundamentals. Its goal is to achieve attractive, risk-adjusted returns for its investors and partners. The company has acquired over $450 million of assets over its history, with a focus to date on multifamily and industrial investments. It currently has an AUM in excess of $325 million, including a portfolio of multifamily properties in excess of 1,000 units under ownership. The company has achieved strong returns on all of its exited investments to date.
http://pegasusre.com/-
 Justin LaubCo-Founder and Managing Partner
 -
 Jonas LevyCo-Founder and Managing Partner
Justin has invested in, financed, and provided advisory services for over $2 Billion of Commercial Real Estate Projects.
- Previously founded StreetWealth Investments, an investment syndication platform.
- Previously Senior Director at Metropolitan Capital Advisors (MCA), a real estate investment banking firm.
- Prior to MCA, Justin worked at various private equity and investment banking firms including Aviva Investors, Ackman-Ziff and Jones Lang LaSalle (JLL).
- BA from Occidental College and an MS in Real Estate Finance from NYU.
Jonas has invested in, financed, acquired or disposed of over $5 Billion of Commercial Real Estate Projects.
- Previously served as Director of Investments at Silverado Interests, where he focused on the firm's investment opportunities.
- Previously worked at Behringer Harvard in both the multifamily fund and the holding company's capital markets group.
- Additionally, Jonas has worked for JP Morgan and Fidelity Investments.
- BBA in Finance from UNT and an MBA with a concentration in Finance from SMU.
| Property | City, State | Asset Type | Acq Date | Units or SF | Purchase Price | Sale Price | Distributions to Date | IRR Achieved | Multiple on Invested Capital |
| Ashford Apartment Homes | Carrollton, TX | Multi-Family | 4/15/2019 | 265 | $38,750,000 | $69,500,000 | $42,645,485 | 38.92% | 2.55x |
| Summit Park A | Austin, TX | Light Industrial | 1/6/2020 | 53,509 | $8,250,000 | - | $587,204 | ||
| Villas of Arlington (FKA Vineyard at Arlington) | Arlington, TX | Multi-Family | 3/9/2020 | 396 | $32,150,000 | $44,000,000 | $16,204,942 | 44.12% | 1.99x |
| Cornerstone at Overlook (FKA Collection at Overlook) | San Antonio, TX | Multi-Family | 10/9/2020 | 411 | $32,500,000 | - | $1,161,725 | ||
| 2803 NE Loop 410 | San Antonio, TX | Light Industrial | 10/30/2020 | 74,733 | $9,350,000 | - | $732,953 | ||
| Stonegrove Fall Creek | Humble, TX | Multi-Family | 4/29/2021 | 322 | $48,400,000 | $71,967,000 | $33,260,009 | 167.88% | 3.22x |
| Westwood Business Park | Dallas, TX | Light Industrial | 9/15/2021 | 227,894 | $34,100,000 | - | $391,000 | ||
| 4040 Royal and Commerce Center | Dallas, TX | Light Industrial | 12/23/2021 | 271,014 | $41,500,000 | - | $572,000 | ||
| Rienzi at Turtle Creek | Dallas, TX | Multi-Family | 2/25/2022 | 152 | $66,880,000 | - | - | ||
| NOAH Apartments | San Antonio, TX | Multi-Family | 3/10/2022 | 224 | $42,250,000 | - | $162,810 |
The bio and track record were provided by the Sponsor and have not been verified by RealtyMogul
*Please see investment deck for more details
Pegasus Real Estate (PRE), the “Sponsor”, is seeking LP investors for the acquisition of Baypoint Apartments (the “Property”), a 1998 vintage 350-unit luxury waterfront multifamily property prominently located in Corpus Christi, Texas. The Property has direct frontage on Oso Bay, providing unmatched views and a large waterfront greenbelt with resort-style amenities. Previous ownership completed over $6 million of capital projects, including an extraordinary clubhouse renovation that grabs the attention of potential renters. Additionally, there is currently a unit enhancement program in place on 46 percent of the units, thus leaving significant upside for a new investor. The current ownership is achieving on average a $201 premium on the units with quartz counters. Baypoint presents investors with a unique value add opportunity that sets it apart from other Class A product in Corpus with substantial headroom to push rental rates. The Property has recently undergone an extensive renovation to all common area amenities, leaving the new buyer to focus on continuing the interior renovation plan. The capital improvement plan includes $14,000 per unit to renovate 54% of the units which contain classic interiors. Previous ownership recently began signing leases with a monthly $30 amenity fee, versus a one-time $75 fee. The Sponsor plans to continue this, which will translate to a significant increase in other income.
The Sponsor plans to buy and hold the Property, continuing the interior renovation program and improving its operating metrics through diligent expense management and pushing rents to match the growth of the submarket. The Property is currently 94% occupied with in place scheduled rents of $1,402 per month ($1.46/sf). The Sponsor contemplates a 4 year investment period. Bank financing has been secured (eliminating risk of re-trade) requiring interest-only payments over a five-year term at a rate of Term SOFR + 200bps with a 200bps cap.
Baypoint has long held the mantle as the premier bayfront community in Corpus, providing unmatched views and a large waterfront greenbelt. Previous ownership completed over $6 million of capital projects, including an extraordinary clubhouse renovation that grabs the attention of potential renters. Additionally, there is currently a unit enhancement program in place on 46 percent of the units, leaving significant upside for a new investor with proven renovation premiums. The current demographics at the Property have average incomes that can more than support the increased rents from the renovation premium. The Property is being sold because the current owner needs to free up liquidity to expand their hotel portfolio.
| Unit Type | # Units | Avg SF | Total SF | In-Place Rent | Market Rent | % Increase |
| Alameda | 40 | 675 | 27,000 | $1,097 | $1,183 | 7.8% |
| Alameda R | 20 | 675 | 13,500 | $1,175 | $1,272 | 8.3% |
| Bahia | 28 | 822 | 23,016 | $1,279 | $1,309 | 2.3% |
| Bahia R | 26 | 822 | 21,372 | $1,341 | $1,406 | 4.8% |
| Copano | 21 | 909 | 19,089 | $1,323 | $1,365 | 3.2% |
| Copano R | 21 | 909 | 19,089 | $1,359 | $1,438 | 5.8% |
| Laguna | 67 | 928 | 62,176 | $1,307 | $1,489 | 13.9% |
| Laguna R | 27 | 928 | 25,056 | $1,506 | $1,660 | 10.2% |
| Posada | 25 | 1185 | 29,625 | $1,521 | $1,625 | 6.8% |
| Posada R | 27 | 1185 | 31,995 | $1,659 | $1,830 | 10.3% |
| Paloma | 3 | 1383 | 4,149 | $1,657 | $1,872 | 13.0% |
| Paloma R | 21 | 1383 | 29,043 | $1,874 | $2,058 | 9.8% |
| Bella Palmera | 6 | 1385 | 8,310 | $1,693 | $1,885 | 11.3% |
| Bella Palmera R | 18 | 1385 | 24,930 | $1,841 | $2,112 | 14.7% |
| Total/Average | 350 | 967 | 338,350 | $1,402 | $1,536 | 8.7% |
*Units Designated with "R" are recently renovated units.
Lease Comparables
| Lighthouse Pointe | Breakers | The Villas of Ocean Drive | Bay Vista Apartments | Azalia at 7510 | Averages | Subject | |
| Year Built | 2021 | 1996 | 2016 | 2007 | 2020 | 2012 | 1998 |
| Building NRSF | 145,803 SF | 249,984 SF | 174,001 SF | 164,775 SF | 387,136 SF | 224,340 SF | 338,450 SF |
| Rental Rate | $1,765/SF | $1,437/SF | $1,480/SF | $1,518/SF | $1,608/SF | $1,562/SF | $1,479/SF |
| Address | 4933 W Causeway Blvd | 4901 Saratoga Blvd | 4657 Ocean Drive | 522 Hancock Ave | 7510 Wooldridge Rd | 1802 Ennis Joslin Rd | |
| Distance from subject | 12.5 mi | 4.1 mi | 3.4 mi | 7.6 mi | 1.4 mi | 5.8 mi | 0.0 mi |
*Please see investment deck for additional details
Sales Comparables
| Azure | Retreat by Watermark | Encore Crossings | Pearl Point | Cosmopolitan | Averages | Subject (Going-in) | |
| Date Sold | June 22 | June 22 | July 22 | July 22 | December 21 | ||
| Year Built | 1997 | 2017 | 2010 | 2020 | 2018 | 2012 | 1998 |
| NRSF | 192,004 SF | 302,455 SF | 308,507 SF | 195,695 SF | 135,630 SF | 226,858 SF | 338,350 SF |
| Sale Price | $36,500,000 | $60,500,000 | $62,300,000 | $45,000,000 | $31,700,000 | $47,200,000 | $65,500,000 |
| $/SF | $190/SF | $200/SF | $202/SF | $230/SF | $234/SF | $211/SF | $194/SF |
| Address | 7221 S Staples St | 5721 Timergate Dr | 2133 Nodding Pines Dr | 2400 FM 2165 | 2400 FM 2165 | ||
| Distance from subject | 5.9 mi | 5.7 mi | 3.2 mi | 39.8 mi | 9.7 mi | 12.9 mi |
*Please see investment deck for additional details
Market Overview
The Corpus Christi, TX, Metropolitan Statistical Area (MSA) is located on the Gulf Coast approximately 200 miles southwest of Houston and has a population that exceeds 456,800 people. Residents in the Coastal Bend enjoy 113 miles of beach along the Gulf Coast, mild winters, and an average of 233 sunny days per year, well above the national average. Corpus Christi is a family-friendly city with an exceptional quality of life and a cost of living 20% lower than the national average.
Corpus Christi is a high-growth, coastal city with a skilled workforce and strong industrial base. The city has seen a recent surge of Millennials and was recently ranked #14 for Cities Where Millennials are Buying Homes (SmartAsset 2020). Corpus Christi’s strong employment drivers and numerous entertainment and recreational amenities make it a desirable place to live which is proven by strong demand and exceptional multifamily fundamentals.
Submarket Overview
Population
- Approximately 11,265 residents live within a three-mile radius of the Property.
- Population within the TMA has an average age of 34.4 years which is younger than both the city and country's average age.
Household Income
- The median household income within the Total Market Area (TMA) is $73,212 higher than the city and country's median household income.
Renter Demand
- 44% of households within a three-mile radius of the TMA are renter-occupied, outpacing the city's average of 41%.
- Corpus Christi realized a 3.9% growth in rental income through Q2 2021 and market-wide occupancy was 94.6%.
Household Values
- The TMA boasts a median home value that is 36% higher than the city's median home value.


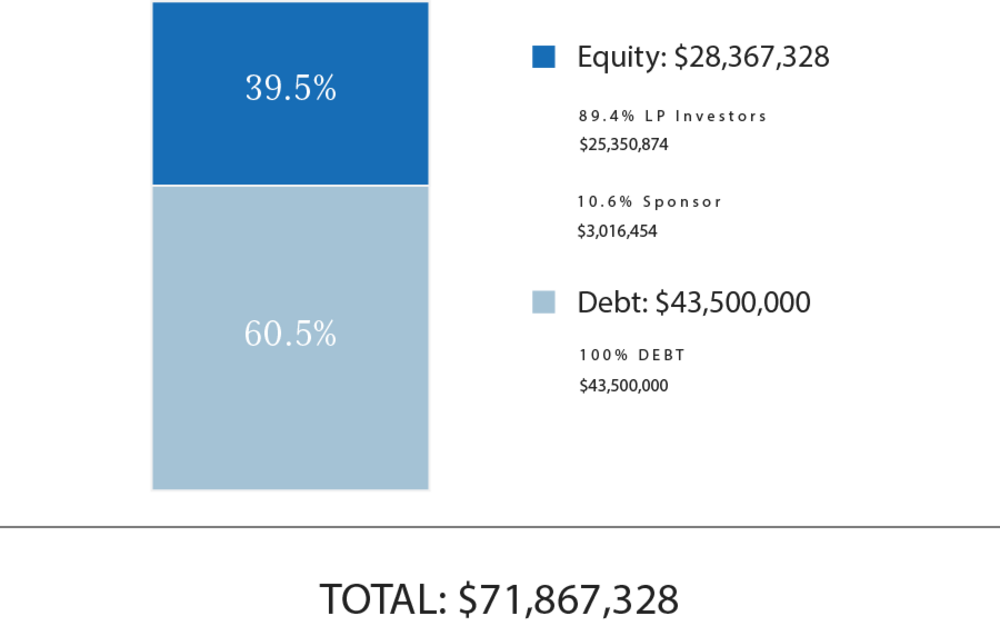
Total Capitalization
| Sources of Funds | $ Amount | $/Unit |
| Debt | $41,000,000 | $117,143 |
| Earn Out | $2,500,000 | $7,143 |
| GP Investor Equity(1) | $3,016,454 | $8,618 |
| LP Investor Equity | $25,350,874 | $72,431 |
| Total Sources of Funds | $71,867,328 | $205,335 |
| Uses of Funds | $ Amount | $/Unit |
| Purchase Price | $65,500,000 | $187,143 |
| Acquisition Fee | $655,000 | $1,871 |
| Financing Costs(2) | $2,069,372 | $5,912 |
| Closing Costs | $256,752 | $734 |
| CapEx | $3,146,028 | $8,989 |
| Working Capital | $52,648 | $150 |
| Insurance Premium | $187,529 | $536 |
| Total Uses of Funds | $71,867,328 | $205,335 |
(1) The Sponsor’s equity contribution may consist of friends and family equity and equity from funds controlled by the Sponsor.
(2) Includes purchase of Interest Rate Cap ($1.6 Million)
The expected terms of the debt financing are as follows:
- Lender: Bank of Hope
- Term: 5 Years
- Loan-to-Cost: Initially 57% with Earnout 60.5%
- Loan-to-Value: Initially 62.6% with Earnout 66.4%
- Estimated Proceeds: $43,500,000 ($41,000,000 + $2,500,000 Earnout)
- Interest Type: Floating
- Spread Above SOFR: 2.00% with 200bps cap
- Interest-Only Period: Full term
- Amortization: N/A
- Prepayment Terms: 3-2-1-0-0
- Extension Requirements: N/A
A substantial portion of the total acquisition for the Property will be paid with borrowed funds, i.e., debt. Please carefully review the Disclaimers section below for additional information concerning the Sponsors use of debt.
Pegasus Real Estate intends to make distributions as follows:
- To the Investors, pari passu, all operating cash flows to an 8.0% Preferred Return;
- Return of Capital to all Partners;
- 70% / 30% (70% to Investors / 30% to Promoted/Carried Interest) of excess cash flow thereafter.
Pegasus Real Estate intends to make distributions to investors after the payment of the company's liabilities (loan payments, operating expenses, and other fees as more specifically set forth in the LLC agreements, in addition to any member loans or returns due on member loan).
Distributions are expected to start in February 2023 and are projected to continue on a quarterly basis thereafter. Distributions are at the discretion of Pegasus Real Estate, who may decide to delay distributions for any reason, including maintenance or capital reserves.
Pegasus Real Estate will receive a promoted/carried interest as indicated above.
| Cash Flow Summary | |||||
| Year 1 | Year 2 | Year 3 | Year 4 | ||
| Effective Gross Revenue | $6,962,666 | $7,479,883 | $8,047,011 | $8,307,327 | |
| Total Operating Expenses | $3,126,705 | $3,226,673 | $3,322,635 | $3,414,788 | |
| Net Operating Income | $3,835,961 | $4,253,210 | $4,724,376 | $4,892,539 | |
| Project-Level Cash Flows | |||||
| Year 0 | Year 1 | Year 2 | Year 3 | Year 4 | |
| Net Cash Flow | ($28,367,328) | $1,428,834 | $3,093,559 | $2,581,406 | $54,696,966 |
| Investor-Level Cash Flows(1) | |||||
| Year 0 | Year 1 | Year 2 | Year 3 | Year 4 | |
| Net Cash Flow | ($4,000,000) | $161,476 | $396,214 | $323,997 | $6,644,741 |
| Investor-Level Cash Flows - Hypothetical $50,000 Investment(1) | |||||
| Year 0 | Year 1 | Year 2 | Year 3 | Year 4 | |
| Net Cash Flow | ($50,000) | $2,018 | $4,953 | $4,050 | $83,059 |
(1) RM Technologies, LLC and its affiliates do not provide any assurance of returns. Returns presented are net of all fees. Please carefully review the Fees and Disclaimers sections below for additional information concerning Sponsor’s use or projected returns and fees paid to Sponsor and RM Technologies, LLC.
Certain fees and compensation will be paid over the life of the transaction; please refer to Pegasus Real Estate's materials for details. The following fees and compensation will be paid(1)(2)(3)(4):
| One-Time Fees: | |||
| Type of Fee | Amount of Fee | Received By | Paid From |
| Acquisition Fee | 1.0% of Purchase Price | Pegasus Real Estate | Closing |
| Construction Oversight Fee | 5.0% of Renovation Budget | Pegasus Real Estate | Cash Flow |
| Technology Solution Licensing Fee(1) | Flat one-time licensing fees of $15,000 plus $1,500 per each prospective investor onboarded by Sponsor through its license and use of RM Technologies’ Technology Solution | RM Technologies, LLC |
Capitalization (at Sponsor’s discretion) |
| Recurring Fees: | |||
| Type of Fee | Amount of Fee | Received By | Paid From |
| Asset Management Fee | 1.0% of Gross Receipts | Pegasus Real Estate | Cash Flow |
| Property Management Fee | 2.0% of Gross Receipts | Third Party | Cash Flow |
| Administration Solution Licensing Fee(1) | Flat quarterly licensing fee of $125 per investor serviced by Sponsor through the license and use of RM Technologies’ Administration Solution | RM Technologies, LLC | Cash Flow |
(1) Please see the Fees and Disclaimers sections below for additional information concerning fees paid to RM Technologies, LLC.
(2) Fees may be deferred to reduce impact to investor distributions.
.
RM Securities, LLC, its registered representatives, affiliates, associated persons, and personnel of its affiliates who may also be associated with it, including our associated persons and personnel of our affiliates who are also be associated with RM Securities, LLC (it (“RM Securities,” “we,” “our,” or “us”) will receive fees, expense reimbursements, and other compensation (“Fees”) from the issuer of this investment offering, its sponsor, or an affiliate thereof (“Sponsor”), or otherwise in connection with Sponsor’s offering. The Fees paid to us are in addition to other fees you will pay to Sponsor or in connection with Sponsor’s investment offering. You will pay Fees to Sponsor, either directly or indirectly as an investor in the Sponsor’s offering. Sponsor will use the Fees you pay, as well as funds you invest in the relevant offering, to compensate us. The Fees paid to us will directly or indirectly be borne by you as the investor (typically, but not always, in the form of an expense of the Sponsor’s offering in which you invest) because such Fees will reduce the proceeds available for distribution to you and reduce the amount you earn over time.
For more information on the Fees paid to us, or any other Fees you will pay in connection with Sponsor’s offering, please carefully review the Sponsor’s Investment Documents. Please also carefully review RM Securities’ Form CRS, Regulation Best Interest Disclosures, and Limited Brokerage Services Agreement.
No Approval, Opinion or Representation, or Warranty by RM Securities, LLCSponsor has provided, approved, and is solely responsible in all aspects for the information on this webpage (“Page”), including Sponsor’s offering documentation, which may include without limitation the Private Placement Memorandum, Operating or Limited Partnership Agreement, Subscription Agreement, the Project Summary and all exhibits and other documents attached thereto or referenced therein (collectively, the “Investment Documents”). The Investment Documents linked on this page have been prepared and posted by Sponsor, and not by RM Securities. We did not assist in preparing, do not adopt or endorse, and we are not otherwise responsible for, the Sponsor’s Investment Documents. We make no representations or warranties as to the accuracy of information on this Page or in the Sponsor’s Investment Documents and we accept no liability therefor. No part of the information on this Page or in the Sponsor’s Investment Documents is intended to be binding on us.
Sponsor’s Information Qualified by Investment DocumentsThe information on this Page is qualified in its entirety by reference to the more complete information about the offering contained in the Sponsor’s Investment Documents. The information on this Page is not complete and subject to change at the Sponsor’s discretion at any time up to the closing date. The Sponsor’s Investment Documents and supplements thereto contain important information about the Sponsor’s offering including relevant investment objectives, the business plan, risks, charges, expenses, and other information, which you should consider carefully before investing. The information on this Page should not be used as a basis for an investor’s decision to invest.
Risk of InvestmentThis investment is speculative, highly illiquid, and involves substantial risk. There can be no assurances that all or any of Sponsor’s assumptions, expectations, estimates, goals, hypothetical illustrations, or other aspects of Sponsor’s business plans (“Assumptions”) will be true or that actual performance will bear any relation to Sponsor’s Assumptions, and no guarantee or representation is made that Sponsor’s Assumptions will be achieved. If Sponsor does not achieve its Assumptions, your investment could be materially and adversely affected. A loss of part or all of the principal value of your investment may occur. You should not invest unless you can readily bear the consequences of such loss. Sponsor’s Assumptions should not be relied upon as the primary basis for your decision to invest.
No Reliance on Forward-Looking Statements; Sponsor AssumptionsSponsor is solely responsible for statements made concerning forward-looking statements and Assumptions, which apply only as of the date made, are preliminary and subject to change, and are expressly qualified in their entirety by the disclosures and cautionary statements included in Sponsor’s Investment Documents, which you should carefully review. Neither RM Securities nor Sponsor are obligated to update or revise such forward-looking statements or Assumptions to reflect events or circumstances that arise after the date made or to reflect the occurrence of unanticipated events. Sponsor’s forward-looking statements and Assumptions are hypothetical, not based on actual investment achievements or events, and are presented solely for purposes of providing insight into the Sponsor’s investment objectives, detailing Sponsor’s anticipated risk and reward characteristics, and establishing a benchmark for future evaluation of actual results; therefore, they are not a predictor, projection, or guarantee of future results. You should not rely on Sponsor’s forward-looking statements as a basis to invest.
Importantly, we do not adopt, endorse, or provide any assurance of returns or as to the accuracy or reasonableness of Sponsor’s Assumptions or forward-looking statements.
No Reliance on Past PerformanceAny description of past performance is not a reliable indicator of future performance and should not be relied upon as the primary basis to invest.
Sponsor’s Use of DebtA substantial portion of the total cost of the real estate asset acquired by the Sponsor with investor funds (“Property”) will be paid with borrowed funds, i.e., debt. Sponsor’s estimated rates and terms of the debt financing are subject to lender approval, and there is no assurance that the Sponsor will secure debt at the rates and terms presented on this Page or in the Sponsor’s Investment Documents, or at all. The use of borrowed money to acquire real estate is referred to as leveraging, which can amplify losses and could result in lender foreclosure. In addition, if the debt includes a variable (or “floating”) interest rate, the total amount of interest paid over the term of the debt will fluctuate and can increase. As a result, Sponsor’s use of debt can result in a loss of some or all of your investment.
Sponsor’s Offering is Not RegisteredSponsor’s securities offering will not be registered under the Securities Act of 1933, as amended (the “Securities Act”), in reliance upon the exemptions from registration pursuant to Rule 506(c) of Regulation D as promulgated under the Securities Act (“Private Placement”). In addition, the offering will not be registered under any state securities laws in reliance on exemptions from state registration. Such securities (your ownership interests) are subject to restrictions on transferability and resale and may not be transferred or resold except as permitted under applicable state and federal securities laws pursuant to registration or an available exemption. All Private Placements on the Platform are intended solely for “Accredited Investors,” as that term is defined in Rule 501(a) under the Securities Act.
No Investment AdviceNothing on this Page should be regarded as investment advice (either with respect to a particular security or regarding an overall investment strategy), a recommendation, an offer to sell, or a solicitation of or an offer to buy any security. Advice from a securities professional is strongly advised to understand and assess the risks associated with real estate or private placement investments. For additional information on RM Securities’ involvement in this offering, please carefully review the Sponsor’s Investment Documents, and RM Securities’ Form CRS, Regulation Best Interest Disclosures, and Limited Brokerage Services Agreement.
1031 Exchange RiskInternal Revenue Code Section 1031 (“Section 1031”) contains complex tax concepts and certain tax consequences may vary depending on the individual circumstances of each investor. RM Securities and its affiliates make no representation or warranty of any kind with respect to the tax consequences of your investment or that the IRS will not challenge any such treatment. You should consult with and rely on your own tax advisor about the tax aspects with respect to your particular circumstances.