The team at our affiliated broker-dealer, RM Securities, conducts diligence on of the issuer, including detailed background checks, criminal checks, bad actor checks, and reference checks on sponsors. In addition to screening for any criminal background, we may also turn down sponsors due to poor reference checks, even if the background and criminal checks are satisfactory.
We require unaffiliated sponsors to use an unaffiliated third-party escrow agent.* When an investor makes an investment with such sponsors using the RealtyMogul platform, the investor’s money is transferred directly into a third-party escrow account. All closing conditions in connection with a sponsor’s contingency offering need to be met before the third-party escrow agent will approve releasing investor funds to the issuer or general partner. For example, if an issuer or general partner plans to use funds for a real estate acquisition that does not ultimately transact, the third-party escrow agent will not transfer investor funds to the issuer or general partner, and funds will be returned to investors.
* Unless otherwise disclosed, escrow accounts are not required for some investments that accommodate 1031 investments where the property is already acquired.
Our processes typically includes visiting certain properties (or a subset of properties if it's a fund) to confirm the real estate is what and where the real estate is supposed to be. For certain properties that accommodate 1031 exchange investments, the team will review third-party prepared due diligence reports in lieu of a site visit.
We have formalized processes and checklists for every private placement deal listed on the platform.


Per CoStar, the Portland-Vancouver-Hillsboro MSA has recorded cumulative rent growth of 50.3% over the last ten years, compared to 43.2% nationally. The Vancouver submarket has exceeded that mark with rent growth of 61.4% over the same period. Additionally, since 2010, vacancy in the Vancouver submarket has averaged 4.6% and has consistently been below the national average of 6.1%. Lastly, there is no state income tax in Washington, which will continue to attract and retain residents.

Fairview Court Townhomes is centrally located in Vancouver and situated between two major highways, providing convenient connectivity to employment centers throughout Vancouver and the entire Portland MSA. The Property offers proximity to outstanding outdoor recreation, an active downtown area, a revitalized waterfront and various historical attractions. Vancouver residents enjoy the Portland metro area’s urban and cultural amenities, a low crime rate, lower cost of living and easy access to the Columbia River.

Fairview Court Townhomes offers a desirable unit mix comprised of 97% townhomes. Built in 2015, all units have in-unit washers and dryers and 90 of the 93 units feature two-level floorplans, direct access garages, and fenced-in yards. With an average unit size of 1,039, renters at Fairview Court Townhomes have over 16% more living space on average when compared to market rate multifamily properties with 10+ units located in Vancouver, WA. (CoStar)
RM Communities
RM Communities is the direct acquisition arm of RealtyMogul, which, through its subsidiary, operates an online technology platform which has been utilized by its members to invest in affiliated and unaffiliated real estate companies that have acquired approximately $5.5 billion of real estate assets, including historical investments in over 26,000 apartment units.
-
 Jilliene HelmanChief Executive Officer
 -
 Todd HansonManaging Director
 -
 Derek JensenDirector of Acquisitions, West
 -
 Zach KarrDirector of Acquisitions, Mountain Region and Texas
| Property Name | Location | Multifamily Class | No. of Units | Year Built | Purchase Price | CapEx Budget | Status |
| Terrace Hill | El Paso, TX | B | 310 | 1983 | $18,700,000 | $4,095,000 | Full Cycle. 22% deal-level IRR, 18% LP-level IRR* |
| La Privada | El Paso, TX | B | 240 | 1982 | $11,700,000 | $1,867,000 | Closed |
| The Hamptons | Virginia Beach, VA | B | 212 | 1973 | $19,051,000 | $3,792,000 | Closed |
| Pohlig Box Factory & Superior Warehouse | Richmond, VA | A- | 93 & 7,700 Retail SF | 2004 | $15,900,000 | $1,348,000 | Closed |
| Lubbock Medical Office Building | Lubbock, TX | B | 20,880 SF | 1966 | $8,350,000 | $0 | Closed |
| Turtle Creek | Fenton, MO | A- | 128 | 2018 | $24,875,000 | $596,000 | Closed |
| The Orion | Orion Township, MI | B+ | 200 | 1995 | $27,375,000 | $2,308,000 | Closed |
| Kings Landing | Creve Coeur, MO | A- | 152 & 9,229 Retail SF | 2005 | $40,100,000 | $3,885,850 | Closed |
| Minnehaha Meadows | Vancouver, WA | A | 49 | 2021 | $16,450,000 | $83,950 | Closed |
| Roosevelt Commons | Vancouver, WA | A | 36 | 2020 | $12,550,000 | $78,200 | Closed |
| Bentley Apartments | Grove City, OH | A- | 138 | 2020 | $30,200,000 | $650,000 | Closed |
| Sherwood Oaks | Riverview, FL | B | 199 | 1984 | $35,000,000 | $1,266,725 | Closed |
| Haverford Place | Georgetown, KY | A- | 160 | 2001 | $31,050,000 | $2,836,734 | Closed |
| Edison Apartments | Gresham, OR | A | 64 | 2020 | $19,500,000 | $203,390 | Closed |
| Total | 1,981 | $310,801,000 | $23,010,849 |
The acquisitions of the Terrace Hill Apartments, La Privada, The Hamptons, and Pohlig Box Factory & Superior Warehouse properties preceded the formation of the RM Communities, LLC. Consequently, these real estate assets are managed by an affiliate of RM Communities, LLC. They are included as part of the RM Communities, LLC portfolio because these real estate assets were acquired and are managed under the same executive leadership in Jilliene Helman and according to the same investment strategy employed by RM Communities, LLC.
Note: Totals include Terrace Hill (sold).
*Past performance is not indicative of future performance.
In today’s environment, RM Communities is focusing on strong locations and newer product. Fairview Court Townhomes represents such an opportunity. The Property’s current owner has not moved rents to market and there is an opportunity to increase rents further through a renovation program. RM Communities will spend approximately $11,900 per unit to refresh all units with quartz countertops, backsplashes, new fixtures, upgraded lighting, new paint, painted garages and new carpet. Further, RM Communities will spend $3,600 per unit for exterior and common area upgrades, such as expanding the common gazebo area, creating an additional gazebo area with fire pit, upgrading the dog park, adding package lockers, and curing deferred maintenance. The improvements are projected to achieve a renovation premium of approximately $600/unit per month over in-place rents, consistent with comparable rental rates in the market.
RM Communities plans to finance the acquisition of the Property with a three-year, floating-rate loan with two one-year extension options. Terms include three years of interest-only payments at an estimated 69.8% loan-to-cost and 3.90% spread over 1-month SOFR. The business plan is to exit in three years at a projected 4.50% cap rate.
Capital Improvement Budget
| Summary | Total | Per Unit | |
| Interior Upgrades | $1,105,770 | $11,890 | |
| Exterior And Common Area | $332,173 | $3,572 | |
| Construction Mgmt. Fee (5%) | $71,897 | $773 | |
| Contingency (10%) | $143,794 | $1,546 | |
| Total | $1,653,634 | $17,781 | |
| Interior Upgrades | Total | Per Unit | # of Units |
| Countertops | $525,450 | $5,650 | 93 |
| Appliances | $219,852 | $2,364 | 93 |
| Flooring | $106,950 | $1,150 | 93 |
| Plumbing Fixtures | $83,886 | $902 | 93 |
| Paint | $55,800 | $600 | 93 |
| Backsplashes | $51,150 | $550 | 93 |
| Paint Garage | $46,500 | $500 | 93 |
| Lighting | $13,020 | $140 | 93 |
| Usb Outlets | $3,162 | $34 | 93 |
| Total | $1,105,770 | $11,890 | - |
| Exterior And Common Area Upgrades And Repairs |
Total | Per Unit | |
| Amenity Space-Fire Pit | $60,000 | $645 | |
| Package Lockers | $35,000 | $376 | |
| Fencing - Stain | $35,000 | $376 | |
| Parking Lot | $26,715 | $287 | |
| Amenity Space-Bbq | $21,500 | $231 | |
| Dog Park | $14,875 | $160 | |
| Other | $139,083 | $1,496 | |
| Subtotal | $332,173 | $3,572 |
Built in 2015, Fairview Court Townhomes (the “Property”) provides 90 modern townhomes that include two-level floorplans, direct access garages, electric fireplaces, and fenced-in back yards. The remaining three units are comprised of two one-bedrooms and a studio. All units have washers and dryers, and the Property features a clubhouse with common room and fitness center, and a dog park. Adjacent to Interstate 205, the Property offers convenient access to Portland, downtown Vancouver and the Vancouver Waterfront, and is located proximate to 5.2 million square feet of retail and grocers. The Property is primed for a unit interior and common area value-add improvement plan to achieve rental income upside.
Unit Mix
| Type | # of Units | Unit SF | Total SF | In-Place Rent | Stabilized Rent | Rent / SF |
| 0/1 | 1 | 392 | 392 | $1,010 | $1,300 | $3.32 |
| 1/1 | 2 | 559 | 1,118 | $1,010 | $1,550 | $2.77 |
| 2/2.5 | 58 | 985 | 57,130 | $1,547 | $2,175 | $2.21 |
| 3/2.5 | 32 | 1,187 | 37,988 | $1,735 | $2,325 | $1.96 |
| Total/Average | 93 | 1,039 | 96,628 | $1,594 | $2,204 | $2.12 |
Lease Comparables
2 Bedroom / 2.5 Bathroom
| Property | SF | Stabilized Rent | PSF | YOC |
| Fairview Court Townhomes | 985 | $2,175 | $2.21 | 2015 |
| Larkspur | 1,215 | $2,138 | $1.76 | 1995 |
| Avana One Zero Nine | 932 | $1,897 | $2.04 | 1994 |
| Villas at 28th | 976 | $2,195 | $2.25 | 2021 |
| Acero Haagen Park | 1,023 | $2,155 | $2.11 | 2021 |
| Comp Average | 1,037 | $2,096 | $2.02 |
3 Bedroom / 2.5 Bathroom
| Property | SF | Stabilized Rent | PSF | YOC |
| Fairview Court Townhomes | 1,187 | $2,325 | $1.96 | 2015 |
| Larkspur | 1,507 | $2,149 | $1.43 | 1995 |
| Avana One Zero Nine | 1,148 | $2,335 | $2.03 | 1994 |
| Acero Haagen Park | 1,309 | $2,180 | $1.67 | 2021 |
| Minnehaha Meadows(1) | 1,288 | $2,199 | $1.71 | 2021 |
| Comp Average | 1,313 | $2,216 | $1.69 |
Sales Comparables
| Property Name | Submarket Name | Property Address | City | Sale Date | Sale Price | Number Of Units | Gross Building Sf | Price Per Unit | Price Per Sf | Year Built | Building Class |
| Fairview Court Townhomes | Vancouver | 4000 NE 109th Ave | Vancouver | - | $29,700,000 | 93 | 124,861.00 | $319,355 | $238 | 2015 | A- |
| Passage Apartments | Vancouver | 12800 SE 7th St | Vancouver | 5/13/2022 | $32,850,000 | 104 | 108,264.00 | $315,865 | $303 | 1991 | B |
| Union Park Apartments | Vancouver | 11803 NE 124th Ave | Vancouver | 11/18/2021 | $34,500,000 | 120 | 109,000.00 | $287,500 | $317 | 2017 | A |
| Minnehaha Meadows(1) | Vancouver | 6000 NE 64th St | Vancouver | 9/21/2021 | $16,450,000 | 49 | 63,112.00 | $335,714 | $261 | 2020 | A |
| Roosevelt Commons(1) | Vancouver | 2812 Falk Rd | Vancouver | 9/21/2021 | $12,550,000 | 36 | 52,430.00 | $348,611 | $239 | 2020 | A |
(1) Minnehaha Meadows and Roosevelt Commons are properties owned by an affiliate of RM Communities.
Location: Vancouver, Washington
As the largest suburb in the Portland metro, Vancouver is known for strong employment, great schools, no income taxes, and an abundance of retail, recreation, and transportation options. Vancouver has seen significant investment in much of the City’s business and infrastructure, attracting a host of premier technology, healthcare, and financial services firms.
The Property is centrally located between I-205 and WA-500, two major transportation highways providing convenient connectivity to employment centers throughout Vancouver and the Portland MSA. Nearby attractions include the Vancouver Plaza, Vancouver Mall, Orchards Market Center, Royal Oaks County Club, PeaceHealth Medical Center, and the Columbia Tech Center. Combined, the Property is in close proximity to over 5.2 million square feet of retail.
The City of Vancouver and its economic development partners are building the foundation to grow jobs, businesses, tourism, recreation and transportation. Columbia Waterfront, LLC a private investors group led by Gramor Development, worked closely with the City, the Port of Vancouver and local residents to create a master plan for downtown waterfront development. The 32-acre project will create 3,300 residential units, approximately one million square feet of office space and 250,000 square feet of retail and restaurant space. Additionally, a 7.3-acre community park will incorporate public open spaces with the Columbia River edge, and the Columbia River Renaissance Trail will connect Vancouver Waterfront Park to Wintler Park, over five miles away. In total, the development is forecast to create more than 10,000 jobs.
Phase 1 and most of Phase 2 of the development have been completed, including over 62,000 of office space, 71,000 square feet of retail and restaurant space, and approximately 520 residential units. Per Columbia Waterfront, LLC, the remainder of Phase 2, comprised of two hotels, 440 residential units, and additional restaurant, retail and office space, is on track to open in 2023.
Submarket Overview: Vancouver
According to CoStar, the Vancouver submarket vacancy is currently 3.7%, compared to 4.9% nationally, and has consistently been below the national average vacancy rate since 2010. Additionally, vacancy in the submarket is forecast to not exceed 4.0% through 2027, as Vancouver residents will continue to benefit from Washington’s lack of state income tax and access to Portland.
Per CoStar, investors and developers continue to contend with an increasingly burdensome regulatory environment across the river in the City of Portland and Oregon, including capped rent growth, inclusionary zoning, compliance with the Urban Growth Boundary, and sizable relocation payments for displaced tenants among the increasingly onerous regulations. This has attracted investors and developers to Vancouver, causing new development activity above historical averages. Despite the increase in supply, the Vancouver submarket has seen steady absorption and nearly double-digit rent growth on a year-over-year basis the past few quarters. In addition, multifamily demand is forecast to keep pace with future supply.
Market Overview: Portland-Vancouver-Hillsboro MSA
Per Oxford Economics, there are over 2.5 million people in the Portland-Vancouver-Hillsboro MSA (the “MSA”). Over the past ten years, the MSA’s population has increased 1.0%, compared to 0.6% nationally. This trend is expected to continue over the next five years as the MSA’s population is expected to increase by 0.9%, compared to 0.5% nationally. The MSA’s median household income is $88,240, which is over 20% more than the national median. Unemployment in the MSA is currently 3.4%, which is 40 basis points lower than the national rate.
Portland's reputation for a high quality of life and affordability is driving in-migration figures. Of the 11 markets on the West Coast with at least one million residents, only Fresno, California, has lower average apartment rents than Portland. Average apartment rents rose by 8.9% over the past year, compared with the three-year average of 4.4%. Suburban communities led the way in this category, as tenants remain in neighborhoods that offered more space and affordability during peak pandemic months.


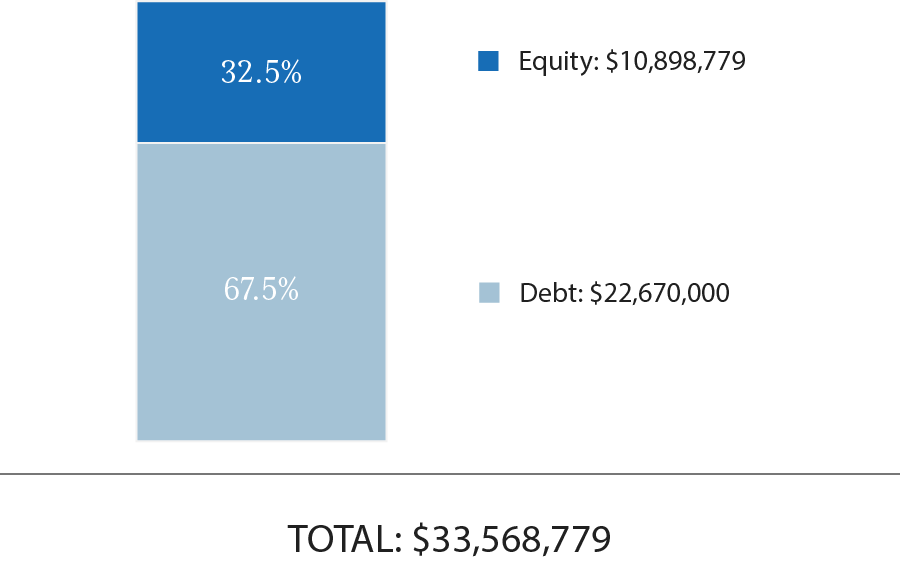
Total Capitalization
| Sources | Amount | $/Unit | % |
| Senior Loan | $22,670,000 | $243,763 | 67.5% |
| LP Investor Equity | $10,898,779 | $117,191 | 32.5% |
| Total | $33,568,779 | $360,955 | 100.0% |
| Uses | Amount | $/Unit | % |
| Purchase Price | $29,700,000 | $319,355 | 88.5% |
| Loan Fee | $226,700 | $2,438 | 0.7% |
| Closing Costs | $920,000 | $9,892 | 2.7% |
| Capex Budget | $1,653,634 | $17,781 | 4.9% |
| Acquisition Fee | $594,000 | $6,387 | 1.8% |
| Taxes And Insurance | $148,833 | $1,600 | 0.4% |
| Working Capital | $150,000 | $1,613 | 0.4% |
| Interest & Cf Reserve | $175,611 | $1,888 | 0.5% |
| Total | $33,568,779 | $360,955 | 100.0% |
The expected terms of the debt financing are as follows:
- Loan Type: Floating
- Lender: Argentic
- Total Loan Amount: $22,670,000
- Loan Term: 3 Years
- Interest Rate: 1-Month Term SOFR + 3.90%
- Interest-Only Period: 3 Years
- Initial Loan-to-Value: 70.8%
- Loan-to-Cost: 69.8%
- Extension Options: Two, 12-month options
- Term SOFR Cap: 2.25%
(1) A substantial portion of the total acquisition for the Property will be paid with borrowed funds, i.e., debt. Please carefully review the Disclaimers section below for additional information concerning the Sponsors use of debt.
RM Communities intends to make distributions from Fairview Court Investors, LLC as follows:
Operating Cash Flow:
- To the Investors, pari passu, all operating cash flows to an 8.0% preferred return;
- 70% / 30% (70% to Investors / 30% to Promote) of excess cash flow to a 16% IRR;
- 50% / 50% (50% to Investors / 50% to Promote) of excess cash flow thereafter.
Capital Event:
- To the Investors, pari passu, all operating cash flows to an 8.0% preferred return;
- Return of Capital to Members
- 70% / 30% (70% to Investors / 30% to Promote) of excess cash flow to a 16% IRR;
- 50% / 50% (50% to Investors / 50% to Promote) of excess cash flow thereafter.
RM Communities intends to make distributions to investors after the payment of the company's liabilities (loan payments, operating expenses, and other fees as more specifically set forth in the LLC agreements, in addition to any member loans or returns due on member loan).
Distributions are expected to start in February 2023 and are projected to continue on a quarterly basis thereafter. Distributions are at the discretion of RM Communities, who may decide to delay distributions for any reason, including maintenance or capital reserves.
| Projected Cash Flow Summary | ||||
| Year 1 | Year 2 | Year 3 | ||
| Effective Gross Income (EGI) | $2,000,173 | $2,455,398 | $2,636,054 | |
| Expenses | $632,720 | $690,898 | $716,495 | |
| Net Operating Income | $1,367,453 | $1,764,500 | $1,919,559 | |
| Total Property Cash Flow | $69,526 | $356,254 | $18,116,176 | |
| Projected Investor Cash Flow(1) | ||||
| Year 0 | Year 1 | Year 2 | Year 3 | |
| Investor-Level Cash Flows - Hypothetical $50,000 Investment(2) | ($50,000) | $298 | $1,614 | $75,896 |
(1) RM Technologies, LLC does not provide any assurance of returns. Please carefully review the Disclaimers sections below for additional information concerning Sponsor’s use or projected returns.
(2) Projected returns are net of all fees.
Certain fees and compensation will be paid over the life of the transaction; please refer to RM Communities' materials for details. The following fees and compensation will be paid(1):
| One-Time Fees | ||
| Type of Fee | Amount of Fee | Received By |
| Acquisition Fee | 2.0% of Purchase Price | RM Communities |
| Construction Management Fee | 5.0% of Capital Improvement Expenditures | Cushman & Wakefield, Third Party Property Manager |
| Recurring Fees | ||
| Type of Fee | Amount of Fee | Received By |
| Asset Management Fee | 1.5% of Effective Gross Income (EGI) | RM Communities |
| Property Management Fee | Greater of (i) 3.0% of collected rental income, and (ii) $5,500/mo. | Cushman & Wakefield, Third Party Property Manager |
(1) Fees may be deferred to reduce impact to investor distributions.
RM Securities, LLC, its registered representatives, affiliates, associated persons, and personnel of its affiliates who may also be associated with it, including our associated persons and personnel of our affiliates who are also be associated with RM Securities, LLC (it (“RM Securities,” “we,” “our,” or “us”) will receive fees, expense reimbursements, and other compensation (“Fees”) from the issuer of this investment offering, its sponsor, or an affiliate thereof (“Sponsor”), or otherwise in connection with Sponsor’s offering. The Fees paid to us are in addition to other fees you will pay to Sponsor or in connection with Sponsor’s investment offering. You will pay Fees to Sponsor, either directly or indirectly as an investor in the Sponsor’s offering. Sponsor will use the Fees you pay, as well as funds you invest in the relevant offering, to compensate us. The Fees paid to us will directly or indirectly be borne by you as the investor (typically, but not always, in the form of an expense of the Sponsor’s offering in which you invest) because such Fees will reduce the proceeds available for distribution to you and reduce the amount you earn over time.
For more information on the Fees paid to us, or any other Fees you will pay in connection with Sponsor’s offering, please carefully review the Sponsor’s Investment Documents. Please also carefully review RM Securities’ Form CRS, Regulation Best Interest Disclosures, and Limited Brokerage Services Agreement.
No Approval, Opinion or Representation, or Warranty by RM Securities, LLCSponsor has provided, approved, and is solely responsible in all aspects for the information on this webpage (“Page”), including Sponsor’s offering documentation, which may include without limitation the Private Placement Memorandum, Operating or Limited Partnership Agreement, Subscription Agreement, the Project Summary and all exhibits and other documents attached thereto or referenced therein (collectively, the “Investment Documents”). The Investment Documents linked on this page have been prepared and posted by Sponsor, and not by RM Securities. We did not assist in preparing, do not adopt or endorse, and we are not otherwise responsible for, the Sponsor’s Investment Documents. We make no representations or warranties as to the accuracy of information on this Page or in the Sponsor’s Investment Documents and we accept no liability therefor. No part of the information on this Page or in the Sponsor’s Investment Documents is intended to be binding on us.
Sponsor’s Information Qualified by Investment DocumentsThe information on this Page is qualified in its entirety by reference to the more complete information about the offering contained in the Sponsor’s Investment Documents. The information on this Page is not complete and subject to change at the Sponsor’s discretion at any time up to the closing date. The Sponsor’s Investment Documents and supplements thereto contain important information about the Sponsor’s offering including relevant investment objectives, the business plan, risks, charges, expenses, and other information, which you should consider carefully before investing. The information on this Page should not be used as a basis for an investor’s decision to invest.
Risk of InvestmentThis investment is speculative, highly illiquid, and involves substantial risk. There can be no assurances that all or any of Sponsor’s assumptions, expectations, estimates, goals, hypothetical illustrations, or other aspects of Sponsor’s business plans (“Assumptions”) will be true or that actual performance will bear any relation to Sponsor’s Assumptions, and no guarantee or representation is made that Sponsor’s Assumptions will be achieved. If Sponsor does not achieve its Assumptions, your investment could be materially and adversely affected. A loss of part or all of the principal value of your investment may occur. You should not invest unless you can readily bear the consequences of such loss. Sponsor’s Assumptions should not be relied upon as the primary basis for your decision to invest.
No Reliance on Forward-Looking Statements; Sponsor AssumptionsSponsor is solely responsible for statements made concerning forward-looking statements and Assumptions, which apply only as of the date made, are preliminary and subject to change, and are expressly qualified in their entirety by the disclosures and cautionary statements included in Sponsor’s Investment Documents, which you should carefully review. Neither RM Securities nor Sponsor are obligated to update or revise such forward-looking statements or Assumptions to reflect events or circumstances that arise after the date made or to reflect the occurrence of unanticipated events. Sponsor’s forward-looking statements and Assumptions are hypothetical, not based on actual investment achievements or events, and are presented solely for purposes of providing insight into the Sponsor’s investment objectives, detailing Sponsor’s anticipated risk and reward characteristics, and establishing a benchmark for future evaluation of actual results; therefore, they are not a predictor, projection, or guarantee of future results. You should not rely on Sponsor’s forward-looking statements as a basis to invest.
Importantly, we do not adopt, endorse, or provide any assurance of returns or as to the accuracy or reasonableness of Sponsor’s Assumptions or forward-looking statements.
No Reliance on Past PerformanceAny description of past performance is not a reliable indicator of future performance and should not be relied upon as the primary basis to invest.
Sponsor’s Use of DebtA substantial portion of the total cost of the real estate asset acquired by the Sponsor with investor funds (“Property”) will be paid with borrowed funds, i.e., debt. Sponsor’s estimated rates and terms of the debt financing are subject to lender approval, and there is no assurance that the Sponsor will secure debt at the rates and terms presented on this Page or in the Sponsor’s Investment Documents, or at all. The use of borrowed money to acquire real estate is referred to as leveraging, which can amplify losses and could result in lender foreclosure. In addition, if the debt includes a variable (or “floating”) interest rate, the total amount of interest paid over the term of the debt will fluctuate and can increase. As a result, Sponsor’s use of debt can result in a loss of some or all of your investment.
Sponsor’s Offering is Not RegisteredSponsor’s securities offering will not be registered under the Securities Act of 1933, as amended (the “Securities Act”), in reliance upon the exemptions from registration pursuant to Rule 506(c) of Regulation D as promulgated under the Securities Act (“Private Placement”). In addition, the offering will not be registered under any state securities laws in reliance on exemptions from state registration. Such securities (your ownership interests) are subject to restrictions on transferability and resale and may not be transferred or resold except as permitted under applicable state and federal securities laws pursuant to registration or an available exemption. All Private Placements on the Platform are intended solely for “Accredited Investors,” as that term is defined in Rule 501(a) under the Securities Act.
No Investment AdviceNothing on this Page should be regarded as investment advice (either with respect to a particular security or regarding an overall investment strategy), a recommendation, an offer to sell, or a solicitation of or an offer to buy any security. Advice from a securities professional is strongly advised to understand and assess the risks associated with real estate or private placement investments. For additional information on RM Securities’ involvement in this offering, please carefully review the Sponsor’s Investment Documents, and RM Securities’ Form CRS, Regulation Best Interest Disclosures, and Limited Brokerage Services Agreement.
1031 Exchange RiskInternal Revenue Code Section 1031 (“Section 1031”) contains complex tax concepts and certain tax consequences may vary depending on the individual circumstances of each investor. RM Securities and its affiliates make no representation or warranty of any kind with respect to the tax consequences of your investment or that the IRS will not challenge any such treatment. You should consult with and rely on your own tax advisor about the tax aspects with respect to your particular circumstances.