The team at our affiliated broker-dealer, RM Securities, conducts diligence on of the issuer, including detailed background checks, criminal checks, bad actor checks, and reference checks on sponsors. In addition to screening for any criminal background, we may also turn down sponsors due to poor reference checks, even if the background and criminal checks are satisfactory.
We require unaffiliated sponsors to use an unaffiliated third-party escrow agent.* When an investor makes an investment with such sponsors using the RealtyMogul platform, the investor’s money is transferred directly into a third-party escrow account. All closing conditions in connection with a sponsor’s contingency offering need to be met before the third-party escrow agent will approve releasing investor funds to the issuer or general partner. For example, if an issuer or general partner plans to use funds for a real estate acquisition that does not ultimately transact, the third-party escrow agent will not transfer investor funds to the issuer or general partner, and funds will be returned to investors.
Unless otherwise disclosed, escrow accounts are not required for some investments that accommodate 1031 investments where the property is already acquired.
Our processes typically includes visiting certain properties (or a subset of properties if it's a fund) to confirm the real estate is what and where the real estate is supposed to be. For certain properties that accommodate 1031 exchange investments, the team will review third-party prepared due diligence reports in lieu of a site visit.
We have formalized processes and checklists for every private placement deal listed on the platform.


Phoenix is one of the country’s fastest-growing markets. Urban Land Institute’s 2022 Emerging Trends in Real Estate ranked the MSA as a top migration destination for people & companies. The Phoenix MSA boasts 5.1M people and an unemployment rate of 3.2%, and rents increased in the Phoenix multifamily market by over 20% YoY in 2021. The vacancy rate across the market is 6.9%, which is 2.1% lower than the general MSA.

The site is an infill location adjacent to services, amenities, and a high-traffic count intersection. The Property is within walking distance to the light rail into downtown Tempe and is located less than 2 miles from the 101, 202, and 60 highways, providing direct access to the greater Phoenix area.

The development will benefit from a GPLET (property tax abatement) agreement with the City of Mesa for 8 years after construction, which will generate significant tax savings and add over $4M in present value to the exit price. The Project also includes optionality for an Opportunity Zone investment, after sale, with a generational opportunity to pay no capital gains tax on future profits.
StarPoint Properties
StarPoint Properties is a real estate investment and operating company with a 25-year+ track record. Founded in 1995 and headquartered in Beverly Hills, StarPoint aims to outperform other alternative investment vehicles by leveraging its seasoned management team, proprietary underwriting systems, decades of developed infrastructure, and deep acquisition network. With a focus on the acquisition, development, and redevelopment of under-valued multifamily and commercial properties, StarPoint has delivered a weighted average IRR of 24.6% to investors since inception.
https://starpointproperties.com/-
 Paul DaneshradChief Executive Officer
 -
 Greg JonesChief Financial Officer
 -
 Sandy SchmidDirector of Acquisitions & Development
Paul Daneshrad founded StarPoint Properties in 1995 and has built one of the most respected real estate investment and development firms in the industry. StarPoint prides itself on delivering, decade after decade, market-leading returns to its investors and providing asymmetrical returns that have proven to outperform most alternate investments. Mr. Daneshrad’s 30-year tenure and extensive real estate experience built the company into the vertically integrated real estate firm that it is today. He is considered an industry expert within the real estate investment community, often speaking at national conferences, and has been cited and interviewed by multiple real estate publications, including Net Lease Forum, Multi-Family Executive, California Real Estate Journal, Multi-Housing News, National Real Estate Investor, Real Estate Southern California, and Commercial Property News. Mr. Daneshrad graduated from California State University Northridge with a degree in Marketing.
Greg Jones directs all financial aspects of StarPoint Properties, including accounting practices, budgeting, financial analysis, corporate reporting, job costing, and monitoring of financial performance. Mr. Jones has over 30 years of experience in the real estate industry. Prior to joining StarPoint, he spent 7 years with The Irvine Company, one of America’s largest private real estate developers. Serving as Senior Vice President of Finance, Mr. Jones was responsible for all the financial aspects of its existing and growing portfolio of apartment homes. Prior to the Irvine Company, Mr. Jones spent 10 years as Vice President, Controller of Trizec Properties, Inc., a large, publicly-traded REIT with developments and holdings in both retail and office located throughout North America. Mr. Jones began his career in real estate in 1990 at Intercontinental Hotels. Mr. Jones earned a Bachelor of Commerce from the University of Calgary and further obtained his Chartered Accountant and Certified Public Accountant Designation during his four years as an Audit Manager with Thorne Ernst & Whiney Chartered Accountants.
Sandy Schmid oversees the firm’s acquisition and development departments. Mr. Schmid has over 20 years of real estate experience as an acquisitions officer, architect, builder, and developer. He has sourced over $1billion of development projects for residential units and has led entitlements to over $1 billion of development. Prior to StarPoint, he sourced land acquisitions and managed diligence, entitlements, and construction for several of the country’s leading multifamily merchant developers. His roles included Director of Acquisitions and Development at JPI, Development Director at Blueridge Multifamily, and Development Associate at SummerHill Apartment Communities. Mr. Schmid started his real estate career as an architectural draftsman and builder for Habitat for Humanity. Mr. Schmid earned his bachelor’s degree from Trinity College in Hartford, CT, and a dual degree, Master of Business Admiration and Master of Real Estate Development from the University of Southern California.
StarPoint Properties Track Record(1)
| Property | City | State | Asset Type | Acq Date | # Units | Sq. Ft. | Purchase Price | Sale Price/Est. Value |
| 62 Historical Dispositions | Various | Various | $250,018,007 | $439,698,953 | ||||
| Longridge | Studio City | CA | Multifamily | 1995 | 29 | 25,088 | $1,394,500 | $14,500,000 |
| Colfax | North Hollywood | CA | Multifamily | 1997 | 108 | 90,400 | $4,700,000 | $58,955,750 |
| PandO | Fresno | CA | Office | 2004 | 102,580 | $21,250,000 | $28,000,000 | |
| Roxbury | Beverly Hills | CA | Office | 2005 | 19 | 102,266 | $43,450,000 | $154,500,000 |
| Peachtree | Norcross | GA | Retail | 2007 | 24 | 88,835 | $14,000,000 | $18,000,000 |
| Rosemead | Pasadena | CA | Multifamily / Retail | 2007 | 47 | 29,425 | $1,400,000 | $12,800,000 |
| Washington | Pasadena | CA | Multifamily | 2007 | 61 | 52,600 | $11,465,000 | $24,500,000 |
| William Cannon | Austin | TX | Retail | 2007 | 31 | 144,657 | $17,200,000 | $23,000,000 |
| Grismer | Burbank | CA | Multifamily | 2008 | 54 | 45,285 | $11,525,000 | $22,500,000 |
| Shaw | Fresno | CA | Office | 2012 | 61 | 152,419 | $13,100,000 | $15,160,000 |
| Indian Hill | Claremont | CA | Multifamily | 2014 | 75 | 66,627 | $15,750,000 | $23,800,000 |
| 3rd Street Promenade | Santa Monica | CA | Retail | 2017 | 2 | 30,660 | $30,300,000 | $31,370,000 |
| Camden | Beverly Hills | CA | Office | 2018 | 41 | 200,264 | $193,000,000 | $255,000,000 |
| Telegraph | Santa Fe Springs | CA | Retail / Industrial | 2018 | 16 | 53,975 | $12,300,000 | $12,300,000 |
| Aviation | Hawthorne | CA | Office | 2019 | 49,632 | $13,400,000 | $14,900,000 | |
| Legacy | Plano | TX | Multifamily | 2019 | 346 | 346,000 | $32,000,000 | $100,000,000 |
| Ocean | Santa Monica | CA | Ground Lease | 2019 | 34,200 | $65,000,000 | $65,000,000 | |
| 6th Street | San Bernardino | CA | Land (OZ Industrial Development) | 2020 | 427,895 | $6,500,000 | $6,500,000 | |
| Dalewood | Austin | TX | Multifamily | 2020 | 50 | 56,503 | $8,000,000 | $8,000,000 |
| East Loop | Fort Worth | TX | Retail | 2020 | 58,400 | $12,100,000 | $12,100,000 | |
| Locust | Long Beach | CA | Land (OZ Multifamily Development) | 2020 | 15,600 | $3,150,000 | $3,150,000 | |
| Mission | Jurupa Valley | CA | Retail | 2020 | 8 | 16,450 | $3,500,000 | $3,500,000 |
| Roscoe | North Hills | CA | Retail | 2020 | 2 | 52,260 | $6,250,000 | $6,250,000 |
| 73rd Ave | Denver | CO | Land (OZ Industrial Development) | 2021 | 415,562 | $4,918,000 | $4,918,000 | |
| Central | Riverside | CA | Retail / Office | 2021 | 9 | 16,002 | $4,025,000 | $4,025,000 |
| Dobson Station (Subject) | Mesa | AZ | Land (OZ Multifamily Development) | 2021 | 264,652 | $5,775,000 | $5,775,000 | |
| Estrella | Goodyear | AZ | Retail | 2021 | 8 | 38,913 | $7,600,000 | $7,600,000 |
| Hawes | Mesa | AZ | Land (OZ Industrial Development) | 2021 | 1,510,380 | $6,796,710 | $6,796,710 | |
| Portland | Newberg | OR | Retail | 2021 | 14,418 | $4,443,636 | $4,443,636 | |
| Trinity Gas Portfolio | Miami | FL | Retail | 2021 | 2 | 7,296 | $7,600,000 | $7,600,000 |
| 68th Ave | Denver | CO | Land (OZ Industrial Development) | 2022 | 311,018 | $6,700,000 | $6,700,000 | |
| Total | $838,610,853 | $1,401,343,049 |
(1) The above biography and track record were provided by the Sponsor and have not been independently verified by RM Technologies, LLC or its affiliates. . Past performance is not indicative of future results. Please carefully review the Disclaimers section below.
(2) Refer to the documents section for a Performance Graph
Business Plan
The Manager will complete the design and construction of the Project as described below and expects to sell the asset to either an Opportunity Zone (OZ) fund or the general market at or prior to the time when the Project receives its Temporary Certificate of Occupancy (TCO), which is anticipated to occur in early 2025. Investors in the development will benefit from a quick exit and a sale to a motivated buyer pool, with a StarPoint Right of First Refusal, which can pay a premium due to the significant tax advantages of the OZ program and benefit from investing in assets completely removed of construction risk. The returns will go beyond profits, with full implementation of policies and practices to create positive environmental, social, and governance impacts.
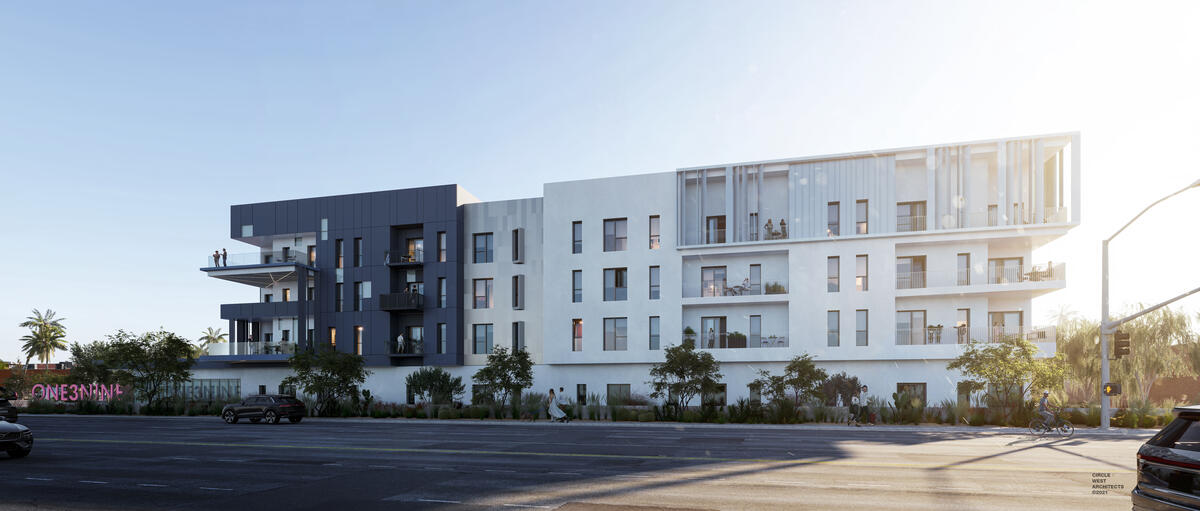
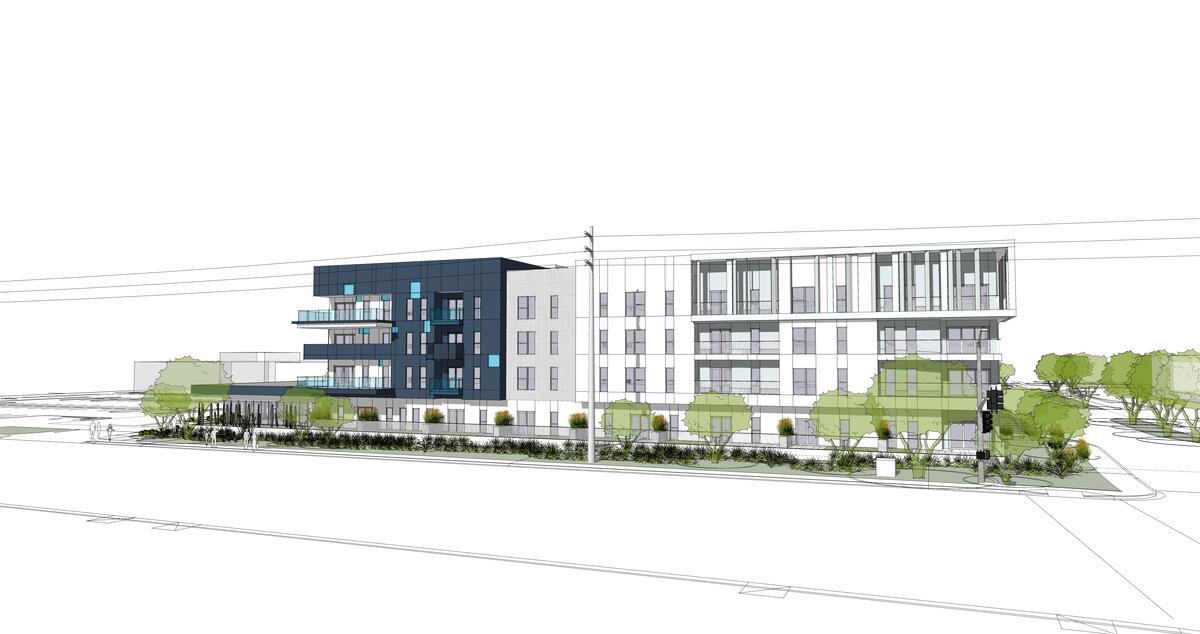
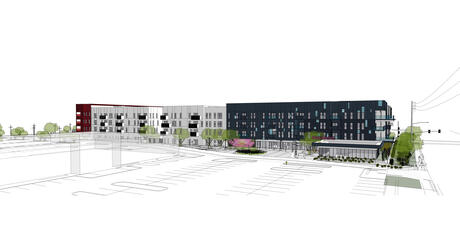
Project Description
Upon completion, Dobson Station will consist of four stories of Type V-A construction. The building will include modern amenities such as a swimming pool, fitness center, clubhouse, coworking facility, and group kitchen. The Project will also include 368 parking stalls, split between tuck-under and on-grade parking. The unit mix will consist of Studios, 1-Bed/1-Bath, and 2-Bed/2-Bath with an average unit size of 837 SF — well above the market average.
Location Description
Dobson Station boasts an exceptional location near Phoenix’s main transportation arteries. Located one mile from SR-101, one and ½ miles from SR-202, and two miles from US-60, future residents will have incredible access to the region’s polycentric job centers and amenities. Notably, located 5 minutes from the nearby Metro Phoenix light rail stop, residents will have easy, car-free access to Downtown Mesa, Arizona State University, Phoenix Sky Harbor Airport, and Downtown Phoenix. Additionally, the Project is directly adjacent to a Safeway neighborhood center with multiple retail amenities and boasts a walk score of 78 and a bike score of 94.
Development Costs
| $ Amount | Per Unit | |
| Land Cost | $7,100,000 | $28,980 |
| Hard Costs | ||
| Construction | $48,340,580 | $197,308 |
| General Contractor's Fee & Overhead | $1,126,291 | $4,597 |
| GC Contingency | $765,000 | $3,122 |
| Owner Inflation | $0 | $0 |
| Total Hard Costs | $50,231,871 | $205,028 |
| Soft Costs | ||
| Municipal Fees & Permits | $1,200,000 | $4,898 |
| Consultants (DD, Entitlements, A&E) | $2,306,196 | $9,413 |
| Marketing & FF&E | $537,000 | $2,192 |
| Owners Insurance | $1,484,918 | $6,061 |
| Legal & Accounting | $475,000 | $1,939 |
| Property Taxes | $294,115 | $1,200 |
| Pre-Opening Expense / Operating Deficit | $655,039 | $2,674 |
| Total Soft Costs | $6,952,268 | $28,377 |
| Financing Costs | ||
| Construction Interest | $5,133,989 | $20,955 |
| Financing Costs | $719,116 | $2,935 |
| Total Financing Costs | $5,853,105 | $23,890 |
| Other Costs | ||
| Developers Fee | $1,959,043 | $7,996 |
| Construction Management Fee | $750,000 | $3,061 |
| Loan Fee | $520,000 | $2,122 |
| Closing Costs | $35,500 | $145 |
| Owner's Contingency | $2,618,066 | $10,686 |
| Total Other Costs | $5,882,609 | $24,011 |
| Grand Total | $76,019,853 | $310,285 |
Investor Q&A 7/19/2022
The Project, located near the intersection of Dobson Road and Main Street, is situated only one mile away from the SR-101 freeway and a five-minute walk from a Metro light-rail stop. Site work, including demolition, utility infrastructure, and grading completed in Q2 2023, with the Project exit expected in early 2025.
Unit Mix
| Unit Type | # of Units | Avg SF/Unit | $ / Unit | $ / SF |
| Studio | 28 | 568 | $1,690 | $2.98 |
| 1x1 | 124 | 751 | $1,843 | $2.45 |
| 2x2 | 93 | 1,033 | $2,190 | $2.12 |
| Total/Averages | 245 | 837 | $1,957 | $2.34 |
Lease Comparables
| Metro 101 | Cadia Crossing | The Retreat at Rio Salado | Skye at McClintock Station | Volta on Broadway | Averages | Subject | |
| Year Built | 2019 | 2017 | 2020 | 2017 | 2016 | 2018 | 2024 |
| # of Units | 259 | 256 | 276 | 423 | 194 | 282 | 245 |
| Average Rental Rate | $2,175 | $1,955 | $1,932 | $1,962 | $1,991 | $2,003 | $1,928 |
| Average Unit Size | 781 | 1,034 | 893 | 914 | 940 | 912 | 837 |
| Average $/SF | $2.78/SF | $1.89/SF | $2.16/SF | $2.15/SF | $2.12/SF | $2.22/SF | $2.30/SF |
| Levels | 4 | 4 | 4 | 4 | 4 | 4 | |
| Occupancy | 92.00% | 95.00% | 95.00% | 95.00% | 94.00% | 94.20% | |
| Distance from subject | 1.2 mi | 7.5 mi | 1.2 mi | 2.0 mi | 2.7 mi | 2.9 mi | |
| $/Unit (Studio) | $1,941 | - | $1,539 | - | $1,654 | $1,711 | $1,654 |
| SF (Studio) | 522 SF | - | 582 SF | - | 738 SF | 614 SF | 568 SF |
| $/SF (Studio) | $3.72/SF | - | $2.64/SF | - | $2.24/SF | $2.87/SF | $2.91/SF |
| $/Unit (1x1) | $2,078 | $1,702 | $1,713 | $1,725 | $1,863 | $1,816 | $1,809 |
| SF (1x1) | 699 SF | 738 SF | 755 SF | 735 SF | 738 SF | 733 SF | 751 SF |
| $/SF (1x1) | $2.97/SF | $2.31/SF | $2.27/SF | $2.35/SF | $2.52/SF | $2.48/SF | $2.41/SF |
| $/Unit (2x2) | $2,325 | $2,138 | $2,341 | $2,195 | $2,316 | $2,263 | $2,171 |
| SF (2x2) | 1,276 SF | 1,088 SF | 1,113 SF | 1,058 SF | 1,033 SF | 1,114 SF | 1,033 SF |
| $/SF (2x2) | $1.82/SF | $1.97/SF | $2.10/SF | $2.07/SF | $2.24/SF | $2.04/SF | $2.10/SF |
Sales Comparables
| Seventyone15 McDowell | Craft at Gilbert & Baseline | Hudson on Farmer | Sentral Old Town | Roadrunner on McDowell | Averages | Subject | |
| Date Sold | Oct-22 | Jun-22 | May-22 | Apr-22 | Feb-22 | 2024 | |
| Year Built | 2022 | 2018 | 2021 | 2021 | 2021 | 2021 | 2024 |
| # of Units | 274 | 104 | 171 | 160 | 356 | 213 | 245 |
| Average Unit Size | 860 SF | 1018 SF | 853 SF | 968 SF | 828 SF | 905 SF | 837 SF |
| Sale Price | $150,000,000 | $45,000,000 | $96,000,000 | $121,000,000 | $193,500,000 | $121,100,000 | $99,386,265 |
| $/Unit | $547,445 | $432,692 | $561,404 | $756,250 | $543,539 | $568,266 | $405,658 |
| $/SF | $637 | $425 | $658 | $781 | $656 | $631 | $485 |
| Cap Rate | 5.00% | ||||||
| Building Size | 235,640 SF | 105,872 SF | 145,863 SF | 154,880 SF | 294,768 SF | 187,405 SF | 205,009 SF |
| Distance from subject | 6.9 mi | 7.9 mi | 4.4 mi | 10.0 mi | 7.5 mi | 7.3 mi |
Market Overview
Phoenix is a Tier-1, rapidly growing market. The Phoenix MSA boasts 5.1M people, with a population growth of 20% since 2010. The unemployment rate was 3.2% as of the end of 2021, with YoY job growth of 5.6%. Over 30 Fortune 500 companies are headquartered or have major operations in Phoenix, and the Greater Phoenix Economic Council reported that 270 global companies are seeking to add or increase their presence. More employment opportunities in the Valley combined with a lower cost of living compared to other large metros (Rent Share of Wallet is 31.9%) will continue to attract new residents, creating historic housing demand.
Submarket Overview
Mesa, with over 500K residents, is the 37th largest city in the US (larger than Miami, St. Louis, and Minneapolis) & the 2nd largest city in the Phoenix MSA, with over 40K students enrolled in 10 colleges and universities within the city limits.
The Competitive Market Area ("CMA") demographics are as follows (the CMA is defined as the area of Mesa north of Route 60):
- 375K people in 143K total households, with 143K people in the workforce
- Median age of 36, with a median income of $53K
- 42% of the population are renters
- High job density, with 123K jobs in the CMA
- 89% of people over age 25 have a high school diploma, while 27% have a bachelor’s degree or higher
Dobson Station is adjacent to community-serving retail, public transportation, and higher education options, and is a short drive from the main highways of Phoenix.


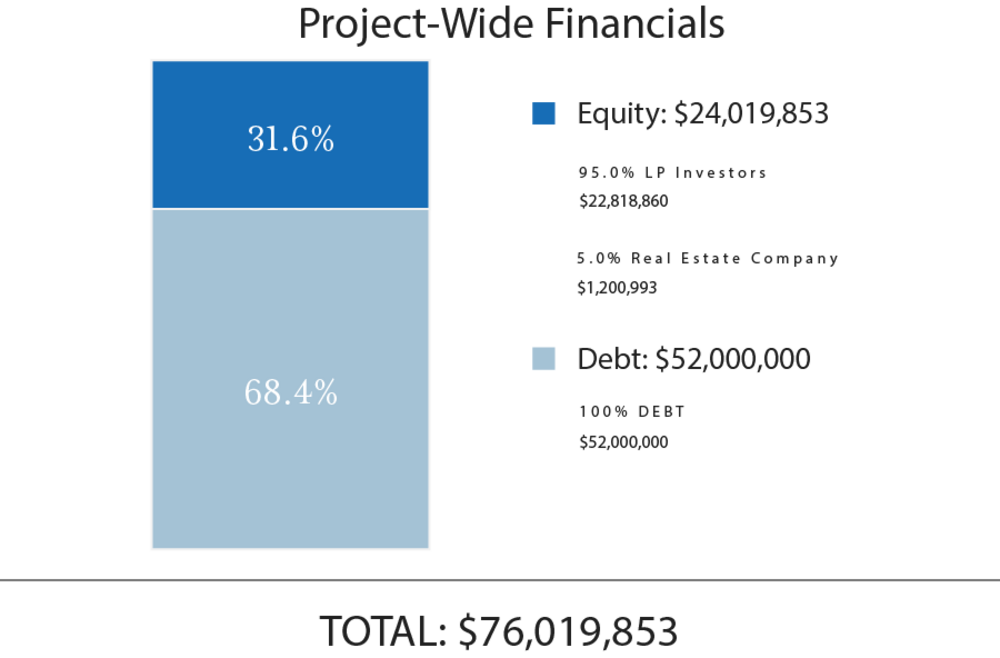
Total Project Capitalization
| Sources of Funds | $ Amount | $/Unit |
| Debt | $52,000,000 | $212,245 |
| GP Investor Equity(3) | $1,200,993 | $4,902 |
| LP Equity | $22,818,860 | $93,138 |
| Total Sources of Funds | $76,019,853 | $310,285 |
| Uses of Funds | $ Amount | $/Unit |
| Land Acquisition Price | $7,100,000 | $28,980 |
| Development Fee | $1,959,043 | $7,996 |
| Loan Fee | $676,000 | $2,759 |
| Closing Costs | $461,333 | $1,883 |
| Hard Costs | $50,231,871 | $205,028 |
| Soft Costs | $6,526,435 | $26,639 |
| Financing Costs | $563,117 | $2,298 |
| Other Costs | $8,502,055 | $34,702 |
| Total Uses of Funds | $76,019,854 | $310,285 |
(3) The Sponsor’s equity contribution may consist of friends and family equity and equity from funds controlled by the Sponsor.
The expected terms of the debt financing for the Project are as follows:
- Lender: Stonehill Strategic Capital
- Term: 3 Years
- LTC: 68.4%
- Estimated Proceeds: $52,000,000
- Interest Type: Floating
- Annual Interest Rate: The greater of (i) SOFR + 7.50% and (ii) 11.50%
- Interest-only Period: Full Term
- Amortization: N/A
- Prepayment Terms: $5,000,000 of minimum interest on the total loan commitment shall be due to Lender
- Extension Requirements: 1 twelve (12) month extension; 50 bp extension fee.
- Modeled Refinance: No
(4) A substantial portion of the total acquisition of the Property will be paid with borrowed funds, i.e., debt. Please carefully review the Disclaimers section below for additional information concerning the Sponsor's use of debt.
The Manager intends to make distributions as follows:
- To the Investors, pari passu, all operating cash flows to a 10.0% IRR;
- 80% / 20% (80% to Investors / 20% to Promoted/Carried Interest) of excess cash flow to a 14.0% IRR;
- 70% / 30% (70% to Investors / 30% to Promote/Carried Interest) of excess cash flow thereafter.
The Manager intends to make distributions to investors after the payment of the company's liabilities (loan payments, operating expenses, and other fees as more specifically set forth in the Offering Documentation, in addition to any member loans or returns due on member loans). Distributions are at the discretion of the Manager, who may decide to delay distributions for any reason, including maintenance or capital reserves.
The Manager will receive a promoted/carried interest as indicated above.
| Project-Level Cash Flows | ||||||
| Year 0 | Year 1 | Year 2 | Year 3(5) | |||
| Net Cash Flow | ($24,019,853) | $0 | $0 | $45,756,811 | ||
| Cash Flows to Investors via RM Platform(6) | ||||||
| Year 0 | Year 1 | Year 2 | Year 3(5) | |||
| Net Cash Flow | ($10,305,556) | $0 | $0 | $17,327,090 | ||
| Cash Flows to Investors via RM Platform - Hypothetical $50,000 Investment(6) | ||||||
| Year 0 | Year 1 | Year 2 | Year 3(5) | |||
| Net Cash Flow | ($50,000) | $0 | $0 | $84,067 | ||
(5) Stub year of one month
(6) RM Technologies, LLC and its affiliates do not provide any assurance of returns. Returns presented are net of all fees. Please carefully review the Fees and Disclaimers sections below for additional information concerning Sponsor’s use or projected returns and fees paid to Sponsor and RM Technologies, LLC
Certain fees and compensation will be paid over the life of the ownership of the Project; please refer to the Offering Documentation for specific details. The following fees and compensation will be paid(7)(8):
| One-Time Fees: | |||
| Type of Fee | Amount of Fee | Received By | Paid From |
| Developer Fee | 3.9% of all development costs | Manager or its designated affiliate | Capitalization |
| Equity Financing Fee | 0.76% of the non-Sponsor contributed equity | Manager or its designated affiliate | Capitalization |
| Debt Financing Fee | None | Manager or its designated affiliate | Capitalization |
| Recurring Fees: | |||
| Type of Fee | Amount of Fee | Paid From | |
| Asset Management Fee | 1.5% of aggregate capital contributions, paid monthly | Manager | Cash Flow |
| Property Management Fee | 3.0% of gross operating income, paid monthly | StarPoint Property Management, LLC, or a designated affiliate of Manager | Cash Flow |
| RM Technologies, LLC Fees, to be paid by the Manager: | Received By | ||
| Technology Solution Licensing Fee(8) | Flat one-time licensing fees of $15,000 plus $1,500 per each prospective investor onboarded by Sponsor through its license and use of RM Technologies’ Technology Solution | RM Technologies, LLC | |
| Administration Solution Licensing Fee(8) | Flat quarterly licensing fee of $125 per investor serviced by Sponsor through the license and use of RM Technologies’ Administration Solution | RM Technologies, LLC | |
(7) Fees may be deferred to reduce impact to investor distributions.
(8) Please see the Fees and Disclaimers sections below for additional information concerning fees paid to RM Technologies, LLC.
RM Securities, LLC, its registered representatives, affiliates, associated persons, and personnel of its affiliates who may also be associated with it, including our associated persons and personnel of our affiliates who are also be associated with RM Securities, LLC (it (“RM Securities,” “we,” “our,” or “us”) will receive fees, expense reimbursements, and other compensation (“Fees”) from the issuer of this investment offering, its sponsor, or an affiliate thereof (“Sponsor”), or otherwise in connection with Sponsor’s offering. The Fees paid to us are in addition to other fees you will pay to Sponsor or in connection with Sponsor’s investment offering. You will pay Fees to Sponsor, either directly or indirectly as an investor in the Sponsor’s offering. Sponsor will use the Fees you pay, as well as funds you invest in the relevant offering, to compensate us. The Fees paid to us will directly or indirectly be borne by you as the investor (typically, but not always, in the form of an expense of the Sponsor’s offering in which you invest) because such Fees will reduce the proceeds available for distribution to you and reduce the amount you earn over time.
For more information on the Fees paid to us, or any other Fees you will pay in connection with Sponsor’s offering, please carefully review the Sponsor’s Investment Documents. Please also carefully review RM Securities’ Form CRS, Regulation Best Interest Disclosures, and Limited Brokerage Services Agreement.
No Approval, Opinion or Representation, or Warranty by RM Securities, LLCSponsor has provided, approved, and is solely responsible in all aspects for the information on this webpage (“Page”), including Sponsor’s offering documentation, which may include without limitation the Private Placement Memorandum, Operating or Limited Partnership Agreement, Subscription Agreement, the Project Summary and all exhibits and other documents attached thereto or referenced therein (collectively, the “Investment Documents”). The Investment Documents linked on this page have been prepared and posted by Sponsor, and not by RM Securities. We did not assist in preparing, do not adopt or endorse, and we are not otherwise responsible for, the Sponsor’s Investment Documents. We make no representations or warranties as to the accuracy of information on this Page or in the Sponsor’s Investment Documents and we accept no liability therefor. No part of the information on this Page or in the Sponsor’s Investment Documents is intended to be binding on us.
Sponsor’s Information Qualified by Investment DocumentsThe information on this Page is qualified in its entirety by reference to the more complete information about the offering contained in the Sponsor’s Investment Documents. The information on this Page is not complete and subject to change at the Sponsor’s discretion at any time up to the closing date. The Sponsor’s Investment Documents and supplements thereto contain important information about the Sponsor’s offering including relevant investment objectives, the business plan, risks, charges, expenses, and other information, which you should consider carefully before investing. The information on this Page should not be used as a basis for an investor’s decision to invest.
Risk of InvestmentThis investment is speculative, highly illiquid, and involves substantial risk. There can be no assurances that all or any of Sponsor’s assumptions, expectations, estimates, goals, hypothetical illustrations, or other aspects of Sponsor’s business plans (“Assumptions”) will be true or that actual performance will bear any relation to Sponsor’s Assumptions, and no guarantee or representation is made that Sponsor’s Assumptions will be achieved. If Sponsor does not achieve its Assumptions, your investment could be materially and adversely affected. A loss of part or all of the principal value of your investment may occur. You should not invest unless you can readily bear the consequences of such loss. Sponsor’s Assumptions should not be relied upon as the primary basis for your decision to invest.
No Reliance on Forward-Looking Statements; Sponsor AssumptionsSponsor is solely responsible for statements made concerning forward-looking statements and Assumptions, which apply only as of the date made, are preliminary and subject to change, and are expressly qualified in their entirety by the disclosures and cautionary statements included in Sponsor’s Investment Documents, which you should carefully review. Neither RM Securities nor Sponsor are obligated to update or revise such forward-looking statements or Assumptions to reflect events or circumstances that arise after the date made or to reflect the occurrence of unanticipated events. Sponsor’s forward-looking statements and Assumptions are hypothetical, not based on actual investment achievements or events, and are presented solely for purposes of providing insight into the Sponsor’s investment objectives, detailing Sponsor’s anticipated risk and reward characteristics, and establishing a benchmark for future evaluation of actual results; therefore, they are not a predictor, projection, or guarantee of future results. You should not rely on Sponsor’s forward-looking statements as a basis to invest.
Importantly, we do not adopt, endorse, or provide any assurance of returns or as to the accuracy or reasonableness of Sponsor’s Assumptions or forward-looking statements.
No Reliance on Past PerformanceAny description of past performance is not a reliable indicator of future performance and should not be relied upon as the primary basis to invest.
Sponsor’s Use of DebtA substantial portion of the total cost of the real estate asset acquired by the Sponsor with investor funds (“Property”) will be paid with borrowed funds, i.e., debt. Sponsor’s estimated rates and terms of the debt financing are subject to lender approval, and there is no assurance that the Sponsor will secure debt at the rates and terms presented on this Page or in the Sponsor’s Investment Documents, or at all. The use of borrowed money to acquire real estate is referred to as leveraging, which can amplify losses and could result in lender foreclosure. In addition, if the debt includes a variable (or “floating”) interest rate, the total amount of interest paid over the term of the debt will fluctuate and can increase. As a result, Sponsor’s use of debt can result in a loss of some or all of your investment.
Sponsor’s Offering is Not RegisteredSponsor’s securities offering will not be registered under the Securities Act of 1933, as amended (the “Securities Act”), in reliance upon the exemptions from registration pursuant to Rule 506(c) of Regulation D as promulgated under the Securities Act (“Private Placement”). In addition, the offering will not be registered under any state securities laws in reliance on exemptions from state registration. Such securities (your ownership interests) are subject to restrictions on transferability and resale and may not be transferred or resold except as permitted under applicable state and federal securities laws pursuant to registration or an available exemption. All Private Placements on the Platform are intended solely for “Accredited Investors,” as that term is defined in Rule 501(a) under the Securities Act.
No Investment AdviceNothing on this Page should be regarded as investment advice (either with respect to a particular security or regarding an overall investment strategy), a recommendation, an offer to sell, or a solicitation of or an offer to buy any security. Advice from a securities professional is strongly advised to understand and assess the risks associated with real estate or private placement investments. For additional information on RM Securities’ involvement in this offering, please carefully review the Sponsor’s Investment Documents, and RM Securities’ Form CRS, Regulation Best Interest Disclosures, and Limited Brokerage Services Agreement.
1031 Exchange RiskInternal Revenue Code Section 1031 (“Section 1031”) contains complex tax concepts and certain tax consequences may vary depending on the individual circumstances of each investor. RM Securities and its affiliates make no representation or warranty of any kind with respect to the tax consequences of your investment or that the IRS will not challenge any such treatment. You should consult with and rely on your own tax advisor about the tax aspects with respect to your particular circumstances.